
The global financial ecosystem has reached a major inflection point at the start of Q2 2026. Bitcoin (BTC), now deeply embedded in the infrastructure of traditional finance (TradFi) while retaining its intrinsic characteristics as a decentralized digital asset, presents a market configuration of unprecedented complexity. Price action has been characterized by extreme volatility, oscillating violently between local highs near $100,000 and nervous consolidations in the $64,000–$69,000 range. This instability is the result of a monumental tug-of-war between institutional capital flows, algorithmic liquidations on derivatives markets, and global monetary policy realignments.
Fundamental Context: The Bitcoin Spot ETF War
Q1 2026 witnessed major upheavals in capital flows directed toward U.S. Bitcoin Spot ETFs. Since their launch, these funds have captured over $137 billion in assets under management, representing nearly 7% of Bitcoin’s total circulating supply. Historically, the third year of these vehicles’ existence corresponds to an acceleration in flows, mirroring what was observed with gold ETFs in the mid-2000s.
March 2026 closed on a resoundingly optimistic note with net inflows of $1.32 billion, ending four consecutive months of outflows totaling approximately $6.4 billion. However, the first days of April were again marked by spectacular outflows: $681 million in the first week, with a single day recording $486 million in net redemptions.
Granular analysis reveals a fascinating institutional dichotomy. During a difficult session with Bitcoin sliding toward $64,000, Fidelity’s FBTC lost $148.70M, ARKB shed $62.50M, and GBTC saw $56.63M in outflows — while BlackRock’s iShares Bitcoin Trust (IBIT) absorbed $60.03M in net inflows during the very same session. This asymmetric behavior is a classic symptom of institutional consolidation: major accounts are not exiting the asset class, but rotating strategically toward the deepest, most liquid vehicle.
The average cost basis of ETF investors currently sits around $84,000, indicating that current selling pressure comes primarily from short-term speculators, while the institutional core (Morgan Stanley, Bank of America, Wells Fargo, Vanguard) accumulates strategically.
Macroeconomics: The Federal Reserve’s Shadow
Bitcoin’s price action is also constrained by a heavy macroeconomic environment. The recent ISM Services PMI print at 54.4 — a 14-month high — demonstrates economic resilience that encourages the Fed to maintain restrictive monetary policy longer than anticipated. This tightening drains global liquidity and weighs directly on risk assets.
Paradoxically, geopolitical instability and proposals for a massive increase in U.S. defense spending ($500 billion projected for 2027) feed public deficits and monetary debasement — a phenomenon that historically constitutes the most fertile ground for Bitcoin’s long-term growth as an incorruptible store of value.
Institutional Forecasts for 2026
| Institution | 2026 Target | Key Catalysts | Key Risks |
|---|---|---|---|
| CoinShares | $100,000 – $175,000 | ETF inflows targeting $300B AUM, favorable SEC regulations | Policy delays, strategic reserve implementation |
| Galaxy Digital | $200,000 | ETFs surpassing $250B, adoption by 5 sovereign nations | Macro tightening, altcoin competition |
| JP Morgan | $160,000 | Lightning Network capacity tripled (8,000 BTC), post-Halving scarcity | Platform hacks, regulatory reversals |
| Bloomberg Intelligence | $150,000 | Historical post-Halving mean reversion, massive institutional allocation | Prolonged S&P 500 recession |
Market Microstructure: The Liquidation Heatmap
In cryptocurrency derivatives markets — which represent approximately 75–80% of total trading volume — traders use leverage to amplify their positions. The liquidation heatmap aggregates order book data from major exchanges (Binance, Bybit, OKX, Bitfinex) to visually map price levels where massive liquidation clusters accumulate, acting as powerful price magnets.
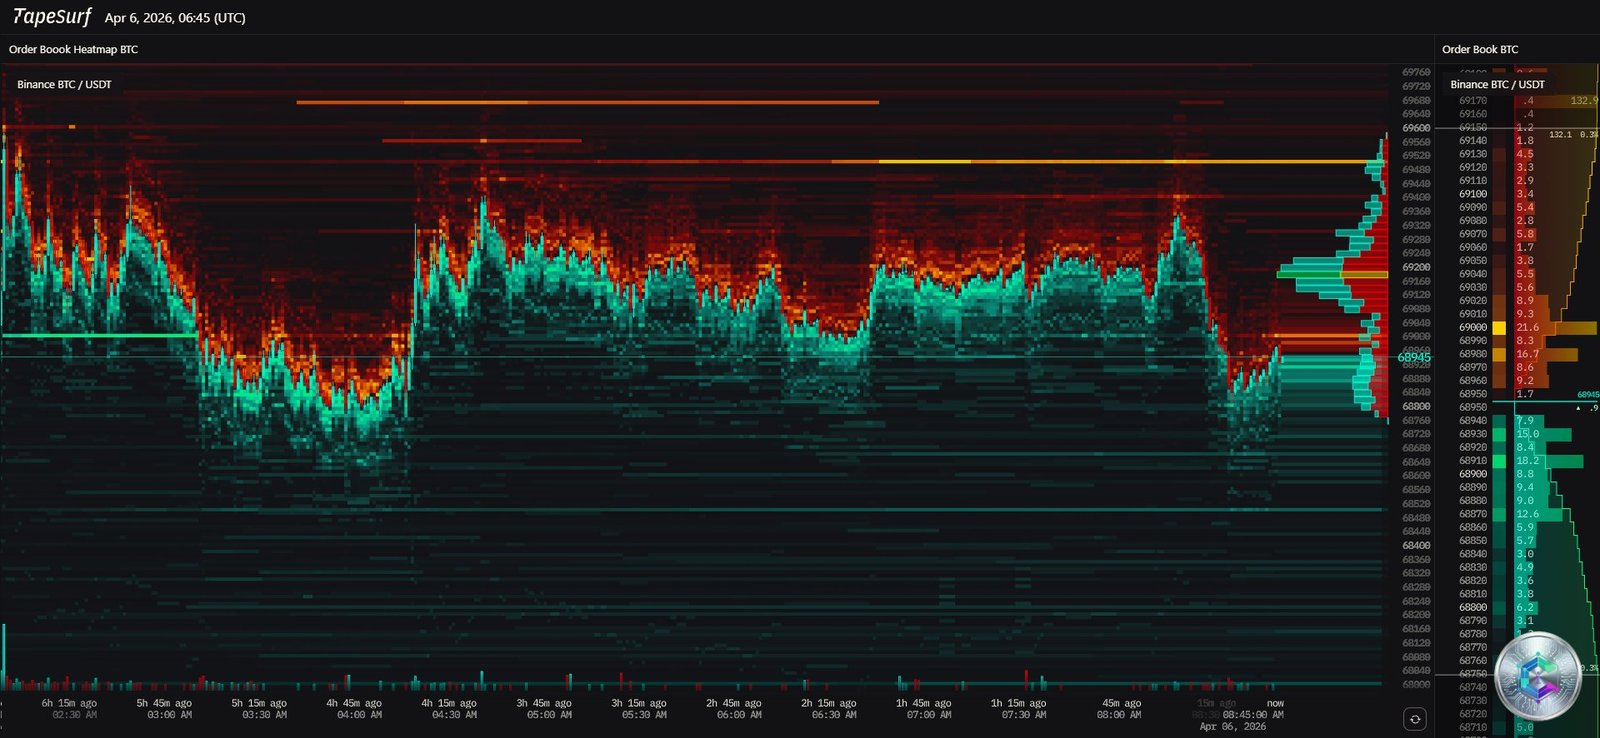
Coinglass data for the period around April 6, 2026 illustrates a purge of remarkable violence. Over a 24-hour period, the market experienced total liquidations of $533.88 million — with $401.12M in long positions liquidated against only $132.75M in shorts. A single $15.40 million BTC-USDT order liquidated on Bitfinex underscores the systemic risk level tied to leverage currently deployed by major players.
Mapping the Magnetic Poles
- Primary Upper Magnet ($88,000 – $90,200): The densest and most massive liquidity cluster sits precisely in the $89,800–$90,200 zone. Bitcoin has a mathematically high probability of being drawn toward this region to absorb these orders before any true directional trend establishes itself.
- Median Conflict Zones ($69,000 – $72,000): Significant liquidity pockets represent the intermediate technical barriers that price action must clear during any recovery.
- Lower Liquidity Void ($63,000 – $66,000): This zone remains a last-resort magnet if panic sets in, but the absence of immediate liquidity below current price indicates declining institutional selling pressure.
Multi-Timeframe Chart Analysis
15-Minute Chart: Total Capitulation & Imminent Bounce
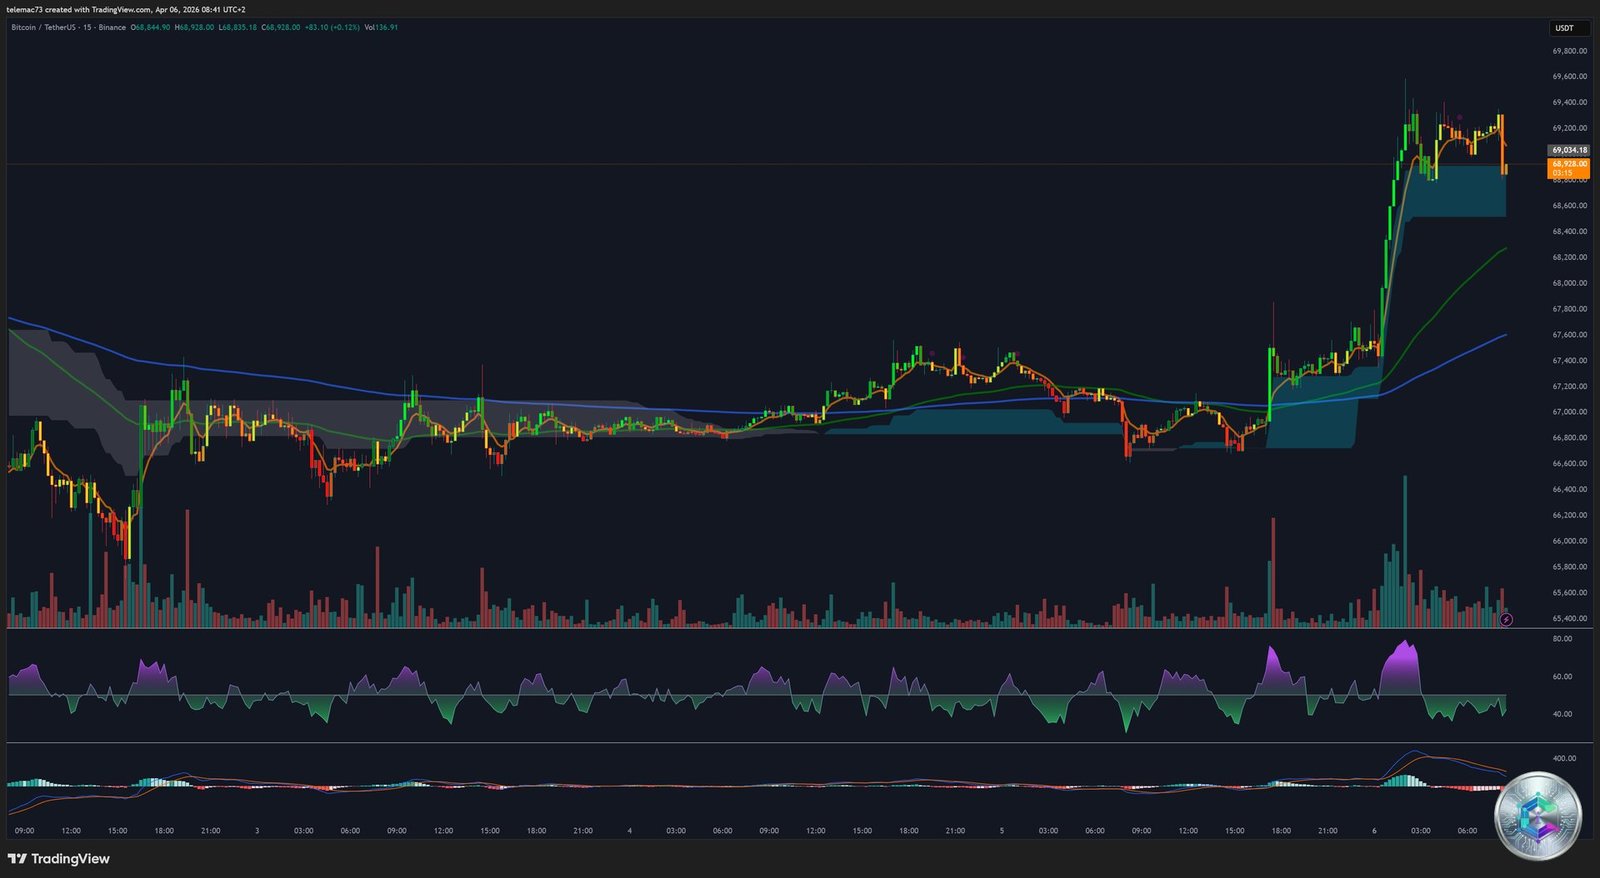
The 15-minute timeframe reveals the immediate anatomy of volatility. The short-term bearish trend is materialized by long red candles closing systematically near their lows. The most revealing element lies in the oscillators:
- RSI (16 periods): 18.06 — A value below 20 indicates total and irrational capitulation by sellers.
- StochRSI: 0.00 — Both indicators signal complete exhaustion of immediate bearish momentum.
- Immediate Support: $91,000–$92,000 zone, with a precise algorithmic price protection level at $91,231.
- Immediate Resistance: $94,000–$95,000, the statistically inevitable relief bounce target.
4-Hour Chart: The War of Flags
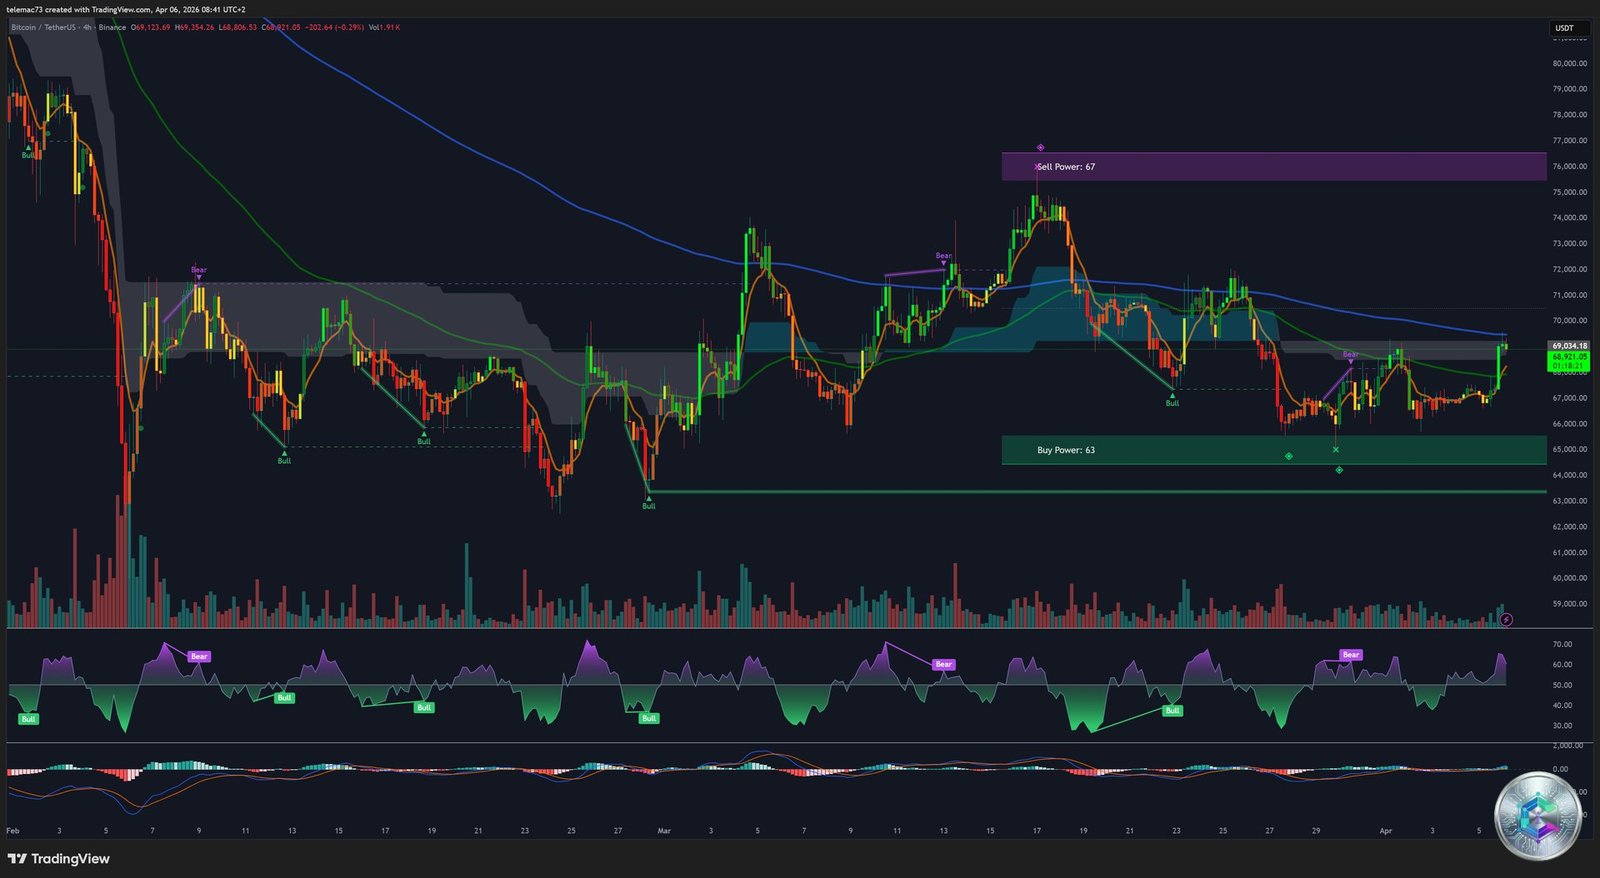
The 4-hour timeframe is the preferred battlefield for defining this week’s directional moves. Two competing readings clash:
Bullish Scenario — Bull Flag: A clear bull flag structure has formed after a strong vertical impulse (the flagpole). This continuation pattern, accompanied by tenacious defense of key supports and a double-bottom (W pattern) precisely on the $66,000 support, projects price toward the major resistance at $70,480.
Bearish Scenario — Bear Flag / Rising Wedge: The current consolidation could be a bear flag or rising wedge — both bearish continuation patterns. The 50-day SMA acts as a suffocating dynamic resistance. A downside break could target $48,000, or even $38,000 in the worst case.
Daily Chart: Symmetrical Triangle & Elliott Waves
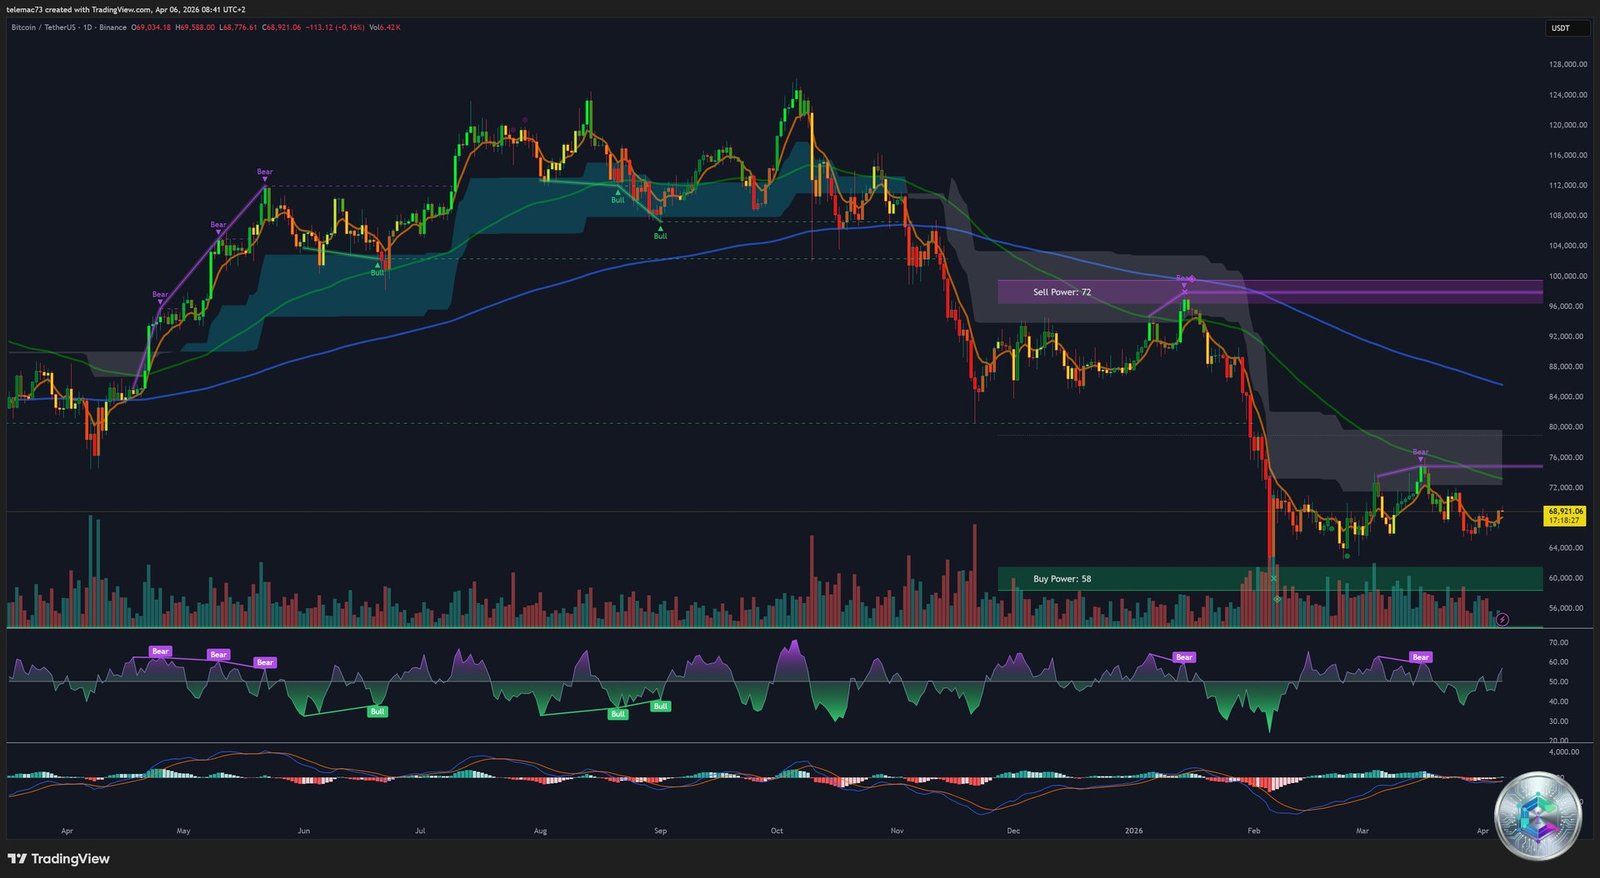
The daily chart displays an imposing Symmetrical Triangle — a neutral continuation pattern with approximately 65% breakout reliability. This structure reflects a precarious equilibrium between supply and demand, with extreme volatility compression announcing an imminent directional explosion:
- Bullish breakout: Beyond $90,000 (triangle resistance), the measured move objective projects a rally toward $107,400.
- Elliott Wave analysis: The market completed a 5-wave bullish impulse ($16,500 → $126,000) and is now in a structural A-B-C correction. Wave C could seek a floor in the $55,000–$58,000 zone, or even $53,000.
- The Greatest Bear Trap: A sudden drop followed by aggressive buying could constitute a historic « Christmas Bear Trap, » launching Bitcoin to new all-time highs on captured liquidity.
Oscillator Deep Dive
RSI: The Multi-Timeframe Paradox
- Aggregated daily RSI: 52.57–54.52 — Absolute neutral zone, constructive for bulls with considerable headroom before overbought territory.
- Real-time RSI (14-day): 74.34–80.59 — Severe overbought condition on recent impulsive bounces. The Stochastic Oscillator hovers around 99.2 and Williams %R at -0.601.
A local technical pullback is statistically probable to « cool off » these overheated indicators before a sustainable assault on macro resistances can be launched.
MACD: Divergent Signals
- Zero Compression: The histogram stagnates at 0.0000 with lines converging around -300 — the fingerprint of total market indecision, but potentially the precursor to a major bullish crossover.
- Momentum Impulse: In real-time, the MACD shows a strongly positive value of 532.2 with a categorical « Buy » signal. CCI at 99.60 and ADX at 51.11 confirm powerful directional force.
Moving Average Dynamics: Golden Cross Confirmed
As of April 6, 2026, quantitative analysis of all moving averages generates an overwhelming consensus of « Strong Buy » with 12 buy signals and 0 sell signals.
| Period | SMA | EMA | Signal |
|---|---|---|---|
| 5-Day | $69,058.6 | $68,938.3 | ✅ BUY |
| 10-Day | $68,502.0 | $68,580.1 | ✅ BUY |
| 20-Day | $67,786.8 | $68,110.0 | ✅ BUY |
| 50-Day | $67,376.4 | $67,535.7 | ✅ BUY |
| 100-Day | $67,064.6 | $67,320.4 | ✅ BUY |
| 200-Day | $67,212.7 | $67,548.9 | ✅ BUY |
The perfect sequential stacking (MA5 > MA10 > MA20 > MA50 > MA100 > MA200) illustrates a perfectly aligned structural bull trend. The institutional « 50 EMA Carry » strategy applies here: as long as price finds dynamic support on the 50 EMA (~$67,535) without breaking it on a sustained basis, the probability of macro rally continuation is maximized.
Strategic Mapping: Key Supports & Resistances
Pivot Points (April 6, 2026)
| Model | S2 | S1 | Pivot | R1 | R2 |
|---|---|---|---|---|---|
| Classic | $68,909 | $68,981 | $69,103 | $69,175 | $69,297 |
| Fibonacci | $68,983 | $69,028 | $69,103 | $69,177 | $69,222 |
| Camarilla | $69,017 | $69,035 | $69,103 | $69,070 | $69,088 |
| Woodie’s | $68,896 | $68,956 | $69,090 | $69,150 | $69,284 |
Resistance Zones (Glass Ceilings)
- $69,000 – $69,100: Universal Pivot Point and psychological neckline. The invalidation point for intraday weakness.
- $70,480 – $72,634: Congestion zone combining the symmetrical triangle upper boundary, the 4H bull flag objective, and the upper Bollinger Band. A confirmed break above $72,634 will open a technical air pocket.
- $73,595 – $74,500: Key historical resistance. Its destruction will propel Bitcoin toward $78,000, then the triangle’s algorithmic target at $107,400.
Support Zones (Defense Floors)
- $66,792 – $67,376: Moving average bulwark (50, 100, 200-day EMAs). The most critical dynamic support. As long as the EMAs hold price on daily closes, the macro bullish structure remains intact.
- $63,000 – $66,000: Lower heatmap magnet. This floor will absorb any correction triggered by an unexpected exogenous event.
- $60,490: Pivot abyss. Loss of this support would invalidate all bullish structures and trigger a structural purge (Elliott Wave C) toward $53,000–$58,000.
Strategic Conclusion
Bitcoin’s market architecture in early April 2026 presents exceptional kinetic tension. The market is trapped in a Gordian knot: a daily symmetrical triangle with volatility compression worthy of Bitcoin’s greatest historical moves, supported by a perfectly aligned Golden Cross, yet undermined by extreme nervousness on lower timeframes.
The liquidation heatmap offers the most pragmatic reading: having purged leverage excesses downward, market makers now have the mathematically vacant liquidity pockets above $89,000 in their crosshairs.
In summary: The direction Bitcoin takes upon exiting the consolidation zone ($67,000–$72,000) will dictate the reality of the entire second half of 2026. A convincing daily close above $69,100, followed by a clean break of the $72,634 resistance, will trigger an unstoppable algorithmic chain reaction toward six-figure price discovery. Conversely, abandoning the defensive moving average cluster at $67,000 would plunge the market into a deep corrective winter.
In this bipolar context, rigorous risk management and exclusive attention to daily closes at invalidation thresholds remain the only viable strategic imperatives.
⚠️ Disclaimer: This article is published for informational and educational purposes only. It does not constitute investment advice, or a recommendation to buy or sell any digital asset. Cryptocurrency markets are extremely volatile and carry significant risk of capital loss. Please consult a qualified financial advisor before making any investment decision.