
In late April 2026, Bitcoin (BTC) finds itself at a rare analytical inflection point. Trading in the compression zone of $77,000–$79,400, the asset sits at the crossroads of a charged macroeconomic backdrop, massive institutional absorption via spot ETFs, and an explosive chart geometry. This exhaustive analysis dissects fundamental, on-chain, and technical signals across three timeframes to model the most probable trajectories for the weeks ahead.
Macroeconomic Context: Geopolitics & Monetary Policy
The global environment shaping capital flows into Bitcoin is particularly charged this month. US–Iran ceasefire negotiations have reached a critical impasse, keeping Brent crude in the $101–$107/barrel range. The partial Strait of Hormuz blockade has reduced physical crude transport by approximately 40%, reigniting global inflationary expectations. US CPI remains at an uncomfortable 3.3% year-over-year, while the DXY index hovers around 98.51 and the 10-year Treasury yield stabilizes at 4.31%.
In this context, Bitcoin assumes a paradoxical dual role: hedge against monetary debasement and safe-haven asset in the face of geopolitical shocks. The FOMC meeting on April 28–29, 2026 is the quarter’s most decisive institutional catalyst. Futures markets price in a 99.5% probability of rates being held in the 3.50%–3.75% range. The real dynamic lies in forward guidance: the approaching end of Quantitative Tightening and the imminent succession of Jerome Powell by Kevin Warsh are injecting a monetary transition premium that smart money is beginning to price into BTC.
Institutional Dynamics: ETFs, Whales & On-Chain Data
Bitcoin’s fundamental supply-and-demand structure has been profoundly reshaped by its institutional absorption in 2026. US spot Bitcoin ETFs have posted nine consecutive days of net inflows, totaling $2.12 billion over this window. Total assets under management in the category now exceed $100 billion, led by BlackRock’s iShares Bitcoin Trust (IBIT), which manages over 800,000 BTC — approximately 4% of the total circulating supply.
On-chain analytics reveal a striking dichotomy: whale wallets (10–10,000 BTC) accumulated approximately 41,000 additional BTC (≈ $3.17B) over recent weeks, while small retail holders (under 0.1 BTC) acquired a negligible 46 coins over the same period. MicroStrategy now holds a colossal 815,061 BTC valued at over $63 billion. The depletion of exchange reserves — falling to multi-year lows as coins move to institutional cold storage — is creating the conditions for positive supply shocks. The Coinbase Premium Index, decisively positive this month, confirms that current spot demand is institutional and US-based — not speculative offshore leverage.
Order Book Microstructure & Liquidity Heatmap
The explosive move toward $79,485 was not driven by organic buying alone — it was supercharged by a rare short squeeze. Over a critical 24-hour window, $181 million of $216 million in total liquidations came exclusively from short positions. During the most intense single hour, the liquidation imbalance reached 4,362% against sellers — 97.7% of all market losses were borne by bearish traders.
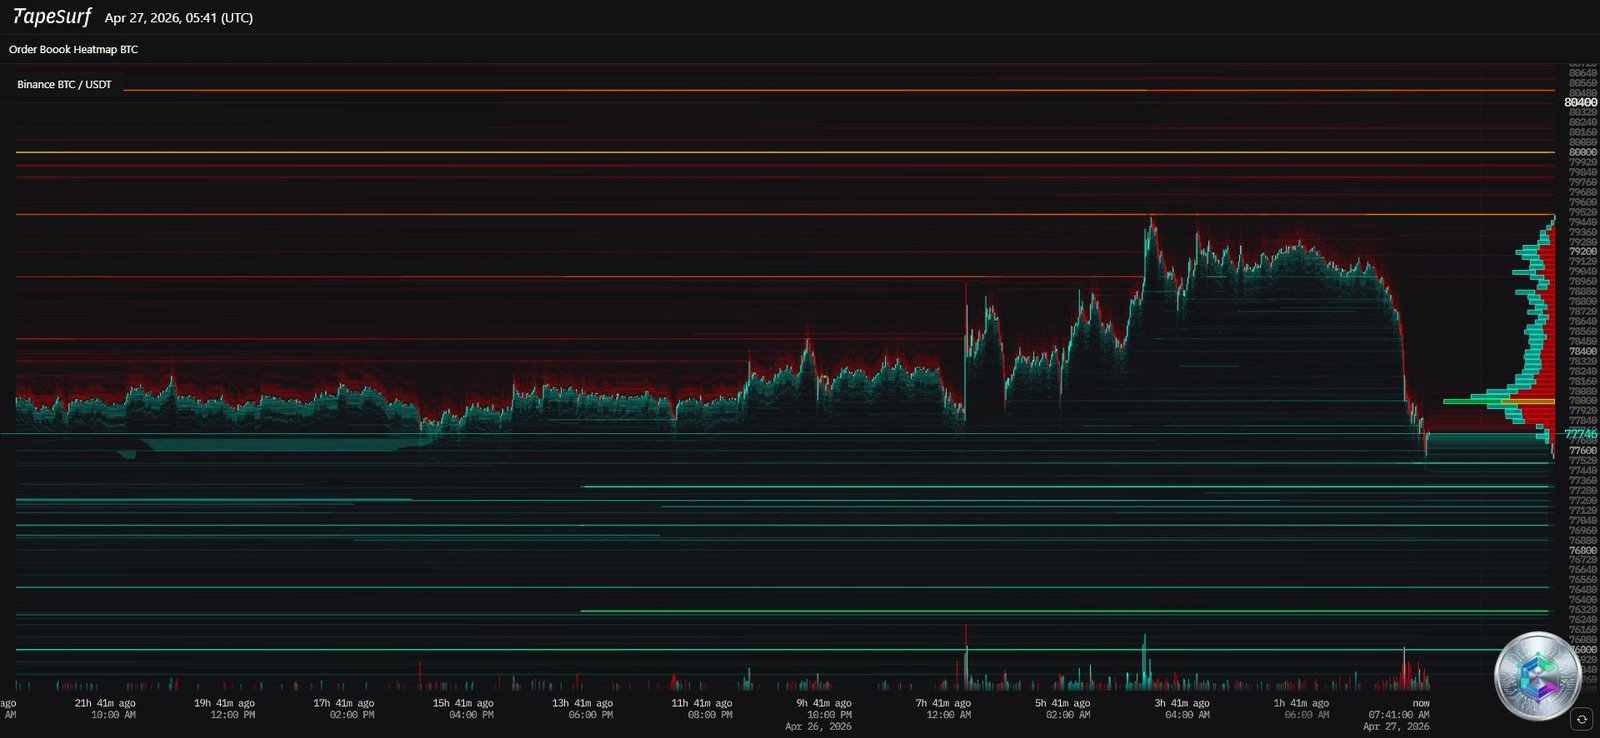
The heatmap analysis (above) reveals a very clear liquidity topography. On the upper side, a dense stratification of bright red bands intensifies around $79,400, $79,800, culminating in an extremely opaque barrier at the psychological $80,000 level — the ultimate Ask Wall. On the lower side, green strata visualize bid support between $76,000 and $77,400, with visually lower density, suggesting institutional buyers prefer dynamic intervention over passive limit orders. The Volume Profile displays a High Volume Node centered on the $77,700–$78,200 zone — confirming the market’s temporary equilibrium point before the next volatility expansion.
A counterintuitive signal: even as Bitcoin surged past $78,400, perpetual contract funding rates persisted in negative territory at -0.02% per 8-hour session (an annualized 22% premium paid by shorts to longs). This widespread retail disbelief is — paradoxically — latent bullish fuel, as it guarantees that every future price advance will be amplified by forced buybacks from trapped short sellers.
Multi-Timeframe Technical Analysis
Daily Chart: Ascending Triangle & MACD Golden Cross
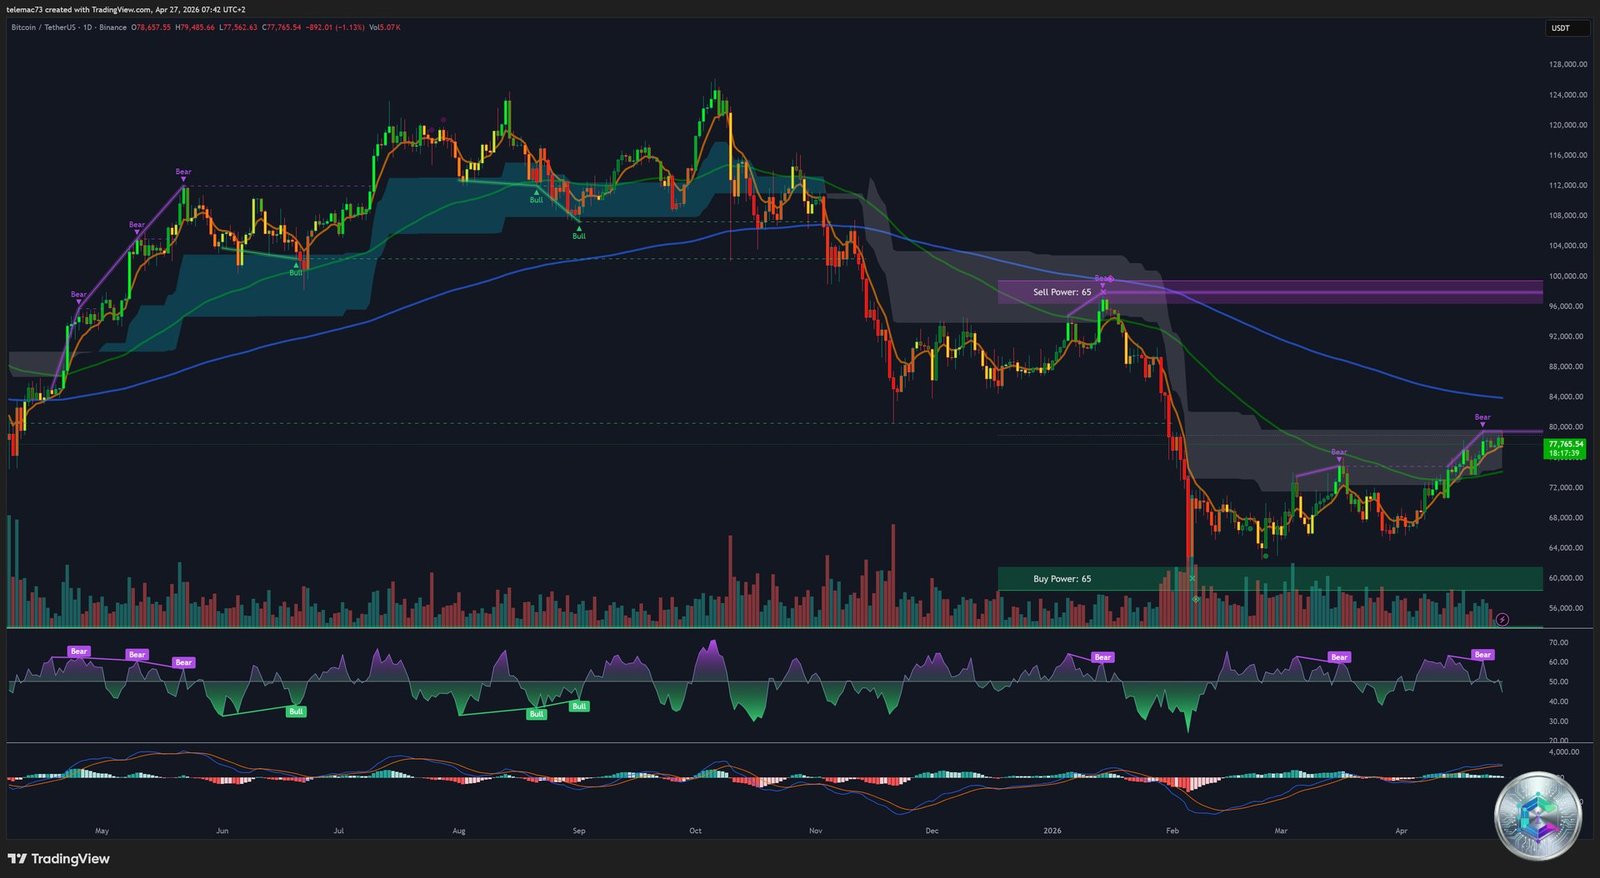
The daily chart is a textbook illustration of a major cycle reversal. After a deep capitulation from historical highs above $120,000 to a structural floor at $62,000–$65,000, the ongoing recovery draws a massive ascending triangle: static horizontal resistance approaching $80,000 and an oblique support line connecting a series of higher lows since $62,000. The theoretical confirmed breakout target projects into the $85,000–$87,000 range.
The daily MACD has just completed a Golden Cross above the zero line, with the histogram expanding into positive territory — a reliable signature of a tectonic regime change. The daily RSI, reading between 56 and 63, confirms robust organic momentum without any sign of excessive overbought conditions: the market has the kinetic fuel needed for a new bullish leg. The reclaim of the 50-day EMA ($70,000–$72,000), now flipped from resistance to support, confirms the strength of the directional move.
4-Hour Chart: Bull Flags & Consolidation
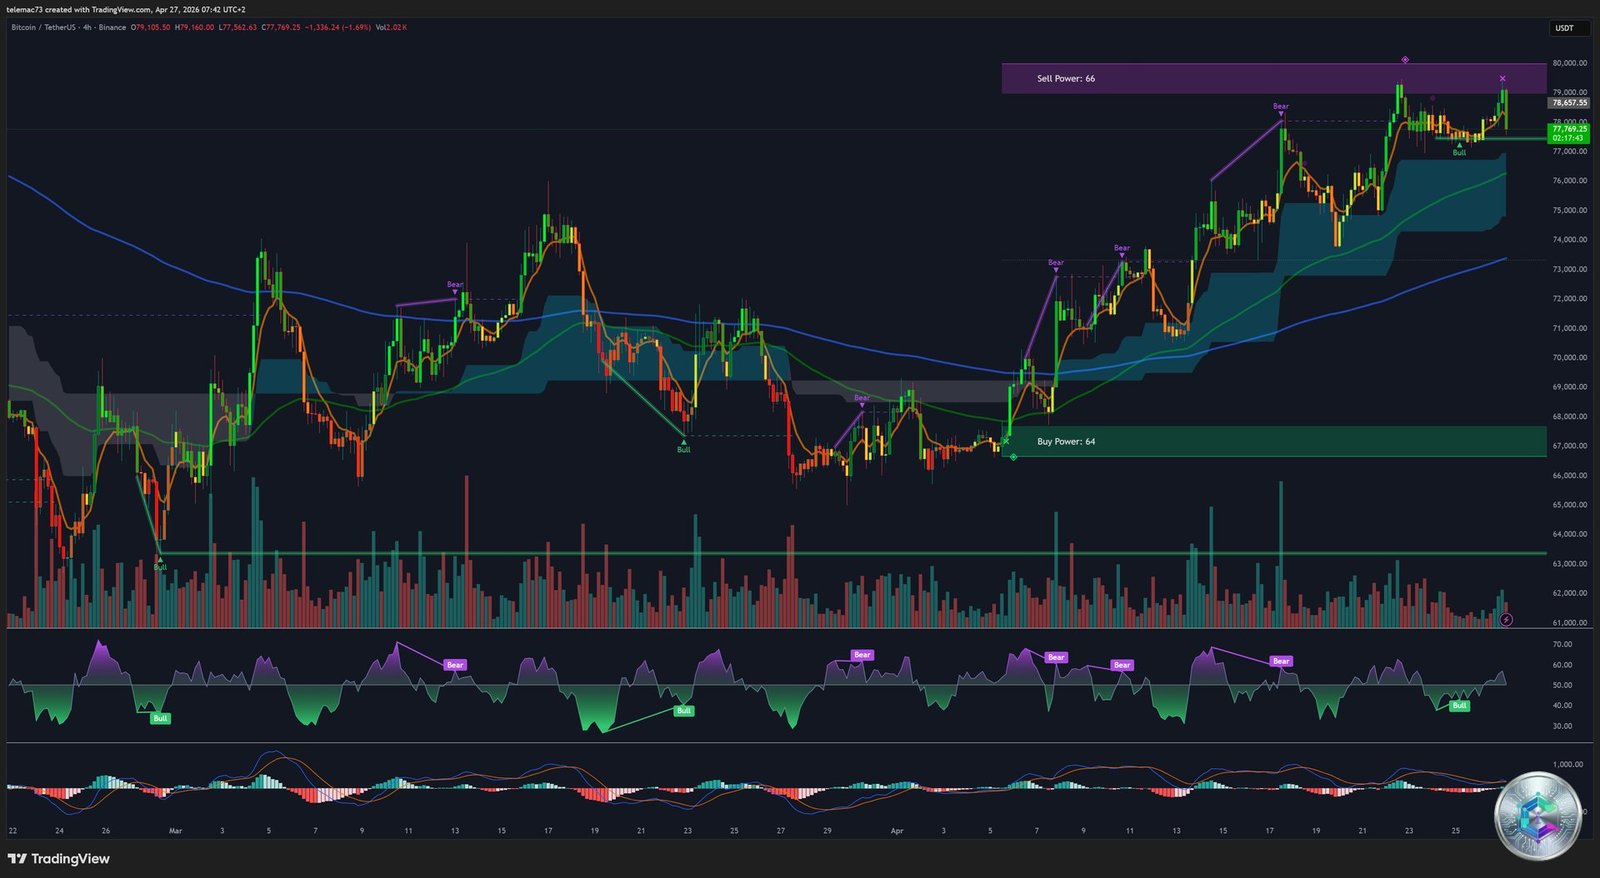
On the 4-hour timeframe, Bitcoin advances in a classic technical staircase. Following its breakout from the previous broad descending channel, price repeatedly forms bull flags: brief lateral or slightly declining consolidations that flush speculative excess, liquidate overleveraged traders, and recharge kinetic energy. Price trades above the upper boundary of the green support cloud (Ichimoku / Power Bands), keeping the intermediate trend firmly anchored to the upside.
The 4H oscillators add nuance: the RSI shows a series of higher lows validating price structure, but begins to diverge slightly sideways against prices struggling to print decisive new highs. The MACD 4H histogram enters a flattening phase — a signal of temporary deceleration in immediate buying momentum, requiring consolidation before the next assault on resistance. Key observation zone: any clean pullback to the $77,000–$77,500 dynamic support represents a favorable entry point.
15-Minute Chart: Microstructure & Short-Term Signal
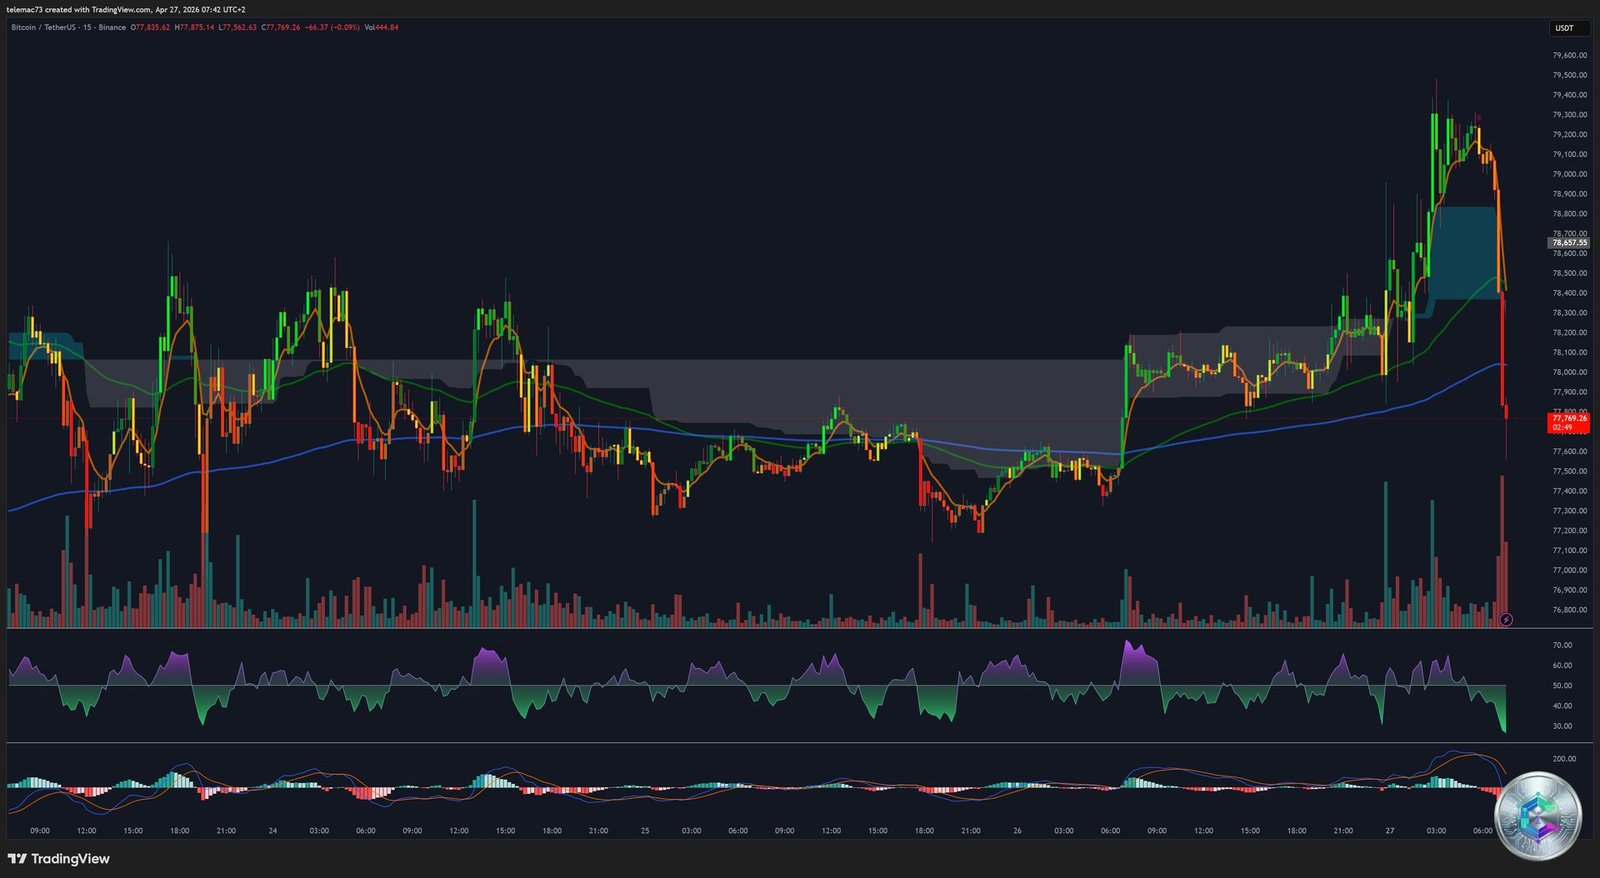
The 15-minute chart exposes the granular attrition war playing out inside larger candles. Bitcoin trades within a nervous ascending micro-channel, with a clear rejection candle visible at the far right — testament to sellers fiercely defending the $79,400 resistance. The EMA 50 (15m) at $77,700 is the first dynamic safety net; the EMA 200 (15m) at $76,900 is the intraday structural foundation. As long as the EMA 50 remains above the EMA 200, the statistical probability of a cascading breakdown remains low.
The 15m MACD has recently executed an intraday Death Cross — fast line crossing below the signal line, histogram turning firmly red. Simultaneously, the 15m RSI is diving toward relative oversold territory (below 50, heading toward 30). This technical combination signals a temporary flush of excessive leverage in progress. It implies an immediate vulnerability window testing the $76,900–$77,700 support range before regrouping the directional force for a new bullish push.
Key Technical Levels Reference Table
| Level | Price Zone (USD) | Nature |
|---|---|---|
| Cycle Top (ATH) | $124,000–$126,000 | Ultimate resistance — macro-structural reference |
| Intermediate resistance | $90,000–$95,000 | Previous cycle supply zone |
| Breakout extension target | $84,000–$87,000 | Ascending triangle measured move projection |
| Immediate ceiling (Ask Wall) | $79,400–$80,200 | Static resistance — dense sell-side liquidity wall |
| Fast dynamic support | $77,700 | EMA 50 (15m/1H) — first safety net |
| Base structural support | $76,900 | EMA 200 (1H) — break triggers stop cascade |
| Macro-bullish pivot | $75,000 | Former resistance flipped to breakout support |
| Intermediate swing low | $73,300–$73,500 | Last significant low before the $79K surge |
| 50-Day EMA foundation | $70,000–$72,000 | Medium-term algorithmic rebalancing zone |
| Macro floor (Double bottom) | $62,000–$65,000 | Historical 2026 capitulation — institutional accumulation base |
Directional Scenarios for the Next 30 Days
🟢 Bullish Scenario — Probability 55%
This scenario activates via a high-volume daily close above $80,200. The ideal catalyst: landmark statements at the Bitcoin 2026 Conference in Las Vegas (April 27–29) combined with a dovish tone from Powell at the FOMC press conference on April 29. In the immediate aftermath of the breakout, market velocity would target the liquidity magnet at $84,000, opening a volume void toward the $90,000–$95,000 corridor through May.
🔴 Bearish Scenario — Probability 30%
This defensive scenario takes shape if the asset demonstrates a repeated inability to absorb sell pressure at $79,400–$80,200, accompanied by geopolitical escalation pushing Brent sustainably above $115 and a hawkish Fed pivot. The downside cascade would sequentially target $76,900 (hourly EMA 200), then $73,300, threatening to invalidate the daily ascending triangle geometry.
🟡 Neutral Scenario — Probability 15%
A mutual neutralization of forces — ambiguous FOMC language, geopolitical stalemate, Bitcoin 2026 announcements already « priced in » — would confine BTC to the $75,000–$79,000 range for 2–4 weeks. This attrition scenario would crush implied volatility and may trigger sector rotation into altcoins (ETH, SOL), sparking the early stages of a localized « Altseason. »
Conclusions
The aggregate weight of analytical evidence — over $58 billion in cumulative ETF inflows, a positive Coinbase institutional spot premium, a daily MACD Golden Cross, a massive ascending triangle, and the latent fuel of accumulated short positions — converges overwhelmingly to support a bullish resolution narrative in the short to medium term. This trajectory remains strictly conditional on the validation of a convincing volume breakout above $80,000.
The gravitational zone of $75,000–$76,900 remains the critical waterline that must be defended to preserve the architectural integrity of this recovery rally. The exceptional convergence of antagonistic catalysts — Las Vegas euphoria colliding with FOMC anxiety — mandates absolute risk management discipline, with positions sized to absorb intraday whipsaws within the $77,000–$79,500 corridor.
⚠️ Disclaimer: This article is written for educational and informational purposes only. It does not constitute investment advice, nor a recommendation to buy or sell digital assets or any other financial instrument. Cryptocurrency markets are highly volatile and carry significant risk of capital loss. Always conduct your own research (DYOR) and consult a qualified financial advisor before making any investment decision.