
On May 10, 2026, Bitcoin (BTC) stands at a critical technical and fundamental crossroads. With a market capitalization of $1.62 trillion representing 58.31% of the total crypto market, Bitcoin has firmly cemented its role as the reference asset in digital finance — one toward which institutional capital continues to flow amid deep geopolitical and macroeconomic uncertainty.
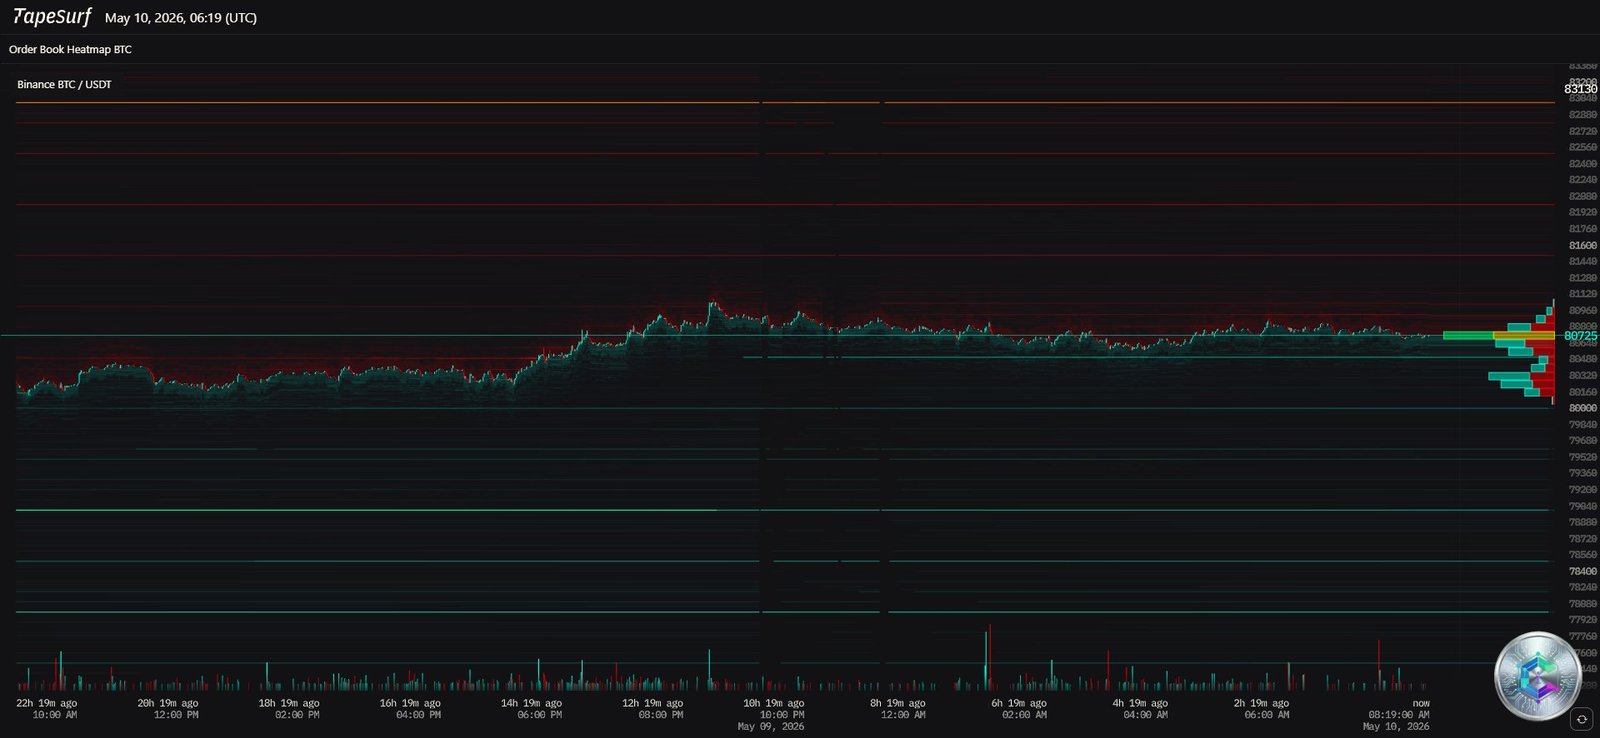
1. Market Microstructure: Order Book Heatmap Analysis
A deep examination of the order book reveals a dense stratification of liquidity around key psychological levels. On the upside, a substantial sell wall is positioned between $82,800 and $84,000, potentially corresponding to the fill of a previously identified CME gap. On the downside, visible Whale Walls in the $78,500 — $79,000 band suggest large holders are actively defending the Short-Term Holder (STH) cost basis support.
This price magnetism phenomenon is amplified by sustained spot Bitcoin ETF activity, which has absorbed nearly $2 billion since the start of May, creating a disciplined price floor that methodically absorbs available supply. The 24-hour trading volume remains robust at $17.45 billion while the daily price range stays remarkably tight at 0.92% — a classic compression that historically precedes a violent directional expansion.
| Microstructure Indicator | Current Value | Market Implication |
|---|---|---|
| BTC Market Cap | $1.62T USD | Macroeconomic dominance |
| 24h Volume | $17.45B USD | High institutional liquidity |
| BTC Dominance | 58.31% | Active flight to quality |
| Daily Price Range | 0.92% | Pre-breakout compression phase |
| Heatmap Support | $78,500 — $79,100 | Active STH defense zone |
2. Multi-Timeframe Technical Analysis
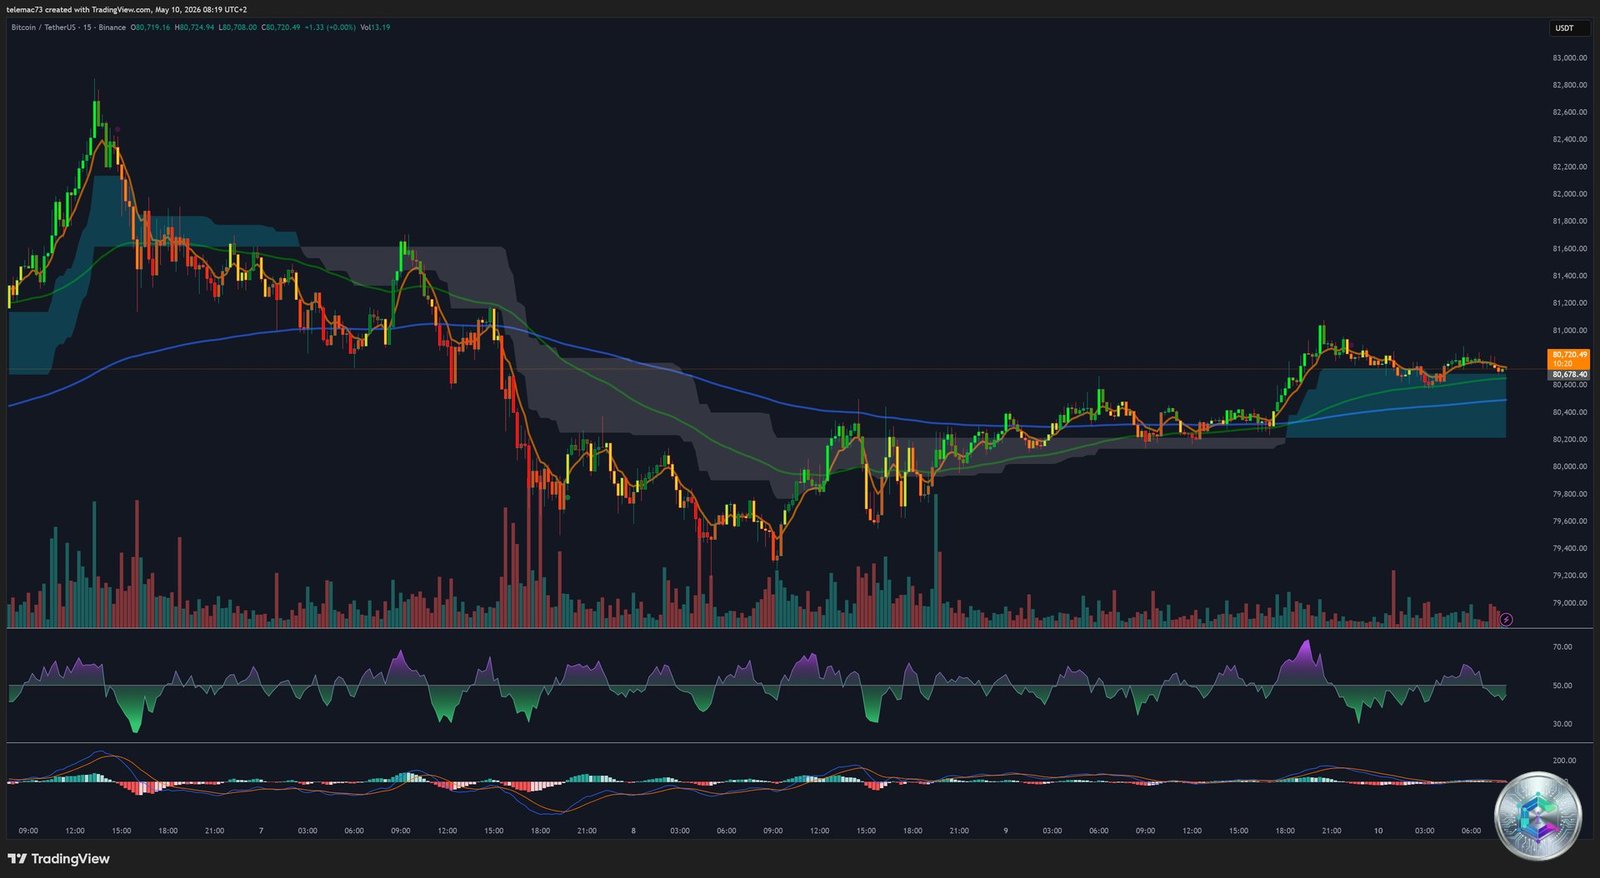
15-Minute Chart — Compression and Symmetrical Triangle
On the short timeframe, Bitcoin displays a tight consolidation phase with micro-oscillations testing the 7-period moving average (MA-7) at $79,766. The 15-minute RSI showed signs of local oversold conditions near $79,150 before bouncing, forming the first intraday technical line of defense. The current structure resembles a symmetrical compression triangle, where a breakout to the upside would open the path toward an immediate test of $81,000.
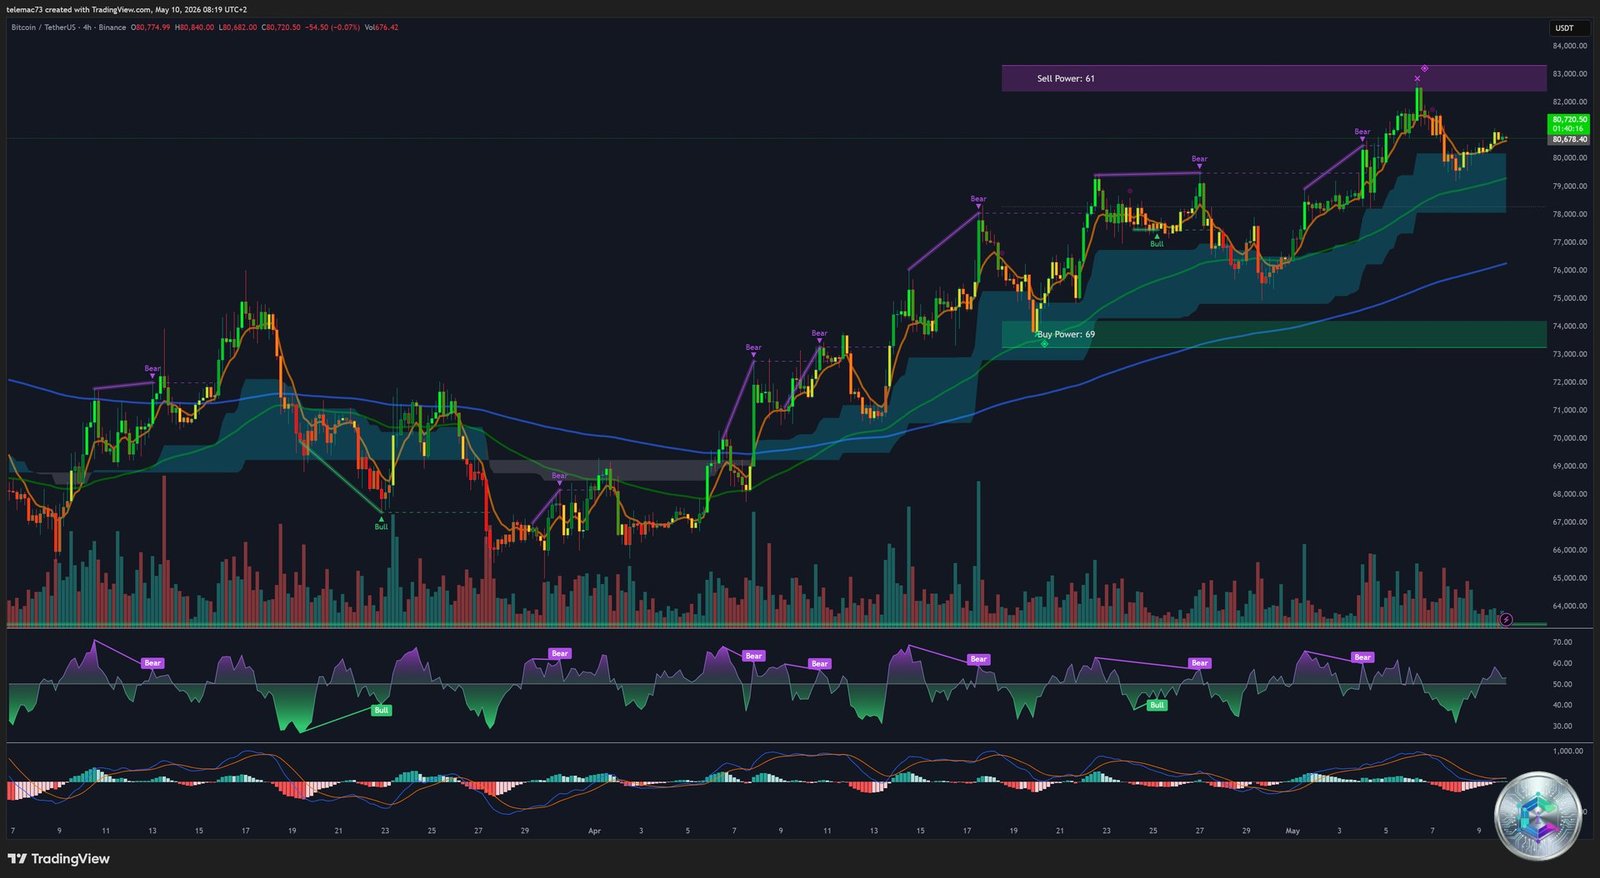
4-Hour Chart — Bull Stack and Bull Flag Formation
The 4-hour chart provides a structural reading of the ongoing recovery. Moving averages are stacked in a classic bull stack configuration, validating medium-term directional strength:
- MA-7: $79,766
- MA-14: $78,403
- MA-30: $76,343
Bitcoin has completed an impressive V-Recovery from April’s low at $60,000, confirming the strength of institutional buyers. The 4H MACD histogram bars are flattening — signaling a pause in the aggressive bullish momentum without any imminent bearish crossover (Death Cross). A Bull Flag pattern is forming between $79,500 and $81,500, and a confirmed breakout above its upper boundary would project a technical target toward $88,000.
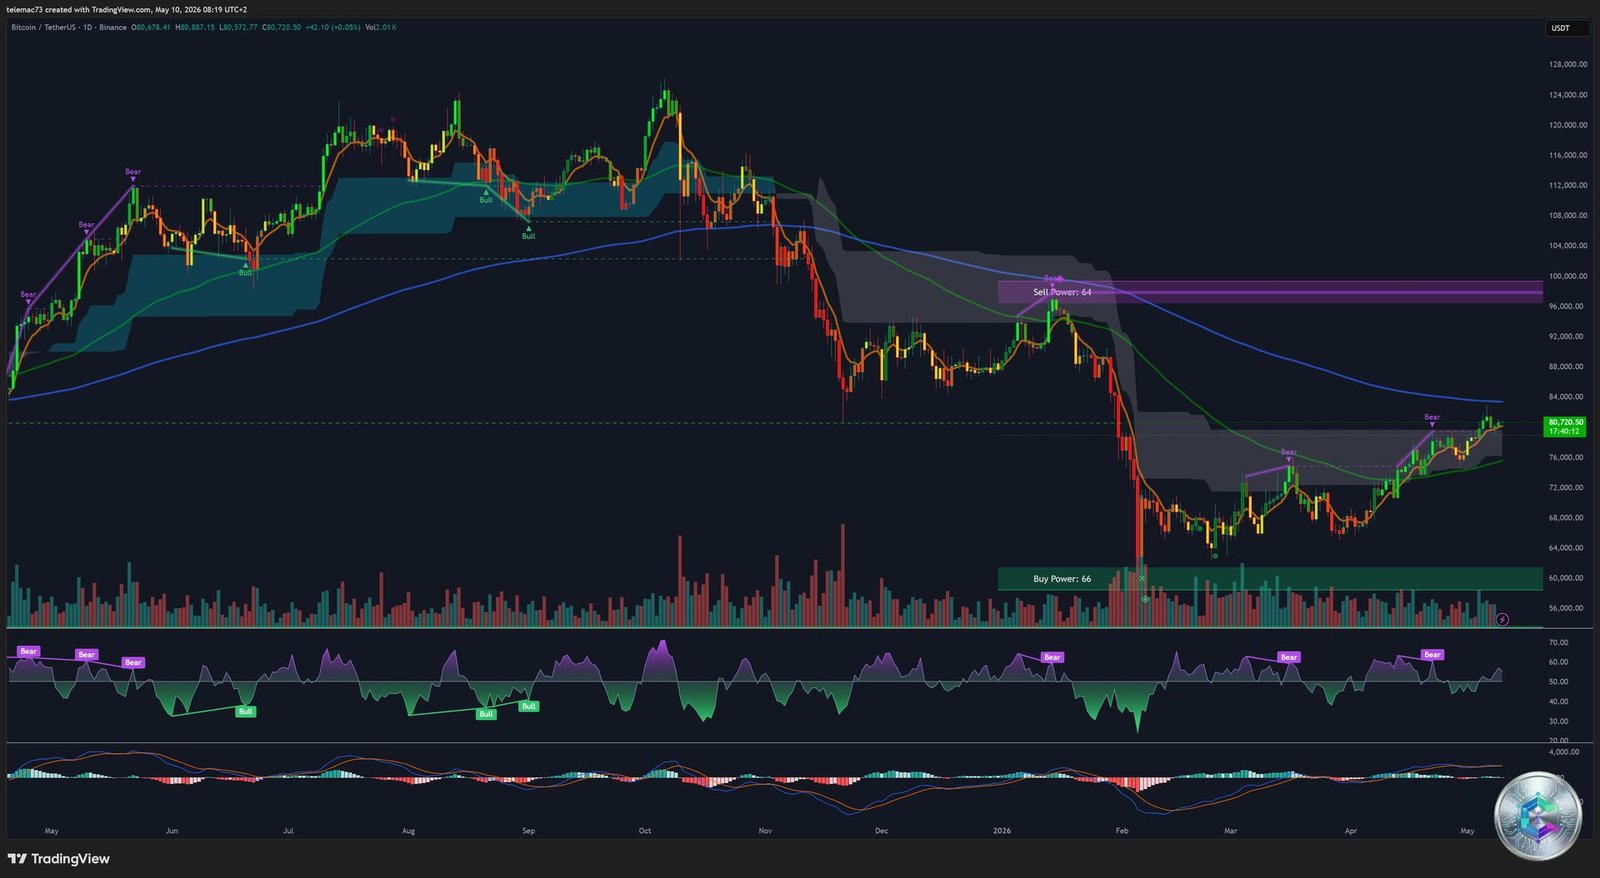
Daily Chart — The Decisive MA-200 Test
The daily chart is the most revealing in terms of the ongoing paradigm shift. After breaking above the MA-100 around $74,000 — converting that former stubborn resistance into a major structural support — Bitcoin now faces its most formidable barrier: the EMA-200 at approximately $83,200. This level has acted as an uncrossable ceiling since late 2025. A confirmed daily close above it would definitively invalidate the residual bearish bias from Q1 2026 and open the road toward $90,000.
On the weekly timeframe, a suspected Hanging Man candlestick pattern noted by some analysts hints at potential vertical movement exhaustion, warranting increased vigilance if the $75,000 support level were to be tested.
3. Quantitative Indicators and Momentum Oscillators
| Technical Indicator | Value / Status | Sentiment |
|---|---|---|
| RSI (14d) | 55.89 — 66.63 | Neutral-Bullish |
| MACD (12, 26) | 155.8 — 198 | Confirmed Buy Signal |
| MFI (14d) | 54.22 | Stable capital inflows |
| Funding Rates | Negative (67 consecutive days) | Massive short squeeze risk |
| Fear & Greed Index | 47 — 50 | Cautious neutrality |
| Golden Cross (50/100d MA) | Confirmed | Medium-term bullish bias |
The most explosive signal remains the persistence of negative funding rates for 67 consecutive days. In a market that is stable or trending higher, this configuration creates ideal conditions for a massive short squeeze: should Bitcoin break the $83,000 resistance, the forced liquidation of accumulated short positions could rocket the price toward $90,000 almost instantly.
4. Macroeconomic and Geopolitical Context
Digital Gold Amid Geopolitical Tensions
The simmering US-Iran conflict, marked by skirmishes in the Strait of Hormuz, has had a paradoxical effect: reinvigorating Bitcoin’s narrative as Digital Gold. With crude oil fluctuating between $107 and $115 per barrel and fanning inflationary fears, investors are increasingly turning to Bitcoin’s fixed-supply architecture as a shield against monetary debasement. The announcement of an Iranian peace framework nevertheless calmed markets and acted as the direct catalyst for Bitcoin’s break above $80,000 in early May.
The Federal Reserve and Bitcoin’s New Value Regime
Constrained by sticky inflation and resilient employment data, the Fed appears unlikely to cut rates in the near term. Bitcoin’s rise in this liquidity-restricted environment is all the more remarkable — it confirms the asset has undergone a profound mutation. Its value is no longer dictated by excess global liquidity, but by structural institutional adoption. The BTC/Nasdaq correlation has reached a five-year high, reflecting full integration into institutional technology portfolios.
5. Regulatory Architecture: The CLARITY Act
2026 marks a major legislative turning point in the United States with the CLARITY Act, which aims to provide clear legal definitions for digital assets — definitively separating commodities (including Bitcoin) from securities. The Senate Banking Committee is examining critical amendments concerning stablecoin yields between May 11 and 15 — a clarity that is vital for the entire ecosystem’s maturation.
Morgan Stanley’s entry into the ETF market with its MSBT product — which has recorded zero net outflow days since its April 8, 2026 launch — demonstrates growing traditional banking sector confidence. These long-term strategic flows are progressively replacing retail-driven volatility and helping stabilize the price floor above $70,000.
6. Halving Cycles: Death or Mutation of the Four-Year Model?
Bitcoin’s classic four-year cycle model appears to have lost much of its immediate predictive relevance. Whereas historically the year following a halving (2013, 2017, 2021) was marked by parabolic euphoria, 2025 broke that script by finishing the year down 6%. This anomaly confirms that the supply shock from the April 2024 halving (reward reduced to 3.125 BTC) is now marginal compared to daily ETF flows, which absorb far more than the 450 BTC mined per day.
The market is no longer watching the mining clock — it is watching the Fed. On the production side, US miners now control over 70% of global hashrate and have recently accumulated 4,400 BTC — a strong bullish signal indicating they view current price levels as an accumulation zone rather than a selling opportunity. The next halving in April 2028 will reduce rewards to 1.5625 BTC, further consolidating the digital scarcity thesis.
7. Emerging Risks: Quantum Computing and the Q-Day
A report from « Project Eleven » raised concerns in May 2026 about the Q-Day, estimated between 2030 and 2033: the point at which sufficiently powerful quantum computers could break Bitcoin’s ECDSA signature algorithm. While the threat remains distant, it is already influencing discussions within Bitcoin Core regarding a migration to post-quantum signatures — a colossal undertaking that would require flawless consensus from the global development community.
8. Key Strategic Levels and Trading Scenarios
Resistance Zones and Bullish Targets
- $82,800 — $83,200: Current rejection zone (EMA-200 + top of parallel channel). Breakout → test of $85,000.
- $85,200: Structural resistance (non-dormant supply cost basis). Break → push toward $90,000.
- $92,000 — $93,000: Medium-term target (full CME gap fill + Fibonacci extensions).
Support Levels and Stop-Loss Zones
- $79,000 — $80,000: Immediate psychological and technical support (MA-7). Confirmed break → short-term bullish bias cancelled.
- $75,000 — $76,000: Robust demand zone (MA-30) — ideal re-entry level on a healthy correction.
- $70,000 — $72,000: Structural safety floor. Break below → recovery failure signal and likely return toward the April lows at $60,000.
| Pivot / Fibonacci Level | Price (USD) | Technical Role |
|---|---|---|
| Resistance R2 | $89,000 | Bullish impulse extension |
| Resistance R1 | $84,000 | Short Squeeze target |
| Central Pivot Point | $80,680 | Current market equilibrium |
| Support S1 | $75,000 | Moving average bulwark |
| Support S2 | $71,000 | Trend invalidation threshold |
Synthesis and Outlook for H2 2026
Bitcoin on May 10, 2026 finds itself at a crossroads. Growing institutional maturity, consistent ETF inflows, and an increasingly clear US regulatory framework provide an unprecedented foundation of stability in the asset’s history. The persistence of negative funding rates for over two months represents considerable latent fuel for an accelerated move higher.
A confirmed technical close above the EMA-200 at $83,200 remains the defining signal to validate entry into a new structural bull market. Prudent investors will favor accumulation on pullbacks toward the $75,000 support zone, keeping a close watch on CLARITY Act legislative developments as a potential fundamental catalyst for the entire ecosystem.
⚠️ Legal Disclaimer: This article is written for exclusively educational and informational purposes. It does not constitute investment advice, nor a recommendation to buy or sell any digital asset or financial instrument. Cryptocurrency markets are highly volatile and carry significant risk of capital loss. Past performance is not indicative of future results. Please consult a qualified financial advisor before making any investment decisions.