
As of March 10, 2026, Bitcoin stands at a strategic crossroads rarely seen in its history. Oscillating between a floor at $60,000 and a breakout attempt toward $71,840, the benchmark digital asset crystallizes every contradiction of a market torn between technical breakdown and institutional strength. This analysis dissects the forces at play — macro, on-chain, technical, and behavioral — to model probable trajectories ahead of March’s decisive economic publications.
A Macroeconomic Environment Under Extreme Pressure
The 30-day rolling correlation between Bitcoin and the S&P 500 now sits at 0.55, a significant increase from 0.50 in October 2025. Bitcoin no longer behaves as a purely decorrelated hedge asset: it reacts with amplified sensitivity to liquidity shocks, interest rate revisions, and global geopolitical crises.
The Oil Shock and Middle East Geopolitics
The first weeks of March were marked by extreme volatility across all asset classes. Coordinated military strikes by the U.S. and Israel pushed crude oil above the $100/barrel psychological threshold, reviving stagflation fears. Bitcoin, caught in the turmoil, had plunged toward $63,000 over the weekend under the weight of panic and thin liquidity.
However, President Donald Trump’s declaration that the conflict was « practically over » triggered a relief rally. Asian and American stock markets responded positively, and Bitcoin recovered above the $70,000 mark. Iran’s political transition adds a layer of residual uncertainty, but markets have temporarily chosen to price in the de-escalation.
March 2026’s Decisive Economic Calendar
| Event | Date | BTC Implication |
|---|---|---|
| NFP Jobs Report | March 6 (past) | Significant miss vs expectations — signals economic vulnerability |
| U.S. CPI | March 11 | Critical data: persistent inflation penalizes risk assets like BTC |
| FOMC Rate Decision | March 17-18 | Month’s most impactful event — Powell’s rhetoric will dictate the trend |
| PCE Inflation Index | March 26 | Will confirm or contradict the trajectory set by CPI and FOMC |
The true stakes at the March 18 FOMC lie not in the rate decision itself (a hold is widely priced in) but in Jerome Powell’s forward guidance. A hawkish tone amid persistent inflation would put severe downward pressure on Bitcoin. Conversely, a dovish posture in the face of labor market weakness could catalyze a major bullish breakout.
Institutional Dynamics: ETF Flows and Supply Shock
The Spectacular ETF Flow Reversal
After five consecutive weeks of net outflows totaling nearly $4 billion — the primary catalyst for the collapse from peak prices toward $60,000 — Bitcoin Spot ETFs recorded a brutal reversal in early March: $1 billion in net inflows in a single week, with $957 million captured in the U.S. alone.
BlackRock’s dominance is overwhelming. On March 4 alone, iShares Bitcoin Trust (IBIT) absorbed $306.60 million out of a daily total of $461.77 million — representing 66.2% of all flows. Since February 24, BlackRock has accumulated over 21,814 BTC, creating asymmetric buying pressure that propelled Bitcoin’s violent rebound from $60,000.
| Entity | Flows (March 4) | Market Impact |
|---|---|---|
| BlackRock (IBIT) | +$306.60M | Primary absorber, maintaining the institutional floor |
| Fidelity (FBTC) | +$48M | Confirms traditional finance appetite |
| Grayscale (GBTC) | +$54.10M | Slowdown in historic outflows, less structural pressure |
| Ethereum Products | +$117M (weekly) | Best weekly performance since January |
On-Chain Supply Shock: A Historic Low
The impact of institutional buying is amplified by a structural phenomenon: total Bitcoin reserves on centralized exchanges have dropped to just 2.7 million BTC — the lowest level ever recorded. Holders are aggressively withdrawing their assets to self-custody wallets, making the market extremely inelastic. Every demand injection — such as BlackRock and Fidelity’s hundreds of millions daily — causes a disproportionate price appreciation.
Multi-Timeframe Technical Analysis
Daily Chart: The Monumental Bear Flag
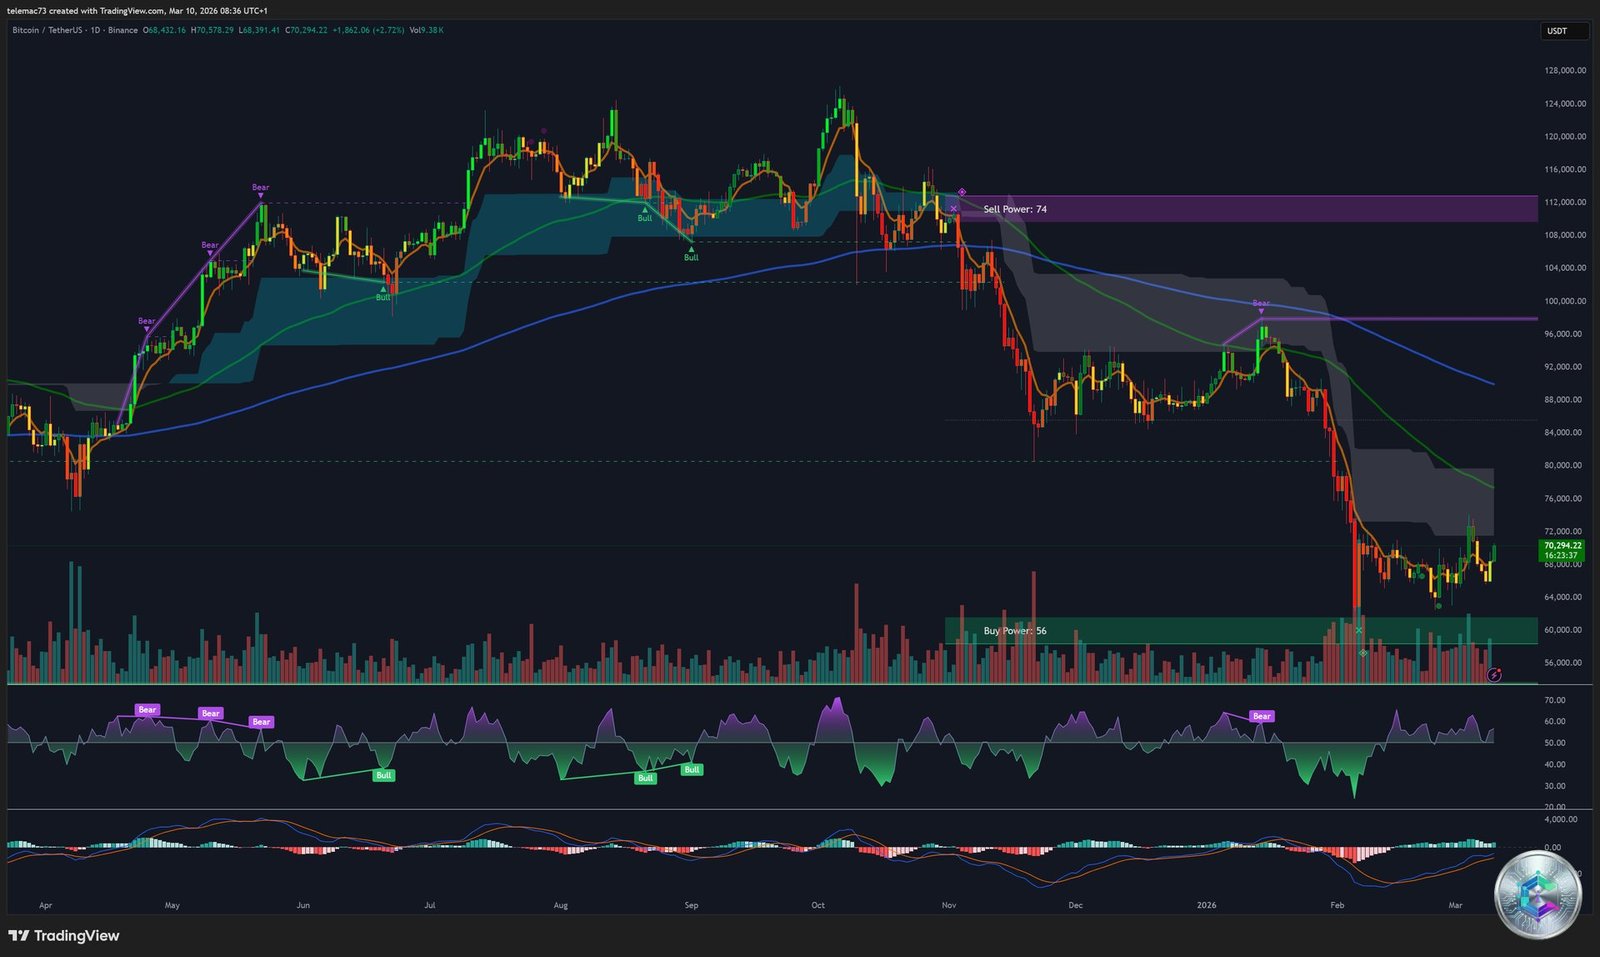
On the daily chart, price action is dominated by a monumental technical pattern: a Bear Flag formed after the correction from the October 2025 ATH at $126,000. The consolidation channel ranges between a $60,000 support and an upper sloping boundary toward $74,000. Per the measured move rule, a break of the flag’s lower bound would project a dramatic target between $42,000 and $45,000.
A Death Cross is forming: the 50-day SMA (~$74,139) is poised to cross below the 200-day SMA (~$95,419) — the classic academic signal of a prolonged bear market. However, the daily RSI at 46.14 introduces a crucial nuance: selling pressure has evaporated, the market stagnates due to absence of aggressive demand rather than supply force. The flat MACD near zero confirms this state of kinetic stasis.
Two key zones define the technical framework:
- Critical Resistance: $73,750 – $74,400 — Capped the post-ETF rally (March 2024), April 2025 rebound, and 2026 recovery attempt. A confirmed daily close above this level would invalidate the bearish scenario.
- Institutional Support: $60,000 – $62,300 — Heroically defended on February 24. Concentrates $1.5 billion in institutional put open interest.
4-Hour Chart: Compression Inside the Triangle
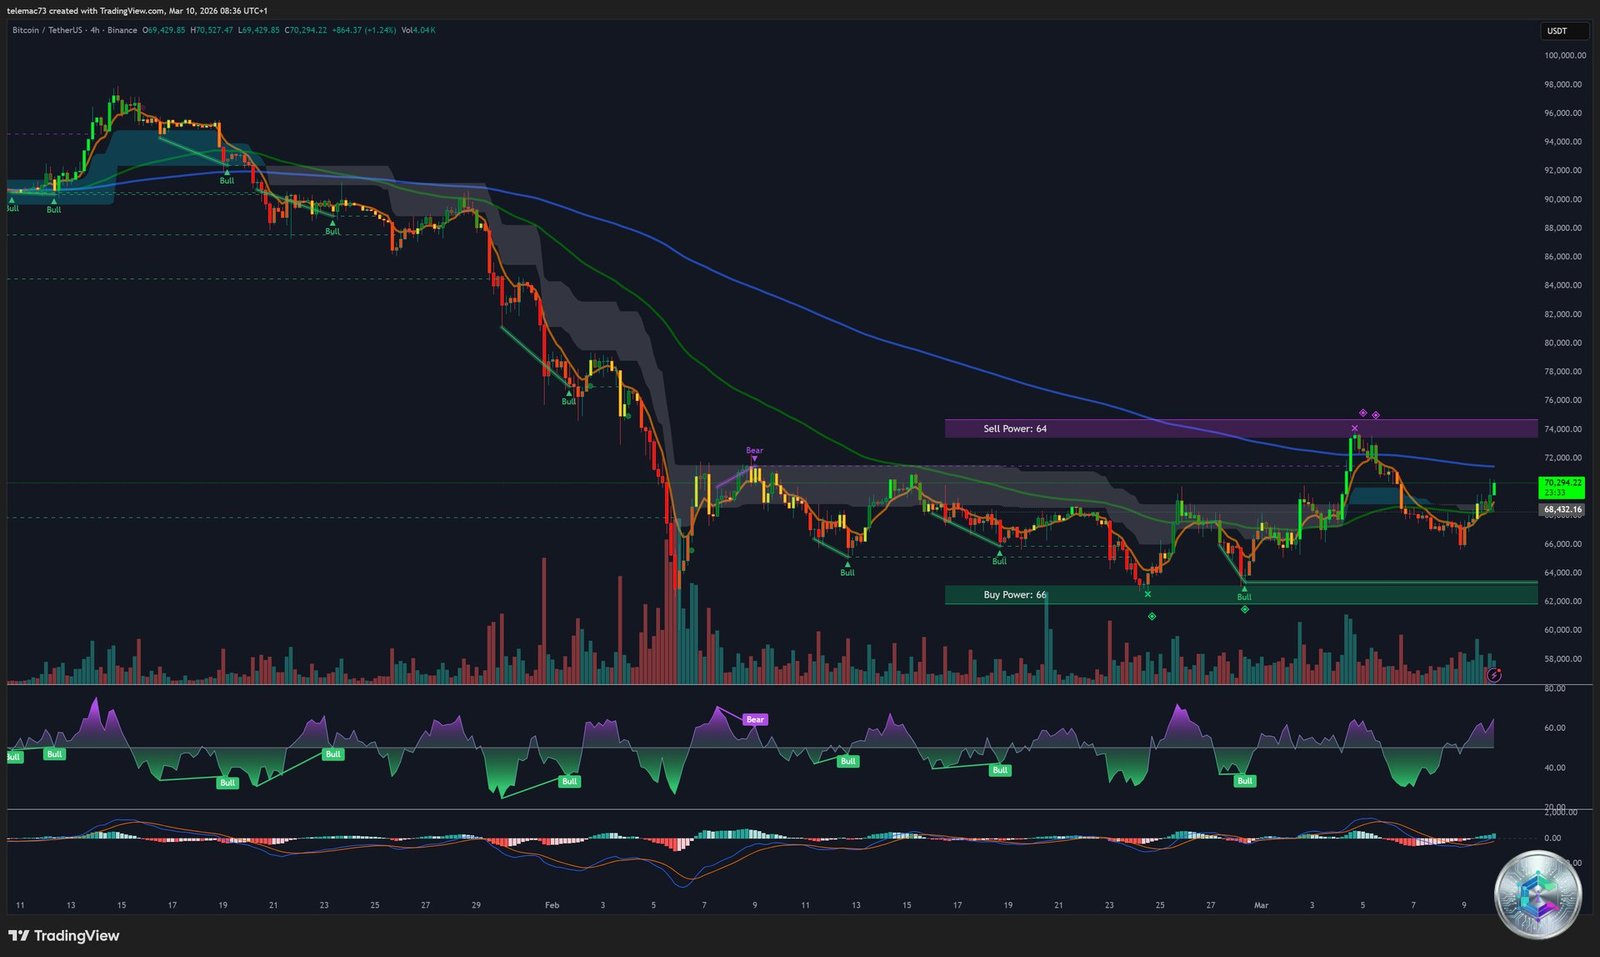
On the 4H chart, Bitcoin is locked inside a compression triangle, reflecting the fierce battle between incoming ETF flows and algorithmic sellers. Every bounce above $71,350 has been stopped cold by the 50-period EMA acting as a dynamic glass ceiling. The MACD illustrates a classic « choppy market »: lines erratically cross each other without generating directional expansion. The Fibonacci 1.618 extension level (~$62,084) is gradually transforming from former resistance into structural support — a sign of underlying strength that contradicts ambient pessimism.
This triangle is accumulating explosive potential energy. The direction of the breakout will be dictated by the CPI data and the FOMC statement.
15-Minute Chart: The Reality of Microstructure
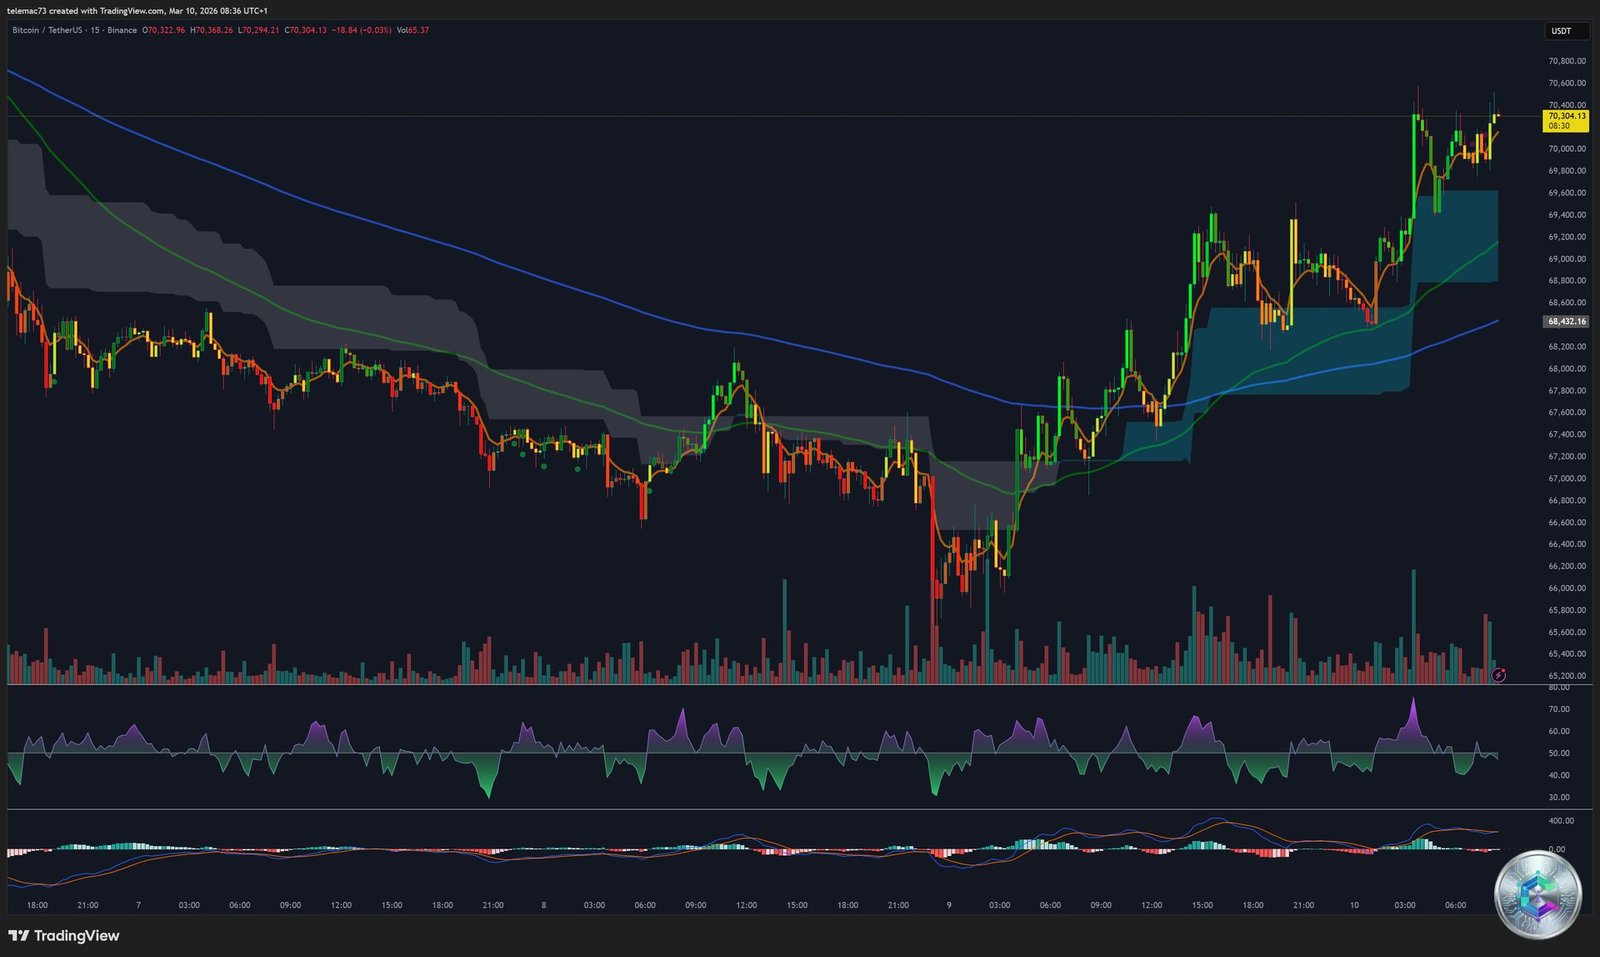
The spike toward $74,000 visible on the 15M chart was not the result of organic demand, but rather the mechanical outcome of a Short Squeeze. During consolidation between $63,000 and $70,000, funding rates were deeply negative — speculators were massively shorting. When institutional buying pushed price above $70,000 and then $73,000, short positions were liquidated in cascade, propelling the price straight into the $74,400 resistance wall.
The intraday V-bottoms reveal institutional algorithms splitting their colossal orders into thousands of micro-transactions, methodically buying the dip without triggering a premature breakout.
Liquidation Mapping: The Heatmap
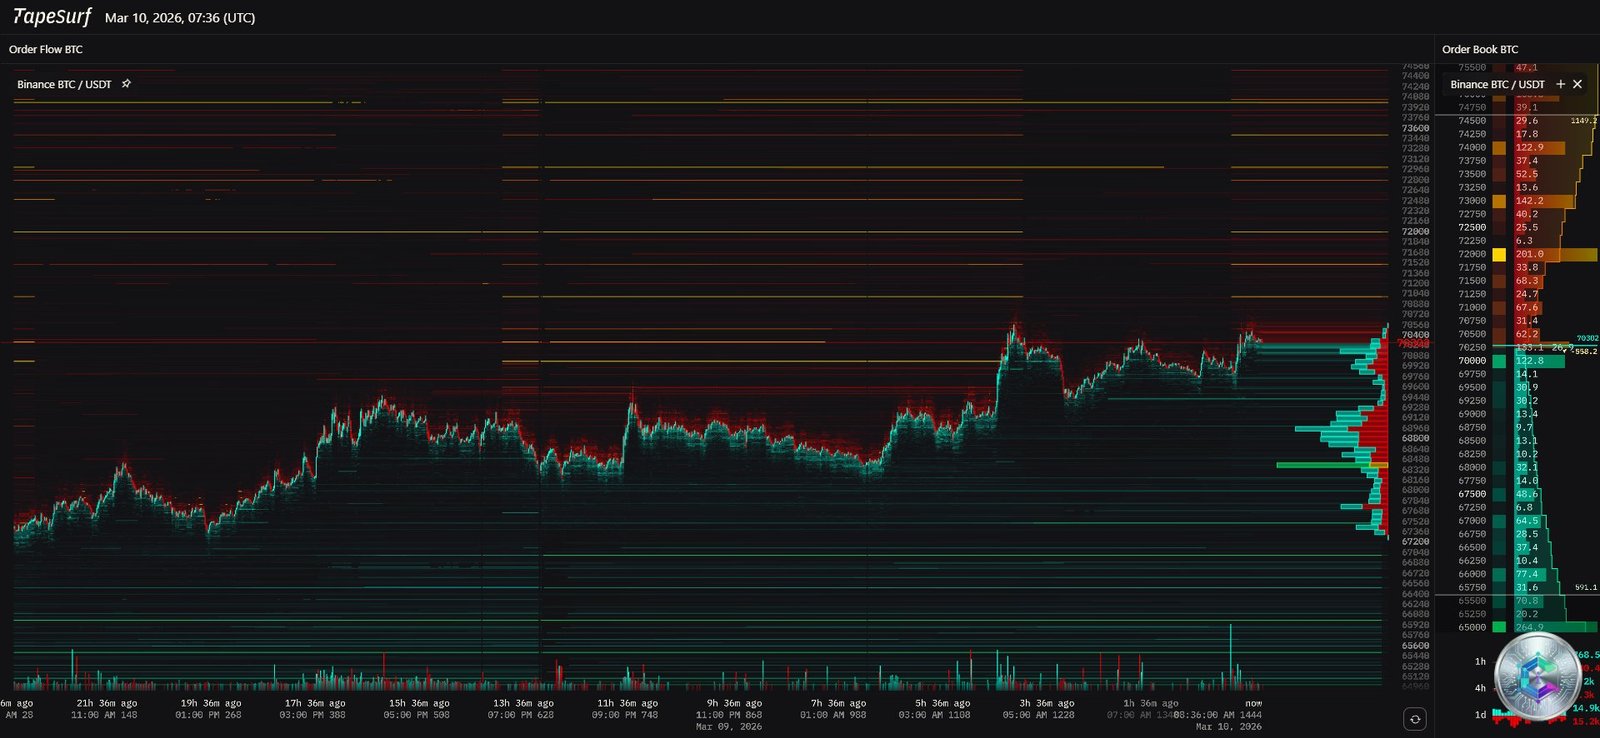
The liquidation heatmap identifies an incandescent zone at $54,000 — a massive concentration of highly-leveraged long positions representing over $70 million in imminent liquidation risk. HFT algorithms and market makers inexorably hunt these liquidity pockets.
| Price Level (USD) | Type | Potential Consequence |
|---|---|---|
| $73,750 – $74,400 | Heavy Resistance / Shorts | Massive Short Squeeze, bear market invalidation |
| $60,000 – $62,300 | Institutional Floor / Puts ($1.5B OI) | Defended support zone, accumulation area |
| $54,000 | Long Concentration ($70M) | Potential Flash Crash, cascading Long Squeeze |
| $50,000 | End-of-cycle target | -60% from ATH — institutional analysts’ target |
| $40,000 | Institutional Insurance ($490M puts) | Tail risk protection for extreme events |
Market Psychology: The Extreme Fear Paradox
One of the most fascinating phenomena is the dissonance between the price — still at 45% of its all-time high — and market sentiment. The Crypto Fear & Greed Index registers between 10 and 18 out of 100, « Extreme Fear » levels comparable to the 2022 bear market floor when Bitcoin traded below $20,000.
The behavioral explanation: retail investors who entered during the $100,000 euphoria are sitting on unrealized losses exceeding 40%, paralyzed by loss aversion. Meanwhile, according to James Butterfill (CoinShares), discussions with institutional clients have shifted from a desire to reduce exposure to an active search for optimal entry points. This transfer from « weak hands » driven by emotion to « strong hands » guided by quantitative models is a classic hallmark of the foundation phase preceding a cycle reversal.
The Crypto Ecosystem: ETH, SOL, and the 20 Millionth Bitcoin
Ethereum is fighting to defend the psychological $2,000 threshold, with a weekly RSI of 33, brushing absolute oversold levels. Historically, such readings have preceded violent rebounds. The planned « Hegota » architecture upgrades expected for late 2026, combined with an unexpected $117M inflow into ETH products, could catalyze an institutional rotation toward Ether. Solana, meanwhile, has accumulated $156M in net inflows year-to-date, confirming its status as the preferred institutional altcoin allocation in 2026.
Between March 11–15, Bitcoin will reach a historic milestone: the mining of the 20 millionth BTC. Over 95.24% of the maximum 21 million supply will then be in circulation, with just one million coins left to be mined over the next century. While technically predictable, this event will powerfully revive the absolute scarcity narrative — though with a classic risk of a « buy the rumor, sell the news » dynamic.
Two Binary Forward Scenarios
🟢 Bullish Scenario: The Stratospheric Breakout
A March 11 CPI signaling marked disinflation, followed by a dovish FOMC on March 18, would provide the macroeconomic fuel for a decisive breakout. Bitcoin would push above the $74,400 resistance, triggering a historic Short Squeeze on months-accumulated short positions. Immediate target: $79,400, then reconquest of the 200-day EMA (~$88,000), officially marking the beginning of the Bull Run’s euphoric phase. FOMO would massively repatriate retail liquidity, amplified by the supply shock (only 2.7M BTC available).
🔴 Bearish Scenario: The Capitulative Purge
Stubborn inflation (CPI above expectations) combined with oil above $100 would force the Fed into a hawkish stance on March 18. ETF flows would dry up, Bitcoin would fail to break $71,350, and a forceful breach of $60,000 would open Pandora’s box. The daily Death Cross would be fully confirmed. Price would be pulled toward the $54,000 liquidity pocket (flash crash, $70M longs liquidated), then toward $50,000 — the -60% ATH drawdown targeted by institutional bank analysts. The ultimate geometric resolution of the bear flag points to $42,000–$45,000.
Conclusion: Tactical Patience as the Only Viable Strategy
Bitcoin’s macro-technical configuration in mid-March 2026 represents a financial powder keg where titanic forces clash. The confrontation between the inevitable supply scarcity — symbolized by the imminent 20 millionth Bitcoin — and the potential intransigence of U.S. monetary policy will determine the outcome of a cycle that will permanently reshape the architecture of digital finance.
In such a binary environment, the professional investor cannot afford cognitive biases. Waiting for a confirmed break either above $74,400 or below $60,000 stands as the only viable strategy for navigating this information asymmetry.
⚠️ Disclaimer: This article is written for exclusively educational and informational purposes. It does not constitute investment advice, a recommendation to buy or sell digital assets, or a financial solicitation of any kind. Cryptocurrency markets are extremely volatile and carry significant risk of capital loss. Please consult a licensed financial advisor before making any investment decision.