
In early 2026, Bitcoin is navigating a critical consolidation phase after reaching an all-time high of $126,272 in October 2025. Currently positioned around $90,745, the flagship digital asset finds itself at a strategic inflection point that could determine its trajectory for the coming months.
Macroeconomic Context: Between Geopolitical Tensions and Monetary Policy
The Bitcoin market operates within a complex macroeconomic environment, marked by several determining factors. Recent developments in Venezuela have created an interesting « paradox »: while geopolitical instability typically triggers a flight to safety, traders have interpreted these events through the lens of economic optimism. Regional stabilization could reduce global energy costs, thereby improving Bitcoin miners’ profit margins and reducing structural selling pressure.
On the U.S. monetary policy front, December’s Non-Farm Payrolls (NFP) data revealed the creation of 50,000 jobs, below expectations. Market probabilities suggest a 95% chance that the Fed will maintain a neutral position in Q1 2026, thus maintaining the high opportunity cost of holding non-yielding assets like Bitcoin.
Institutional Flows: A Mixed but Revealing Signal
The first full week of January was marked by massive Bitcoin and Ethereum ETF outflows, totaling approximately $750 million. BlackRock (IBIT), the market leader, recorded an outflow of $252 million on January 9, signaling significant institutional profit-taking.
However, the fact that the market absorbed nearly one billion dollars in institutional sales without breaking the $88,000 support demonstrates remarkable market depth and solid underlying demand in the spot market.
Market Sentiment: Psychological Capitulation
A particularly revealing indicator is the collapse of retail investor expectations. On the Robinhood platform, the probability of Bitcoin exceeding $150,000 by June 2026 dropped from 63% in October 2025 to just 14% in early January 2026. This drastic drop in optimism, while the price has only corrected 27% from its peak, indicates typical psychological capitulation that often precedes sustainable bullish recoveries.
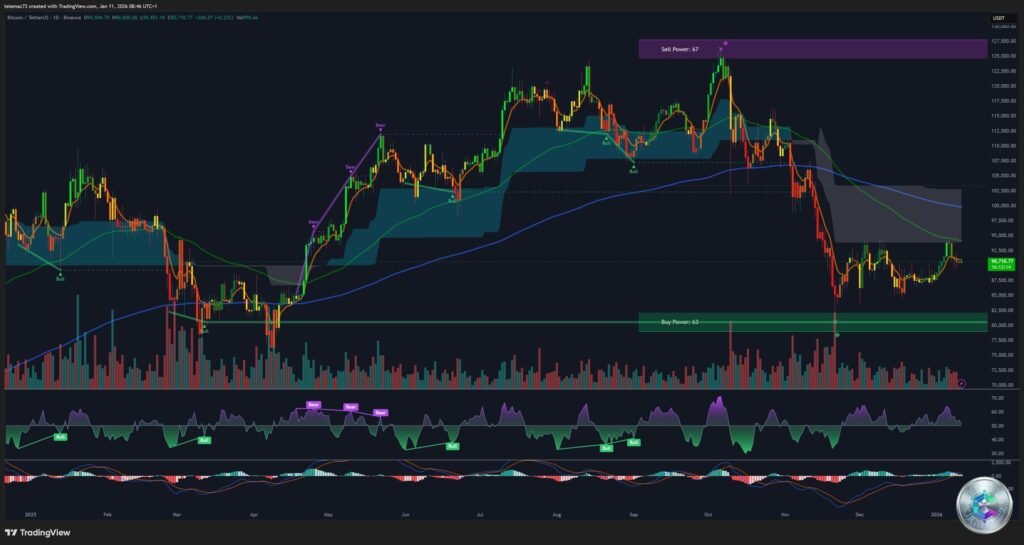
Daily Technical Analysis: Structure and Key Levels
On the daily timeframe, Bitcoin is in a lateral correction phase within a secular uptrend. Since the October 2025 peak, the price has formed a series of lower highs, signaling weakening buying momentum.
Critical levels identified:
- Major Resistance: $100,000 – $109,000 – Breaking this psychological threshold would invalidate any bearish thesis and confirm the resumption of the uptrend.
- Intermediate Resistance: $94,500 – $96,000 – Potential « Bull Trap » zone from early January, representing strong institutional supply.
- Central Pivot: $90,000 – $91,000 – Current equilibrium zone, corresponding to the monthly VWAP and recent volume point of control.
- Structural Support: $88,000 – $89,250 – Base of the consolidation range, defended by spot buyers. A break would trigger massive liquidations.
- Critical Support: $84,000 – $85,000 – Last bastion before a technical void, representing a « value » buying zone for institutions.
The daily RSI evolves in the neutral zone (40-50), indicating that the market has the technical capacity to move in either direction without immediate exhaustion constraints.
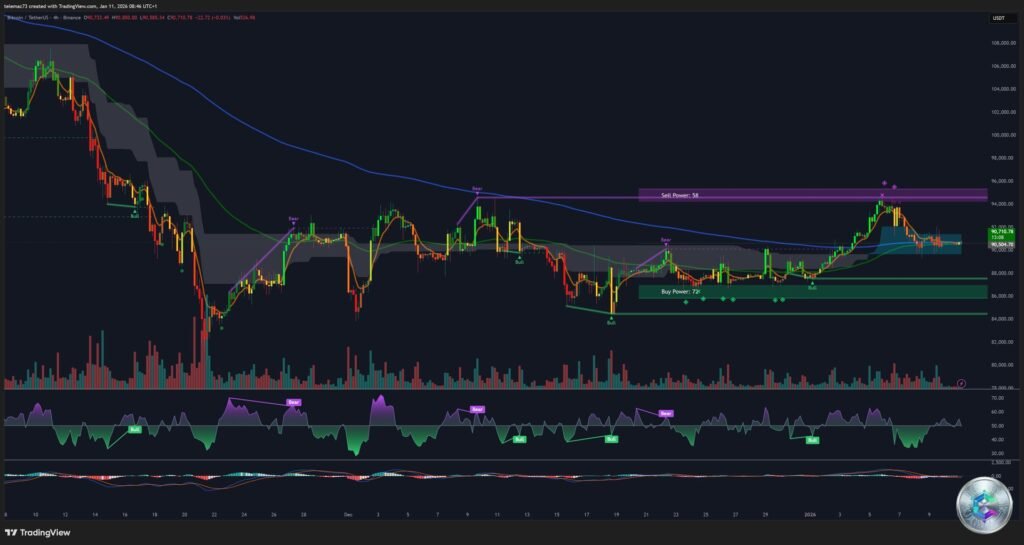
4-Hour Analysis: Bullish Divergence in Formation
The most critical observation on the 4-hour chart is the formation of a potential bullish divergence. While Bitcoin’s price has made marginally lower or equal lows (around $89,250 – $89,500), the RSI oscillator shows higher lows. This configuration indicates that selling pressure is exhausting and often serves as an early signal of a technical bounce.
Bollinger Bands show significant compression, mathematically preceding volatility expansion. The price currently evolves in the lower part of the bands, suggesting relative short-term undervaluation with a first technical target of mean reversion toward $92,000.
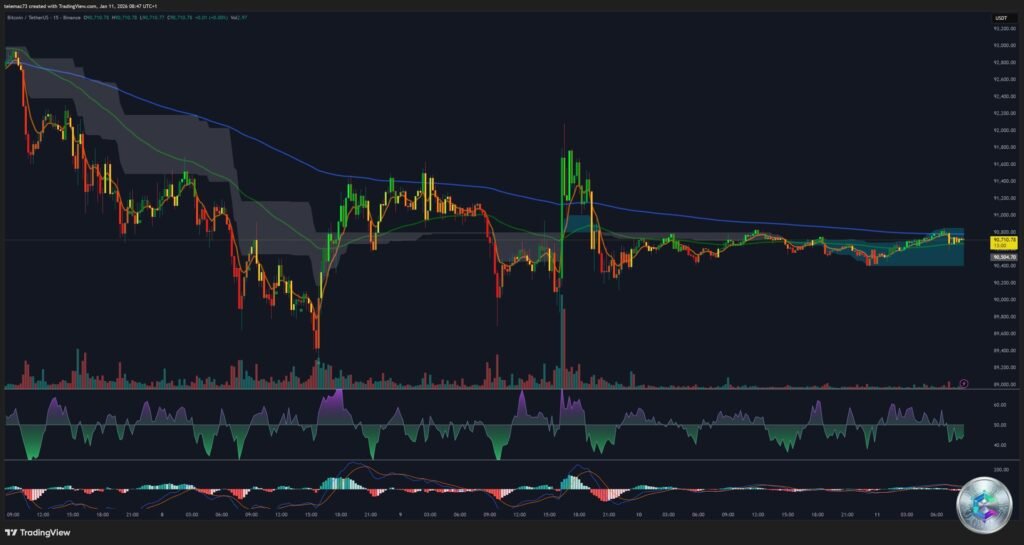
Intraday Microstructure: A Market in Waiting Mode
On the 15-minute timeframe, the market is characterized by very tight range behavior. We observe numerous candles with wicks on both sides (Dojis, Spinning Tops), indicating constant indecision. High-frequency trading algorithms create resistance zones around $90,800 – $91,200 and support zones around $89,800 – $90,000.
Volumes are decreasing, typical of a waiting phase before economic news or a technical breakout. A sudden volume increase will be the early warning signal of an exit from this micro-range.
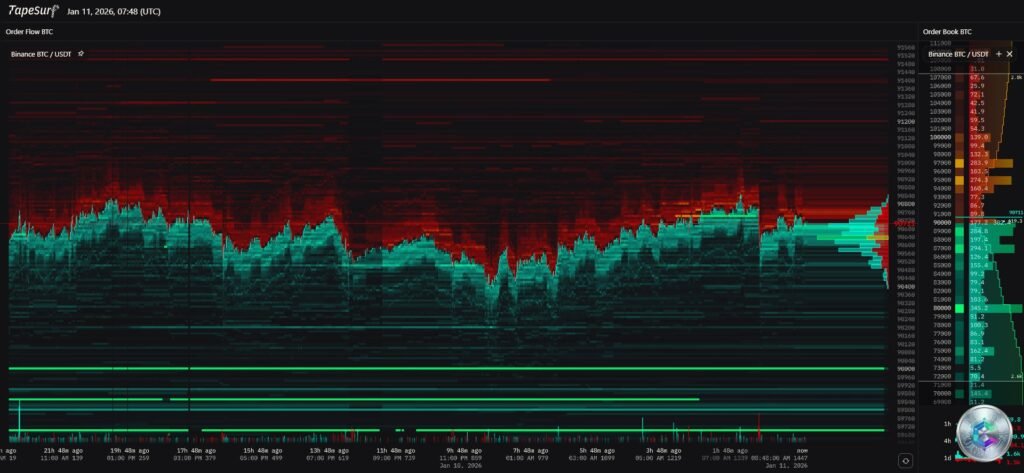
Heatmap Analysis: Critical Liquidity Zones
Analysis of the liquidation heatmap reveals two distinct liquidity « walls » framing the current price, creating an environment conducive to volatile movements.
LONG Liquidation Cluster (South): A massive concentration of highly leveraged long position liquidations has accumulated in the $89,000 – $91,000 zone. If the price breaks $90,000 with volume, it could trigger a liquidation cascade propelling the price toward $88,000 or even $86,000.
SHORT Liquidation Cluster (North): A wall of short position liquidations has formed above recent highs in the $94,000 – $96,400 zone. A break above $94,500 would trigger a violent « Short Squeeze, » potentially propelling the price toward $100,000.
Probabilistic Scenarios for Coming Days
Scenario 1: « The Purge and Rebound » (45%) – BTC breaks the $90,000 support, triggering stops toward $88,000 – $89,000. Institutional buyers absorb this liquidity, causing a vigorous rebound toward $94,000.
Scenario 2: « Direct Bullish Breakout » (30%) – The price holds current support and breaks through the $91,500 resistance with volume. Shorts are caught off-guard and the price accelerates toward $96,000.
Scenario 3: « Deep Correction » (25%) – The $88,000 supports yield under continued pressure. The price slides toward the 200-day SMA and major structural support at $84,000 – $85,000.
Long-Term Perspectives: An Intact Bullish Vision
Despite short-term volatility, structural valuation models remain resolutely bullish. VanEck projects a base valuation of $2.9 million per Bitcoin by 2050, with a compound annual growth rate (CAGR) of 15%. This perspective reinforces Bitcoin’s thesis as a strategic reserve asset in a world of growing sovereign debt.
The entry into force on January 1, 2026, of the OECD’s Crypto-Asset Reporting Framework (CARF) and the European Union’s DAC8 directive imposes unprecedented tax transparency. While this regulatory normalization may create short-term frictions, it constitutes an essential prerequisite for the massive entry of pension funds and sovereign asset managers.
Conclusion
Bitcoin finds itself in a necessary digestion phase after its impressive run to $126,000. The fierce defense of the $88,000 – $90,000 zone by spot buyers, coupled with funding rate normalization and psychological capitulation of retail investors, suggests a solid floor is being built.
The coming days will be crucial in determining whether the market is ready for a new impulse wave toward $100,000 or whether a deeper correction is necessary to purge residual leverage excesses. In any case, the secular uptrend remains intact, driven by post-halving supply scarcity and continued integration into global finance.
Disclaimer: This article is provided for educational and informational purposes only. It does not constitute investment, financial, or trading advice in any way. Cryptocurrency markets are extremely volatile and carry significant risks. Any investment decision should be made after consulting qualified professionals and based on your personal situation. The author and platform disclaim all liability for financial losses that may result from using this information.