


The digital asset ecosystem is navigating, as of June 17, 2026, a period of critical convergence where global macroeconomics, institutional capital flows, and technical structures intersect to dictate Bitcoin’s trajectory. This article presents a strategic, multi-dimensional market analysis based on multiple timeframes, order book data, and the most recent macroeconomic variables.
🏦 US Monetary Policy: Kevin Warsh’s First Test
Bitcoin’s valuation is now intrinsically tied to interest rate fluctuations, US dollar strength, and bond yields. The FOMC meeting of June 16–17, 2026 carries historic significance: it marks the first chairmanship of Kevin Warsh, Jerome Powell’s successor, confirmed by the Senate and sworn in on May 22, 2026.
Markets are pricing in a 97.4% probability of a rate hold within the 3.50%–3.75% range (CME FedWatch). However, the true driver for risk assets lies in the updated dot plot and the new chair’s rhetoric at his press conference.
May 2026 CPI data released June 10 showed headline inflation at 4.2% YoY — heavily driven by energy price spikes from the US/Iran geopolitical conflict — but core inflation at only 2.9%, slightly below the 0.3% MoM consensus. This dichotomy places the Fed in a delicate balancing act.
The US Dollar Index (DXY) holds firm around the key pivot of 99.50: above it, global risk aversion intensifies; a break below could trigger a massive liquidity influx into digital assets.
🇯🇵 The BOJ’s Systemic Shock: The Carry Trade Threat
The most immediate headwind for global liquidity comes from Japan. The Bank of Japan raised its policy rate from 0.75% to 1.0% on June 16, 2026 — its highest level since 1995. This decision triggers the feared Yen Carry Trade unwind.
For years, institutional players borrowed yen at near-zero rates to invest in high-yield assets like Bitcoin. When the BOJ hikes rates, this strategy becomes unprofitable: funds must urgently liquidate their most liquid assets. Bitcoin, tradeable 24/7, paradoxically becomes the victim of its own superior liquidity.
| BOJ Date | Context | BTC Impact (Drawdown) |
|---|---|---|
| March 2024 | First hike in 17 years | -18% |
| July 2024 | Surprise policy shift | -30% |
| January 2025 | Post-recession adjustment | -31% |
| December 2025 | Rate raised to 0.75% | -32% |
In June 2026, net speculative short positions on the yen have reached a 9-year high. A cascade of forced liquidations weighs heavily on market microstructure, partially materialized by the liquidation of $1.5 billion in long positions over 24 hours.
🌍 Geopolitics and Corporate Demand
The US/Iran conflict has compressed global risk appetite. However, credible rumors of an imminent peace deal to be signed in Switzerland injected measured optimism. Bitcoin responded by recovering over 8% from its June lows (~$59,000), trading back above $64,000.
On the institutional adoption front, SpaceX revealed in its IPO filings that it holds 18,712 BTC (~$1.29 billion) as a strategic treasury reserve — a major institutional validation of Bitcoin’s store-of-value status. Hyperscale Data also maintains $87.1 million in Bitcoin, representing 73% of its market cap.
📊 ETF Flows: Cyclical Bleeding or Structural Exodus?
The first half of June 2026 was marked by exceptional institutional selling pressure. US Bitcoin ETFs suffered cumulative net outflows of $3.4 billion in a single week — a record since their January 2024 launch. BlackRock’s iShares Bitcoin Trust (IBIT) alone absorbed $980 million in outflows.
Nevertheless, this bleeding resembles a cyclical profit-taking driven by reallocation toward bonds and AI, rather than a structural exit. By mid-June, flows showed stabilization signs with daily net inflows of $85.9 million — the strongest since mid-May.
A landmark event: the June 16, 2026 Nasdaq launch of the BlackRock iShares Bitcoin Premium Income ETF (BITA) — the first Bitcoin ETF generating income via a covered call strategy, targeting annual yields of 15–25%. This instrument transforms Bitcoin from a pure speculative asset into a hybrid income-generating vehicle, attractive to pension funds and wealth managers.
🔥 Order Book Microstructure — Liquidity Heatmap
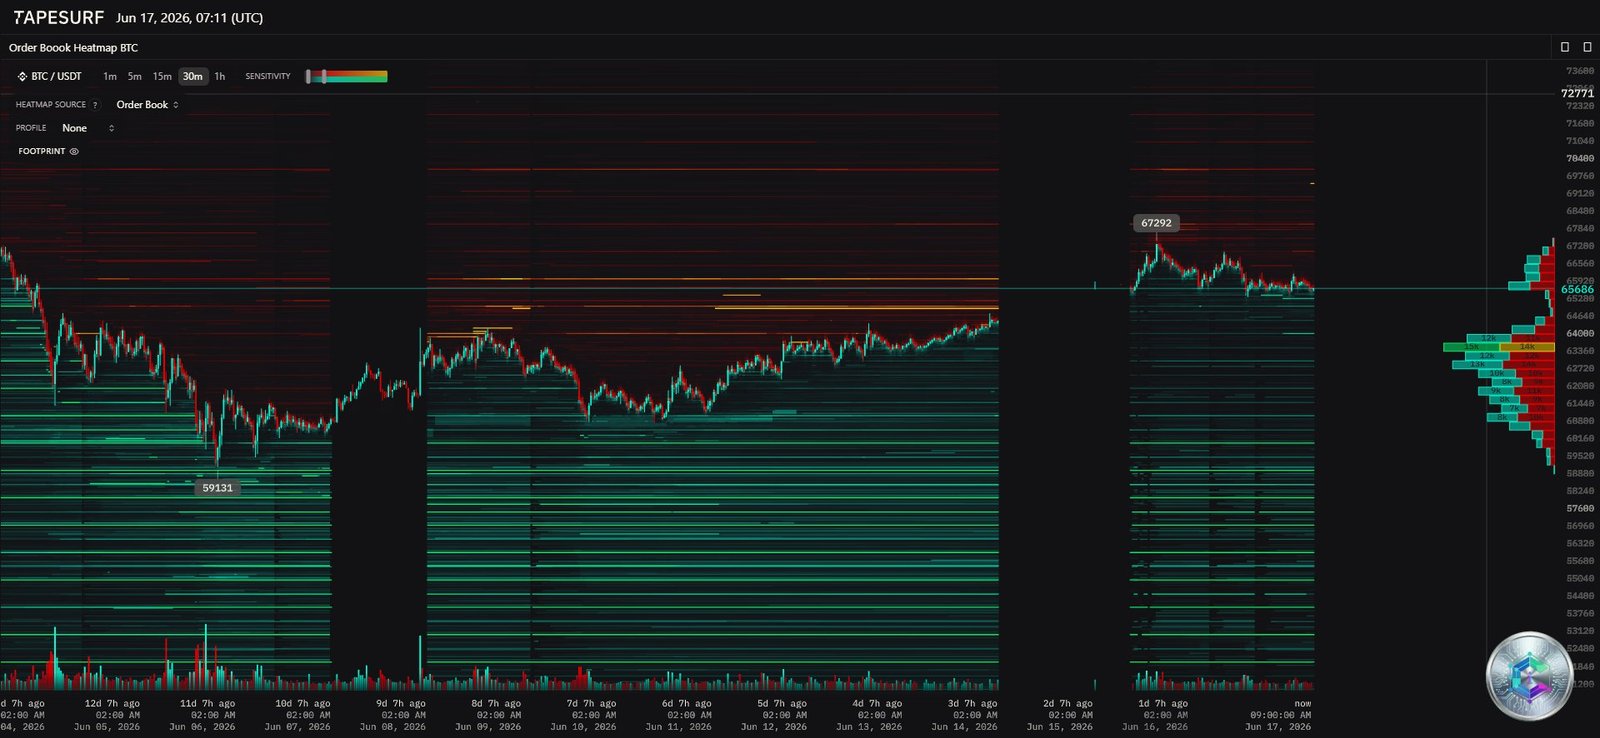
Heatmap analysis reveals a critical order book asymmetry. Massive sell walls (deep red) cap price at $67,292 — an expensive institutional resistance to break. Below, a dense cushion of buy orders defends the $59,131 zone.
The Volume Profile Point of Control (POC) sits around $65,000 — the equilibrium zone where the bulk of trading has concentrated. Recently, a short squeeze liquidated $365 million in short positions over 24 hours, demonstrating the violence of stop-hunting in this microstructure.
📅 Chart Analysis: Daily Timeframe (1D)
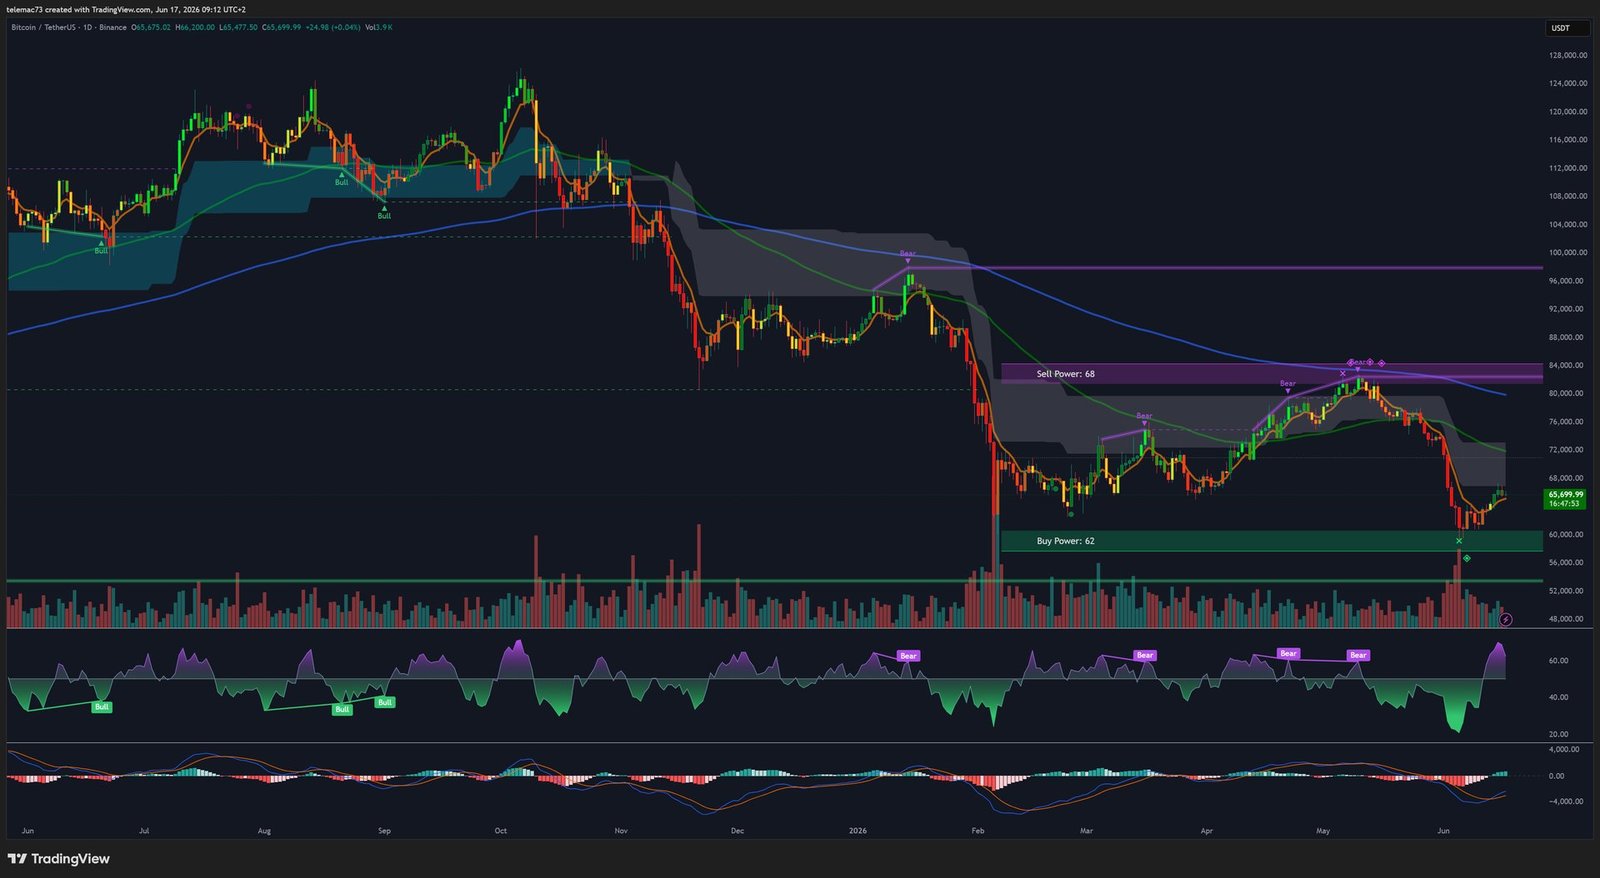
The daily chart reveals a deep correction from the $82,969 April/May peak. The Fibonacci grid (from the $58,947 floor to the $82,969 peak) maps the key battleground levels:
| Fibonacci Level | Price (USD) | Technical Role |
|---|---|---|
| Extension 1.618 | $97,815 | Ultimate bullish cycle target |
| 1.000 (peak) | $82,969 | Major structural resistance |
| 0.618 | $73,793 | MA50 + MA200 cluster — Steel ceiling |
| 0.382 | $68,124 | First resistance — TP1 for bounces |
| 0.236 | $64,616 | Key institutional support |
| 0.000 (floor) | $58,947 | Absolute structure base — catastrophic break |
⚠️ Major alarm signal: the MA50 ($72,623) is about to cross below the MA200 ($73,667) — a « Death Cross » that could trigger waves of algorithmic selling by quant funds. The thick red Ichimoku cloud overhead confirms the structural bearish grip.
⏱️ Intermediate Analysis: 4-Hour Chart
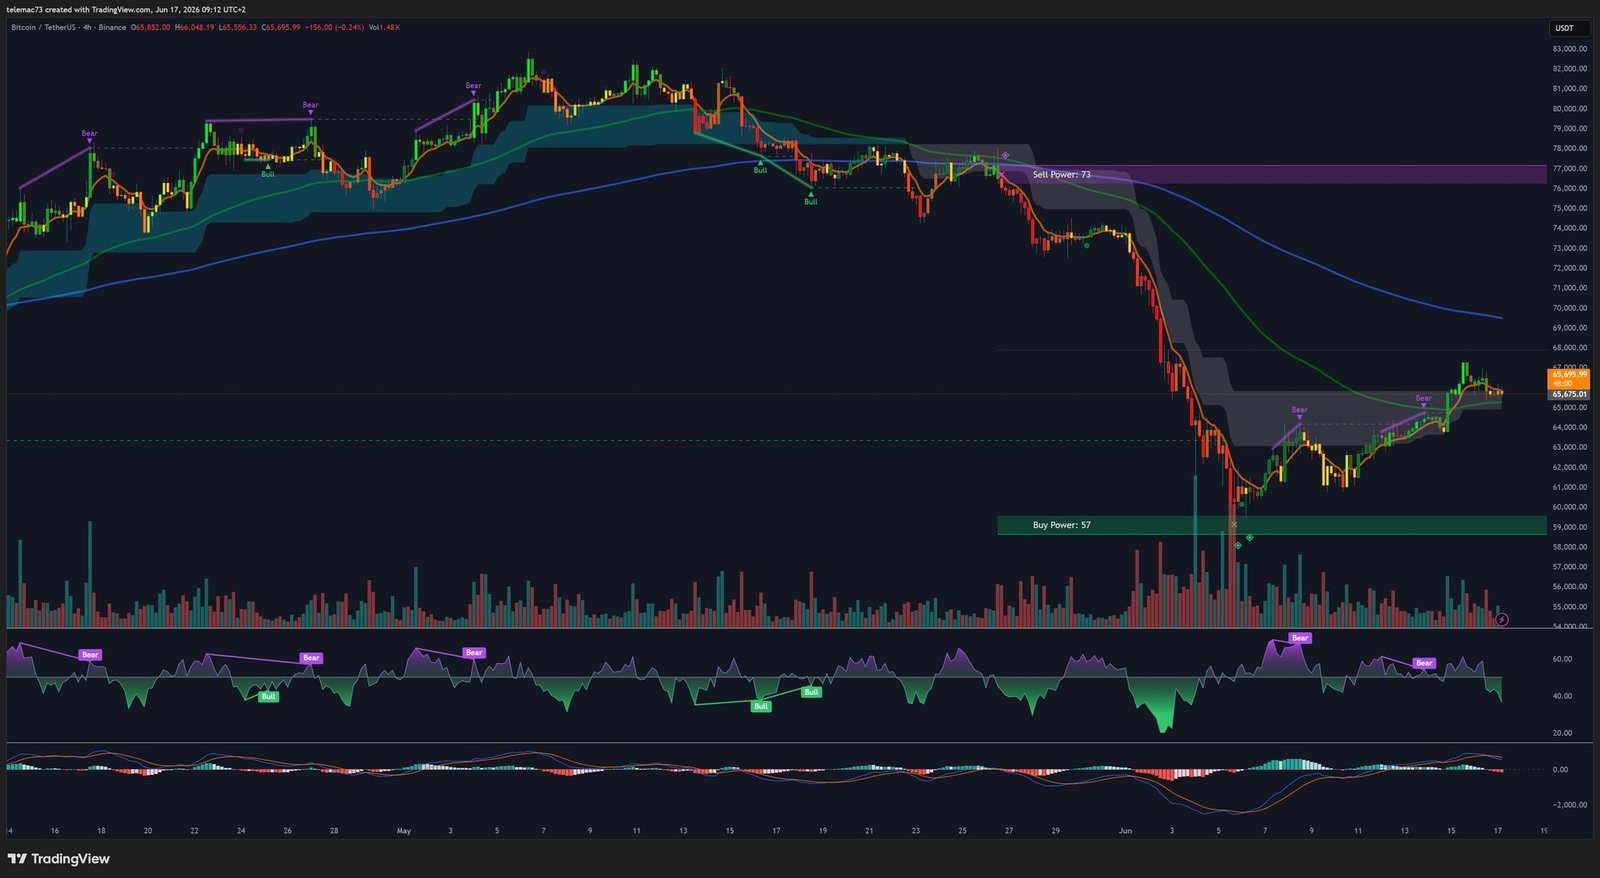
The 4H chart offers a striking contrast to daily-chart pessimism. Early reversal signals are emerging:
- Hidden bullish divergence: the RSI signal line (26.92) is diving harder than price, signaling seller exhaustion.
- MACD: shrinking red histogram bars approaching zero — an imminent Golden Cross on this timeframe.
- Ichimoku: the Kumo is thinning, reducing resistance to a potential bullish breakout.
- Support zone: the green Buy Power at $59,000–$60,000 is acting as an institutional liquidity trampoline.
⚡ Intraday Microstructure: 15-Minute Chart
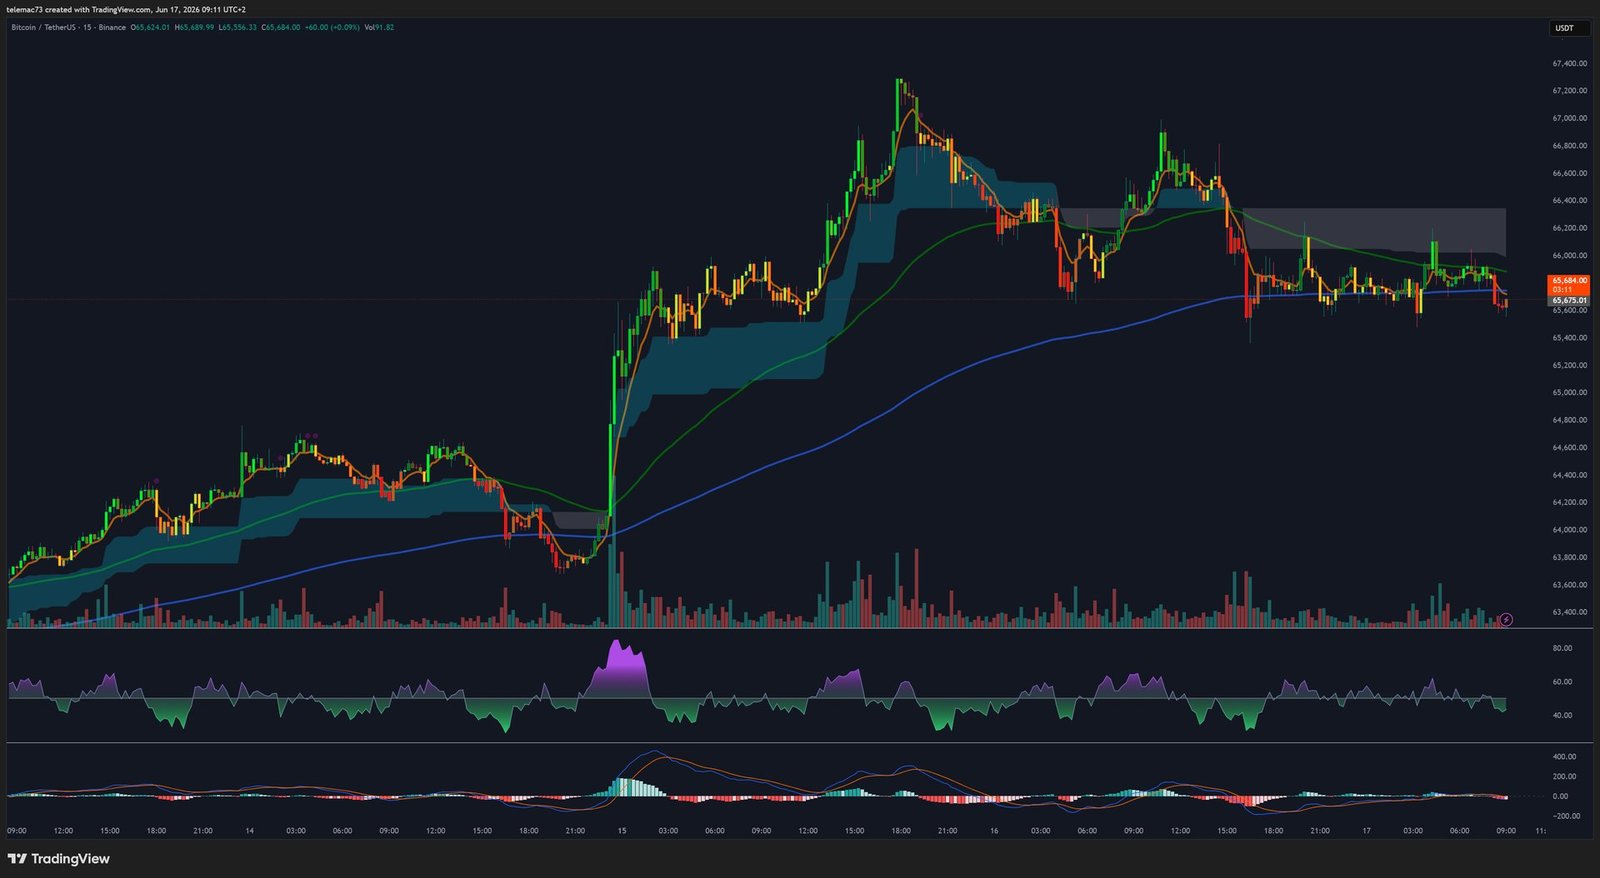
The 15-minute chart exposes the market’s algorithmic pulse. After a near-vertical bullish impulse (tall green candles + volume spike), the market entered a lateral compression phase around $65,000 — the signature of algorithmic mean reversion.
The MACD is hovering on the zero line with no clear directional bias. The critical intraday pivot sits at $64,800: defending it maintains bounce momentum; losing it triggers an immediate test of lower liquidity zones.
🌈 Fundamental Valuation: The Rainbow Chart
The Bitcoin Rainbow Chart — a logarithmic regression model based on halving cycles — places Bitcoin in a zone of extreme undervaluation at $64,500:
| Rainbow Chart Band | Projected Price (July 1, 2026) | Implication |
|---|---|---|
| 🔴 Fire Sale! | $99,143 | Maximum asymmetric accumulation |
| 🟠 BUY! | $134,755 | Historically favorable opportunity |
| 🟡 Accumulate | $184,990 | Long-term institutional buying |
| 🟢 HODL | $337,147 | Fair value in the maturity cycle |
| 🔵 Maximum Bubble | $1,164,644 | Systemic overheating |
At ~$64,500, Bitcoin trades at a staggering 53.5% below the « Fire Sale » band ($99,143). This statistical anomaly underscores the intensity of the macro shock compressing its valuation — and justifies why corporate buyers are aggressively defending the $60,000 zone.
🔀 Two Bifurcated Scenarios for H2 2026
🚀 Bullish Scenario — Macro Short Squeeze
Catalysts: dovish Warsh rhetoric at FOMC + US/Iran peace deal signed in Switzerland → DXY relaxation.
Technical sequence: bounce from $64,616 support → break above 21-day EMA → reclaim of $68,124 → absorption of $67,292 sell wall → test of $70,000, then MA50/MA200 cluster at $73,700.
📉 Bearish Scenario — Carry Trade Contagion
Catalysts: restrictive post-2026 dot plot + escalating BOJ pressure → arbitrage profitability collapses → massive margin calls.
Technical sequence: break of $64,616 support → Death Cross confirmed → loss of $60,700 → final battle at $58,947. Failure here opens a prolonged liquidity desert.
📝 Conclusion
Bitcoin’s market is operating, as of June 17, 2026, at a critical inflection point. The prolonged volatility compression observed on medium-duration charts is the empirical signature preceding an extremely violent directional expansion. On one side: a historic valuation discount and solid institutional demand; on the other: a hostile macro environment orchestrated by the BOJ and the Fed. The breach of the identified technical invalidation levels — $64,616 to the downside, $68,124 to the upside — will dictate the market regime for the entirety of H2 2026.
⚠️ Disclaimer: This article is written for educational and informational purposes only. It does not constitute investment advice or a recommendation to buy or sell digital assets. Cryptocurrency markets are highly volatile and involve a risk of capital loss. Please consult a qualified financial advisor before making any investment decision.

