
As we reach the midpoint of May 2026, Bitcoin (BTC) is navigating turbulent waters, hovering around $78,000 following a brutal 37% correction from its all-time high of $126,000 set in October 2025. A perfect storm of adverse macroeconomic catalysts, massive options expirations, and leveraged liquidation cascades has kept relentless downward pressure on digital asset markets. This comprehensive multi-timeframe technical and fundamental analysis decodes current market dynamics and maps out the key scenarios traders must monitor.
🌐 Macroeconomic Context: A High-Pressure Environment
The macroeconomic landscape of May 2026 is defined by a convergence of headwinds bearing down simultaneously on all risk assets — with Bitcoin squarely in the crossfire.
Inflation, Rates and Bond Yields
Hotter-than-expected inflation data for April 2026 — most notably a 6% surge in the US Producer Price Index (PPI) — reignited fears of a persistently restrictive monetary policy. US 10-year Treasury yields have broken above the critical 4.5% threshold, prompting markets to now price a 44% probability of another Fed rate hike by December 2026, up sharply from just 22.5% the previous week. This quantitative tightening cycle exerts gravitational pressure on the valuations of all speculative assets.
Geopolitical Tensions and the Energy Shock
An escalation of military hostilities in the Middle East propelled Brent crude oil beyond the symbolic $100 per barrel mark, fueling medium-term inflationary expectations and intensifying capital flight toward traditional safe-haven assets at the expense of digital currencies.
Major Liquidity Events
Friday, May 15, 2026 represented a pivotal inflection point for crypto markets. The expiration of derivative options worth a notional $2.6 billion on Deribit — over $2 billion of which was concentrated in Bitcoin — created a gravitational pull toward the max pain price of $80,000. The expiry coincided with a cascade of leveraged long liquidations totaling $581 million across the crypto market within 24 hours, including $189 million in Bitcoin longs alone.
Institutional Factors: Strategy and Bhutan’s Sovereign Fund
Markets are closely watching the treasury management of Strategy (MicroStrategy), the world’s largest corporate Bitcoin holder with a portfolio of 818,869 BTC acquired at an average cost of $75,543. Rumors that the company might consider selling a fraction of its holdings to cover dividend obligations on its STRC preferred shares temporarily fueled anxiety. Separately, Bhutan’s sovereign wealth fund (Druk Holding and Investments) is suspected of having liquidated a substantial portion of its Bitcoin reserves since mid-2025. Finally, the forced suspension of trading on THORChain following a $10.7 million multi-chain exploit added further chill to DeFi sentiment.
| Indicator / Event | Value |
|---|---|
| Deribit Options Expiry (May 15) | $2.6B total ($2B in BTC) |
| Max Pain Price | $80,000 |
| Long Liquidations (24h) | $581M ($189M in BTC) |
| US 10Y Treasury Yield | > 4.5% |
| Brent Crude Oil Price | > $100/barrel |
| Strategy (MSTR) Treasury | 818,869 BTC (avg cost: $75,543) |
| Drawdown from Oct. 2025 ATH | -37% (ATH: $126,000) |
📊 Multi-Timeframe Technical Analysis
A rigorous reading of Bitcoin’s market structure requires a multi-temporal approach, combining the macro view of the daily chart, the intermediate dynamics of the 4-hour frame, and the intraday precision of the 15-minute chart.
📅 Daily Chart (1D) — The Big Picture
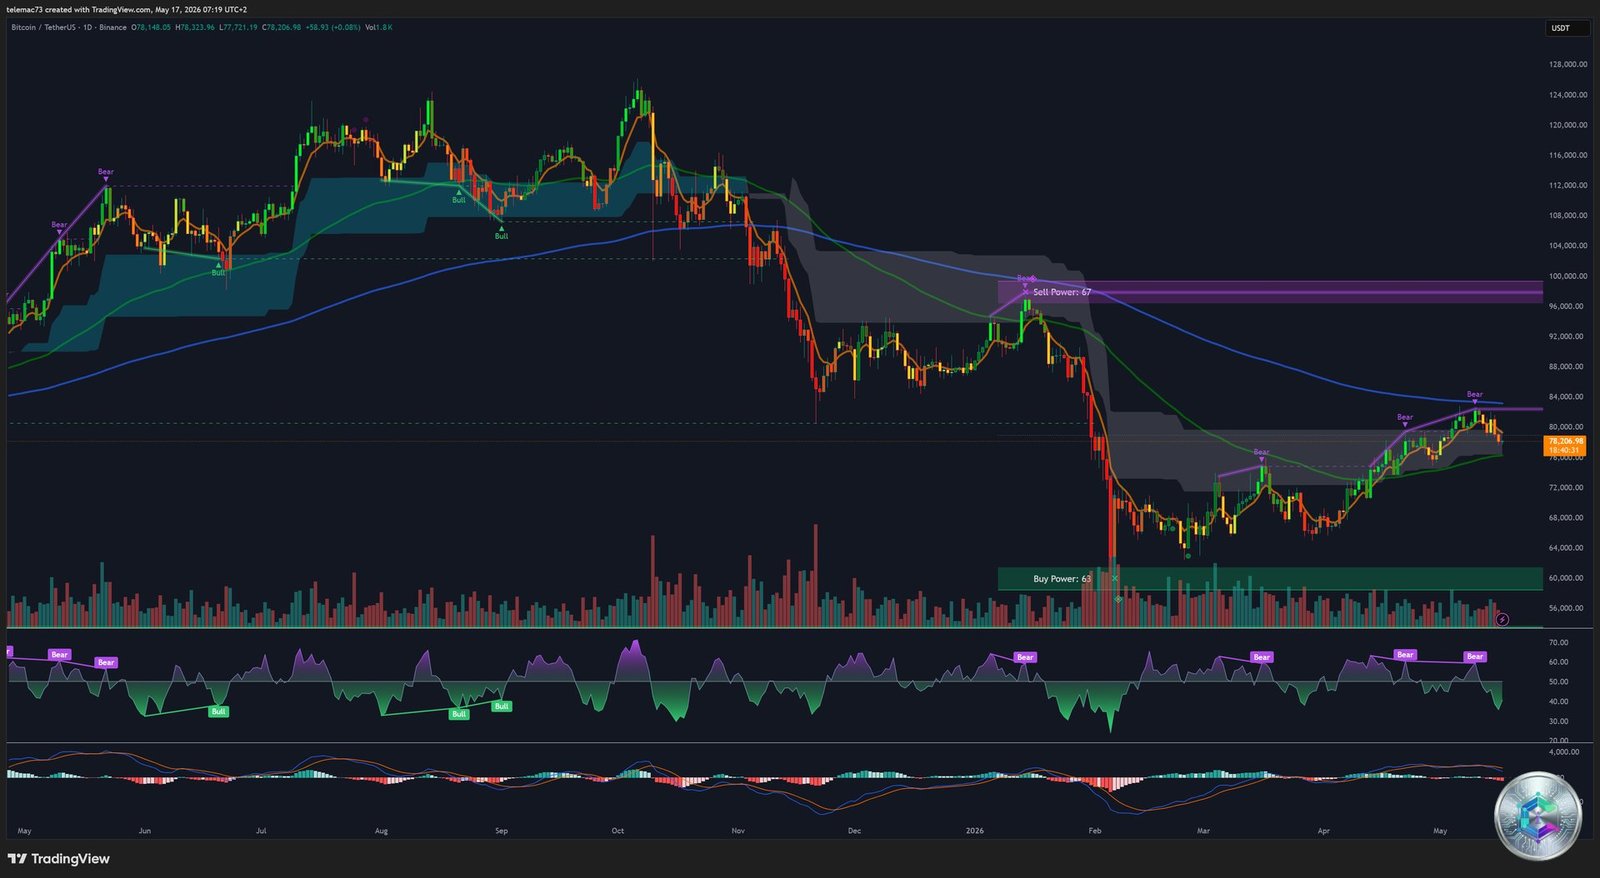
Since its all-time high above $126,000 in October 2025, Bitcoin has entered a medium-term bear market correction, shedding 37% of its value to trade around $79,000 by mid-May 2026. The most defining structural feature on the daily chart is the price’s position relative to its 200-day Exponential Moving Average (EMA 200), which oscillates between $90,000 and $92,000. Price is currently well below this long-term directional guide, characterizing a macro-level neutral-to-bearish transition phase.
That said, the structure shows signs of stabilization. The demand zone labeled « Buy Power 53 » around $60,000 served as a solid foundation for the spring rally. That recovery then stalled at a distribution zone (« Sell Power 57 ») between $96,000 and $98,000. The daily RSI is stabilizing in the neutral 50–60 band, confirming that the bulk of the bearish momentum from the autumn correction has been absorbed.
⏱ 4-Hour Chart (4H) — Local Distribution in Play
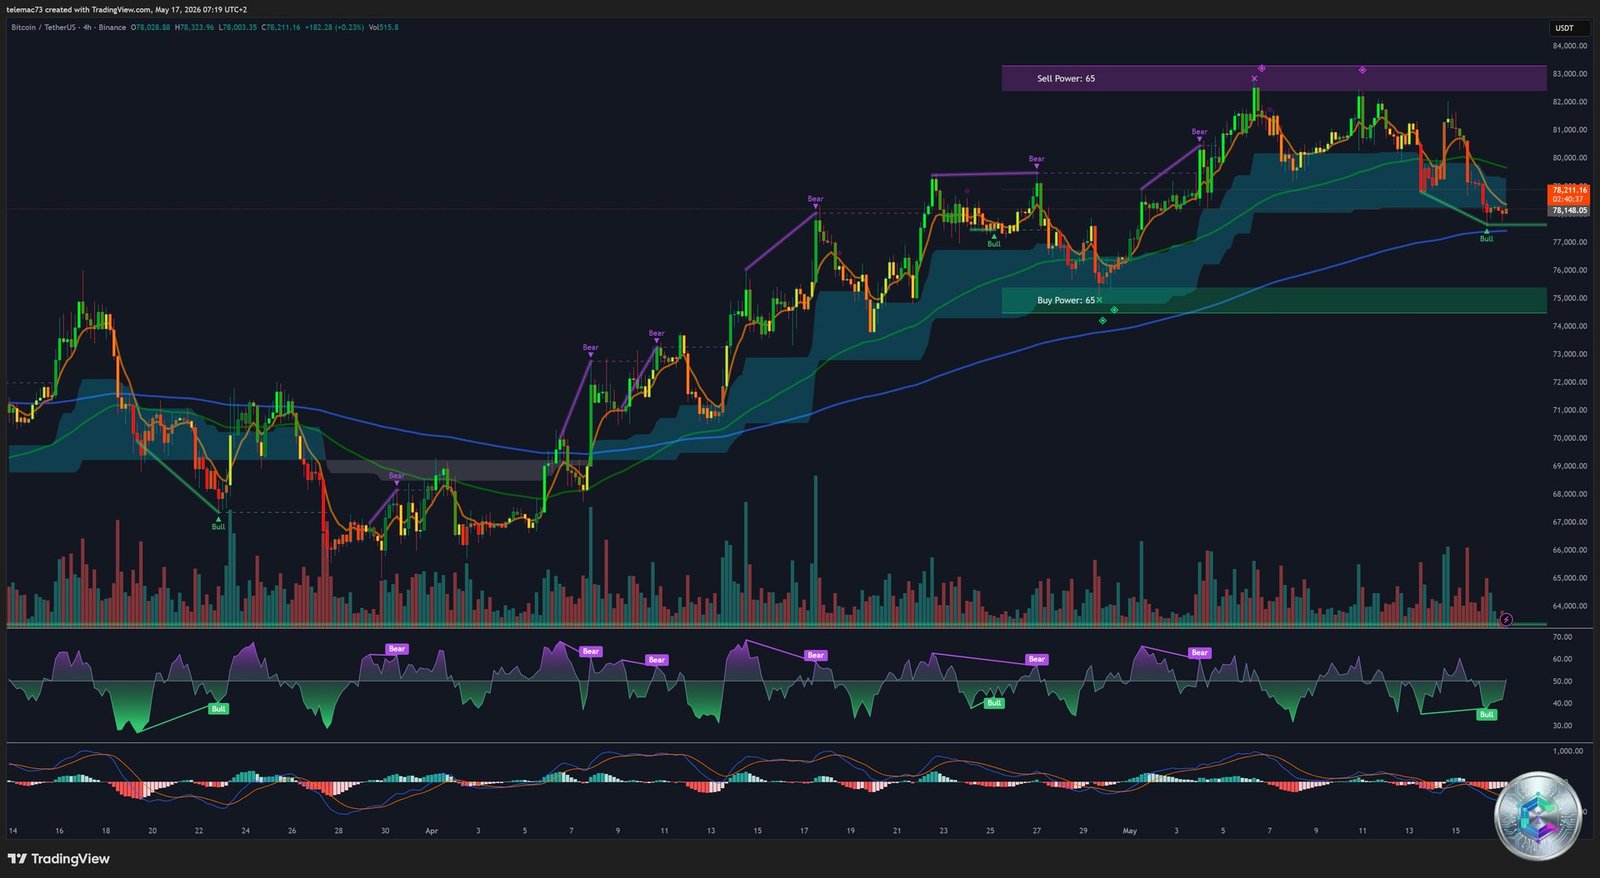
The 4-hour chart illustrates the transition from a bullish recovery phase (from the $60,000 lows) to a local distribution phase below the major resistance at $82,000 – $82,850. Several chart structures are noteworthy:
- Ascending Triangle Breakdown: The market had drawn a compression ascending triangle with a clear horizontal resistance at $82,000. A bearish breakdown through the base of this formation occurred during the May 15 session, triggering a sharp retreat.
- Polarity Retest: Following the breakdown, a throwback move confirmed the role reversal of the $80,000 zone — former support now acting as active resistance.
- EMA 200 (4H) as a Critical Dynamic Support: The 200-period moving average sits at $77,800. The buyers’ successful defense of this level during the recent low at $77,614 preserves the short-term intermediate bullish structure.
- Relative Strength Zones: A buyer absorption zone (Buy Power 65) is identified between $74,000 and $75,000, while selling pressure (Sell Power 65) caps the upside between $82,000 and $83,000.
The 4H RSI plunged toward oversold levels near 30, generating a « Bull » buy signal that hints at an imminent exhaustion of intermediate bearish momentum.
⚡ 15-Minute Chart (15M) — Intraday Brutality
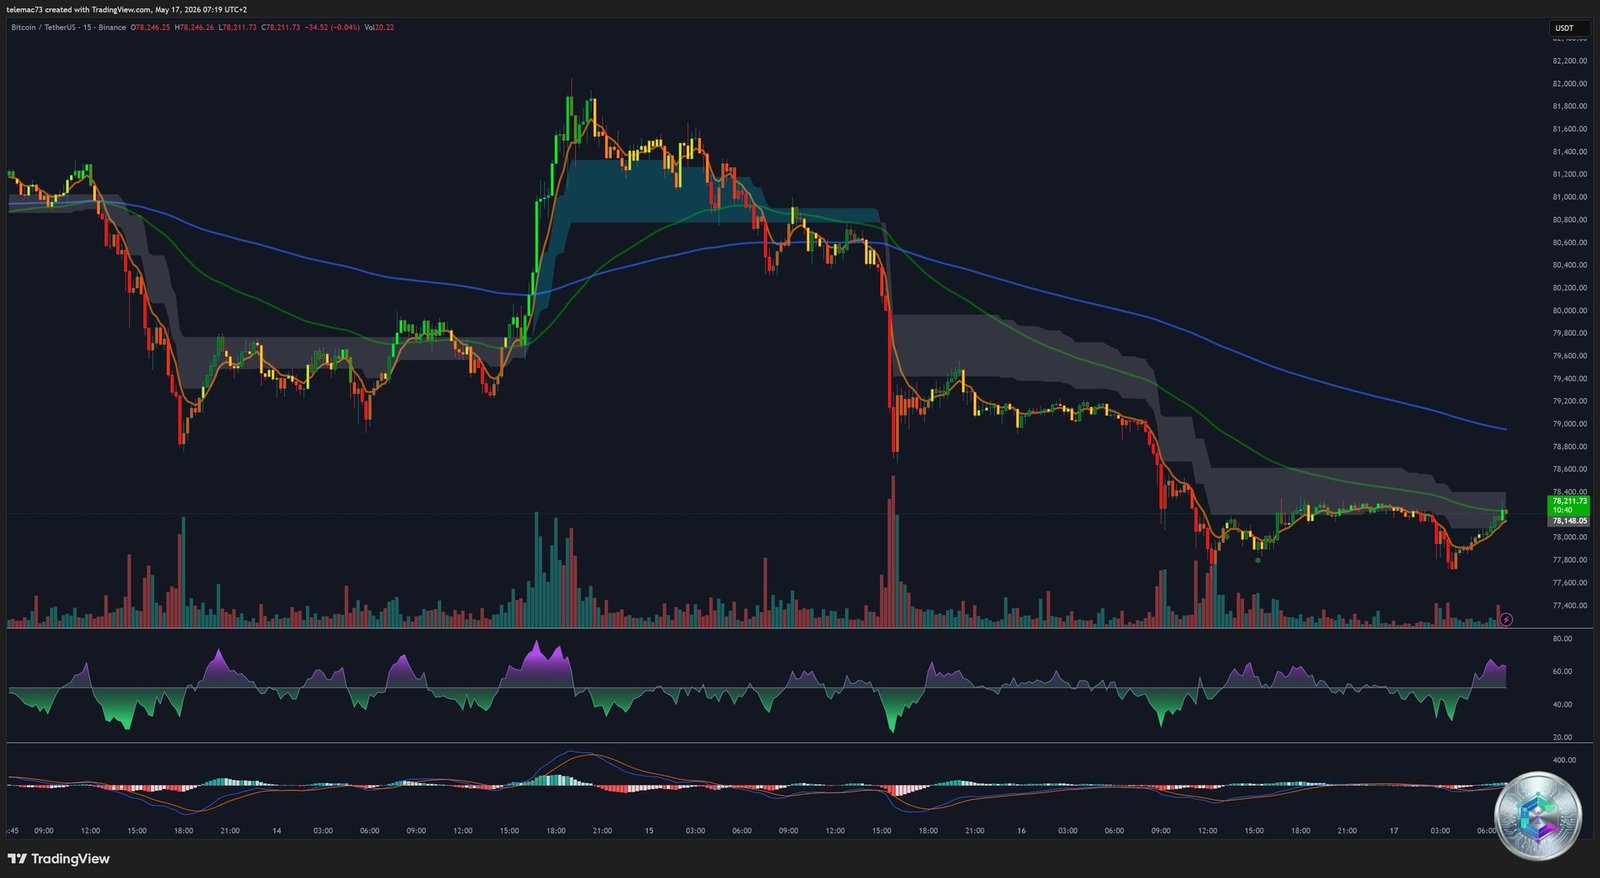
The 15-minute chart captures the ferocity of the liquidity flush that followed the options expiry:
- Waterfall and Bear Flag: Price plunged vertically from $81,400 to a first support at $78,000, followed by a low-volume ascending lateral consolidation — the textbook structure of a bear flag. A final leg down to $77,614 completed the flush of late leveraged longs.
- Moving Average Death Cross: The fast-moving average (green line) crossed below the EMA 200 (blue line) around $80,600, establishing the latter as a relentless intraday dynamic resistance at $79,600.
- Intraday Double Bottom and Stabilization: Holding above the $77,614 low on the second test formed a short-term double bottom, enabling a technical bounce toward the $78,211 equilibrium zone while generating a bullish RSI divergence.
🔥 Liquidity Mapping: What the Order Book Heatmap Reveals
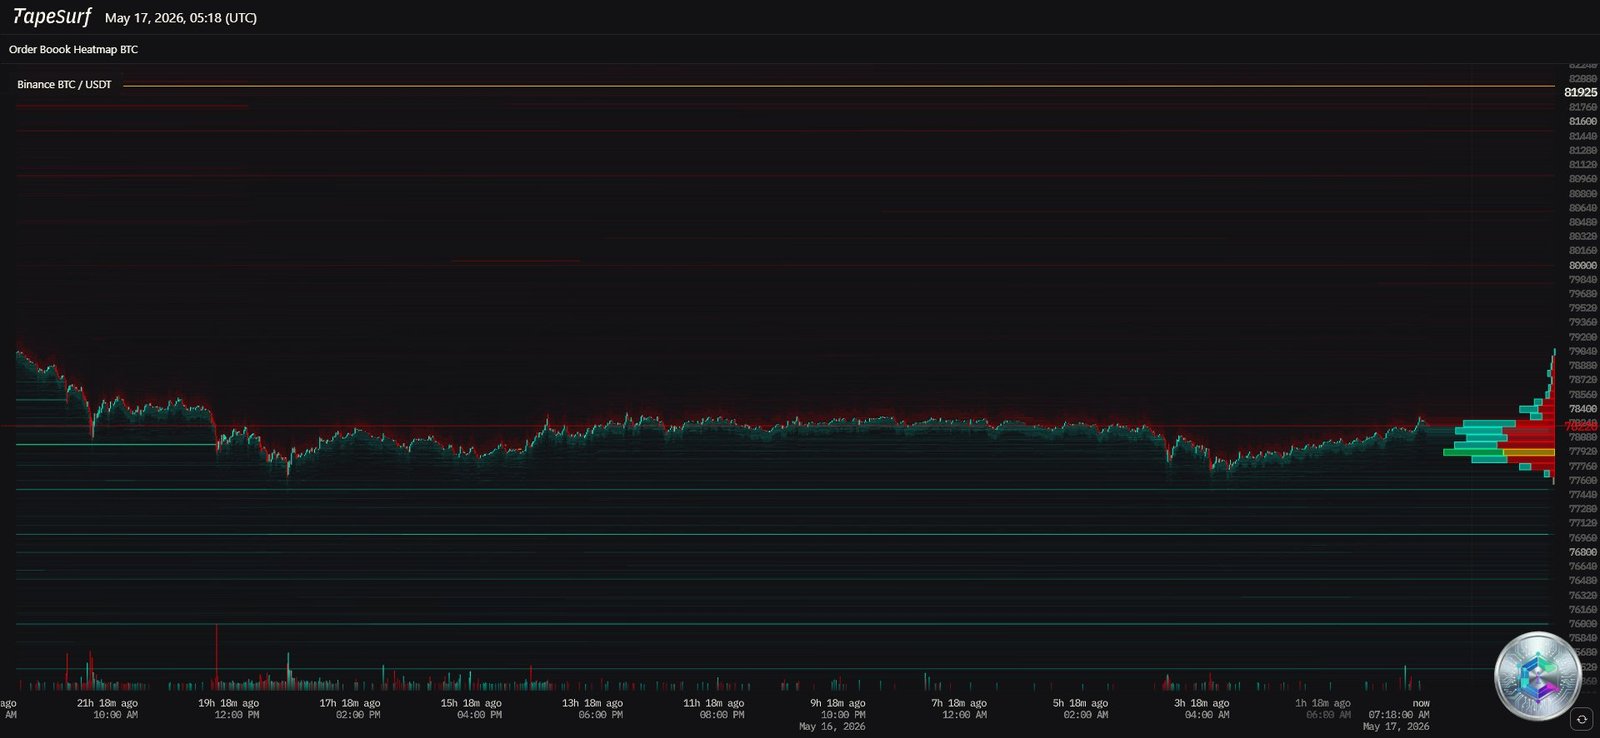
The TapeSurf order book heatmap provides critical intelligence on the location of institutional liquidity:
- The $81,925 Sell Wall (Orange Line): An exceptional concentration of static resting limit sell orders positioned at this precise level for several days. This is the absolute bullish pivot that must be reclaimed to open the path back toward all-time highs.
- Consensus Zone at $77,600 – $78,400: The horizontal volume profile reveals a massive accumulation of transactions (teal and red zones). The Point of Control (POC) within this band marks the exact price where the greatest volume of exchanges recently occurred — the current temporary market consensus level.
- Institutional Safety Nets: Resting bid orders are staggered below current price at $77,200, $76,800, and especially $75,500, indicating passive institutional accumulation deployed as a defensive floor.
🎯 Synthesis and Forward-Looking Scenarios
At the intersection of chart analysis, momentum oscillators, and order flow dynamics, two primary market scenarios emerge for the short-to-medium term:
| Scenario | Validation Factors | Price Targets | Probability |
|---|---|---|---|
| 🟢 Scenario A — Bear Trap (Bounce) | EMA 200 (4H) at $77,800 holds ; 15M RSI bullish divergence ; short OI unwinding | $80,000 → $81,925 → $85,000 | 55% |
| 🔴 Scenario B — Bearish Breakdown | Confirmed 4H close below $77,614 ; geopolitical escalation ; US yields > 4.5% | $75,000 → $71,000 | 45% |
🟢 Scenario A — The Bear Trap (Probability: 55%)
This scenario is underpinned by the strength of the passive accumulation visible in order books above $77,600. While the long-term daily trend remains under the bearish influence of the EMA 200 at $90,000, the short-term market presents a classic bear trap setup: increasingly negative funding rates on perpetual contracts indicate that many traders have opened aggressive short positions directly on top of the major technical support.
If the EMA 200 (4H) at $77,800 continues to hold, sellers’ inability to break through will trigger exhaustion followed by a mechanical short squeeze. A reclaim of $79,000 would set off forced short-covering, propelling price toward $80,000, then testing the resting sell wall at $81,925. Clearing that level would then open the path to $85,000 over the medium term.
🔴 Scenario B — The Breakdown and Capitulation (Probability: 45%)
This bearish continuation scenario hinges on a persistent deterioration of macroeconomic sentiment. Should Middle Eastern geopolitical tensions intensify, keeping Brent above $100, and US Treasury yields continue their ascent beyond 4.5%, capital flight into the dollar would accelerate.
On the technical front, a confirmed 4-hour candle close below $77,614 would invalidate the EMA 200 (4H) support, triggering a fresh panic wave and a swift slide toward the psychological support zone of $75,000. In the event of broader capitulation across global equity markets, the ultimate bearish target would be $71,000 — the level where the bulk of medium-term leveraged position liquidation orders are concentrated.
⚠️ Disclaimer
This article is written for educational and informational purposes only. It does not constitute investment advice or a recommendation to buy or sell any digital asset or financial instrument. Cryptocurrency markets are highly volatile and carry a risk of partial or total loss of capital. Any investment decision should be made only after consulting a qualified and licensed financial advisor.