
In March 2026, Bitcoin (BTC) is navigating a period of structural transformation of rare intensity. Trading in a narrow range between $72,500 and $74,000, the asset is demonstrating asymmetric resilience against a macroeconomic environment under extreme pressure: a historic oil shock, monetary uncertainty, and a sweeping overhaul of the U.S. regulatory framework. This multi-timeframe analysis dissects the forces at play and models the probabilistic trajectories for the current quarter.
🌍 Macro & Geopolitics: The Bitcoin Paradox
The Strait of Hormuz Energy Shock
The partial blockade of the Strait of Hormuz — a strategic chokepoint through which approximately 20% of the world’s oil supply passes — has sent shockwaves through commodity markets. Targeted strikes on energy infrastructure pushed Brent crude from $60 to peaks oscillating between $100 and $120 per barrel.
This supply shock is triggering the classic macro-inflationary chain reaction: more expensive energy feeds directly into global CPI, forcing central banks to maintain restrictive monetary policies. Historically, this scenario has been deeply hostile to risk assets like cryptocurrencies.
And yet, Bitcoin has appreciated nearly 9% since the onset of hostilities, spectacularly outperforming traditional safe havens such as gold (−5%) and the S&P 500 (−4%). This behavioral divergence suggests a profound mutation in Bitcoin’s financial ontology: institutional capital now perceives it as a value-preservation infrastructure impervious to physical supply chains.
The mining industry further confirms this immunity. Approximately 90% of global hashrate operates on electricity markets with very low correlation to crude oil prices (renewable energy, hydropower, flared gas). Miner profitability depends far more on « hashprice » volatility driven by BTC’s price action than on direct energy costs.
FOMC & the « Sell the News » Risk
Imported inflation is hampering the Fed’s ability to initiate an easing cycle. Rate cuts initially anticipated for Q1 2026 are now massively pushed back to the second half of the year, with rates expected to hold in the 3.50%–3.75% range.
Bitcoin’s behavioral track record against FOMC announcements is telling: in 2025, the asset posted significant losses within 48 hours of 7 out of 8 Fed meetings. In January 2026, a simple rate hold triggered a brutal correction from $90,400 to $83,383 in two days. This « sell the news » pattern demands surgical risk management ahead of Jerome Powell’s public statements.
⚖️ Regulatory Revolution: The SEC-CFTC « Project Crypto »
Beyond cyclical fluctuations, Bitcoin’s fundamental value is being redefined by a major institutional breakthrough: the signing of a historic Memorandum of Understanding between the SEC (under Paul S. Atkins) and the CFTC (under Michael S. Selig), launching « Project Crypto ».
This unified framework fills the legal vacuum that pitted securities against commodities, establishing:
- A shared taxonomy and coordinated oversight
- Clear rules for leveraged trading
- A safe harbor for decentralized infrastructure developers
- Streamlined compliance procedures, eliminating registration redundancies
The impact is immediately quantifiable: U.S. Bitcoin Spot ETFs have attracted over $1.3 billion in net inflows in March alone, including $763 million in a single week. The reduced regulatory risk premium is consolidating institutional support levels and accelerating portfolio reallocation toward BTC.
Peripheral Frictions
The ecosystem’s maturation is not without turbulence. The bankruptcy of lender BlockFills (Chapter 11) is a stark reminder of counterparty risks in high-yield centralized platforms. The $LIBRA scandal in Argentina — a 96% collapse following presidential promotion, a classic rug pull — is fueling caution among global regulators. In Asia, Japan’s tightened KYC protocols are creating a temporary liquidity bottleneck for retail participants.
🔥 Market Microstructure: Order Book & Derivatives
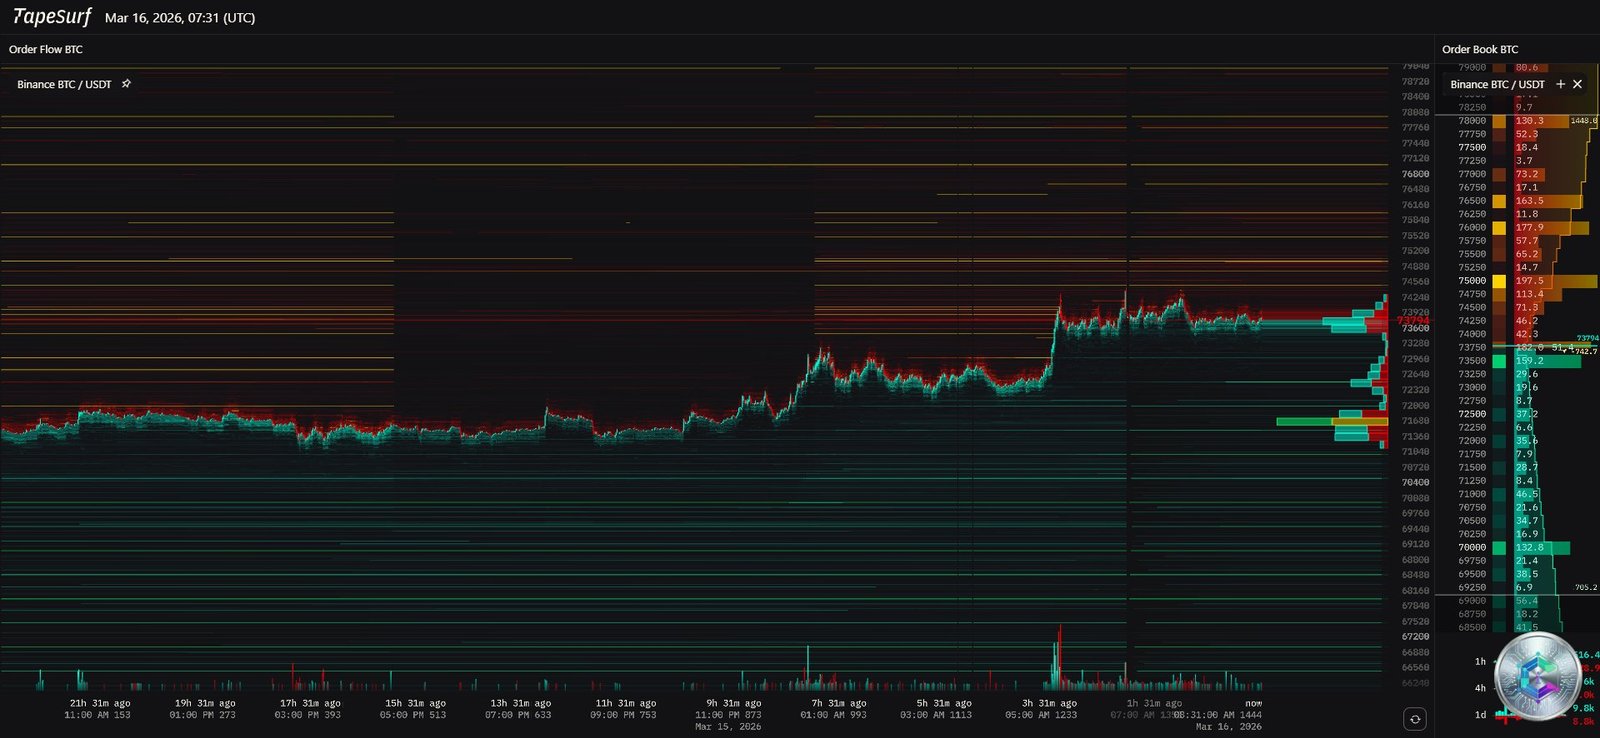
Order Book Heatmap Analysis
The TapeSurf heatmap reveals a striking liquidity asymmetry:
- Resistance Wall (Sell Wall): Dense concentration of sell orders between $74,000 and $75,500. This glass ceiling is extremely difficult to break through without sustained institutional volume inflows.
- Absorption Zone (Buy Support): Horizontal strata of buy orders visible at $71,500, with a massive block between $68,000 and $70,300. Algorithmic buyers (VWAP/TWAP) are passively accumulating on retracements.
The price’s « staircase » progression — consolidating at each level before attacking the next liquidity layer — is typical of a healthy, controlled trend, devoid of speculative euphoria.
Open Interest & Put/Call Ratio
Open Interest (OI) has grown 5.3% in 24 hours to reach a historical peak of $49.3 billion across major platforms (Binance, Bybit, OKX, Gate). On the IBIT ETF, the Put/Call ratio stands at 0.75 (46,141 Calls vs. 34,636 Puts), revealing a resolutely bullish institutional bias and anticipations of a breakout above $75,000.
This colossal OI level beneath a major resistance zone is the potential fuel for a devastating short squeeze. The recent rally above $73,000 is a perfect illustration: $200 million in liquidations within 24 hours, 74% of which (≈$143M) were shorts. Liquidation heatmaps now model the majority of remaining liquidations in the $74,500–$76,000 band.
📊 Multi-Timeframe Technical Analysis
Daily Chart (1D): Ascending Triangle & the Death Cross Debate
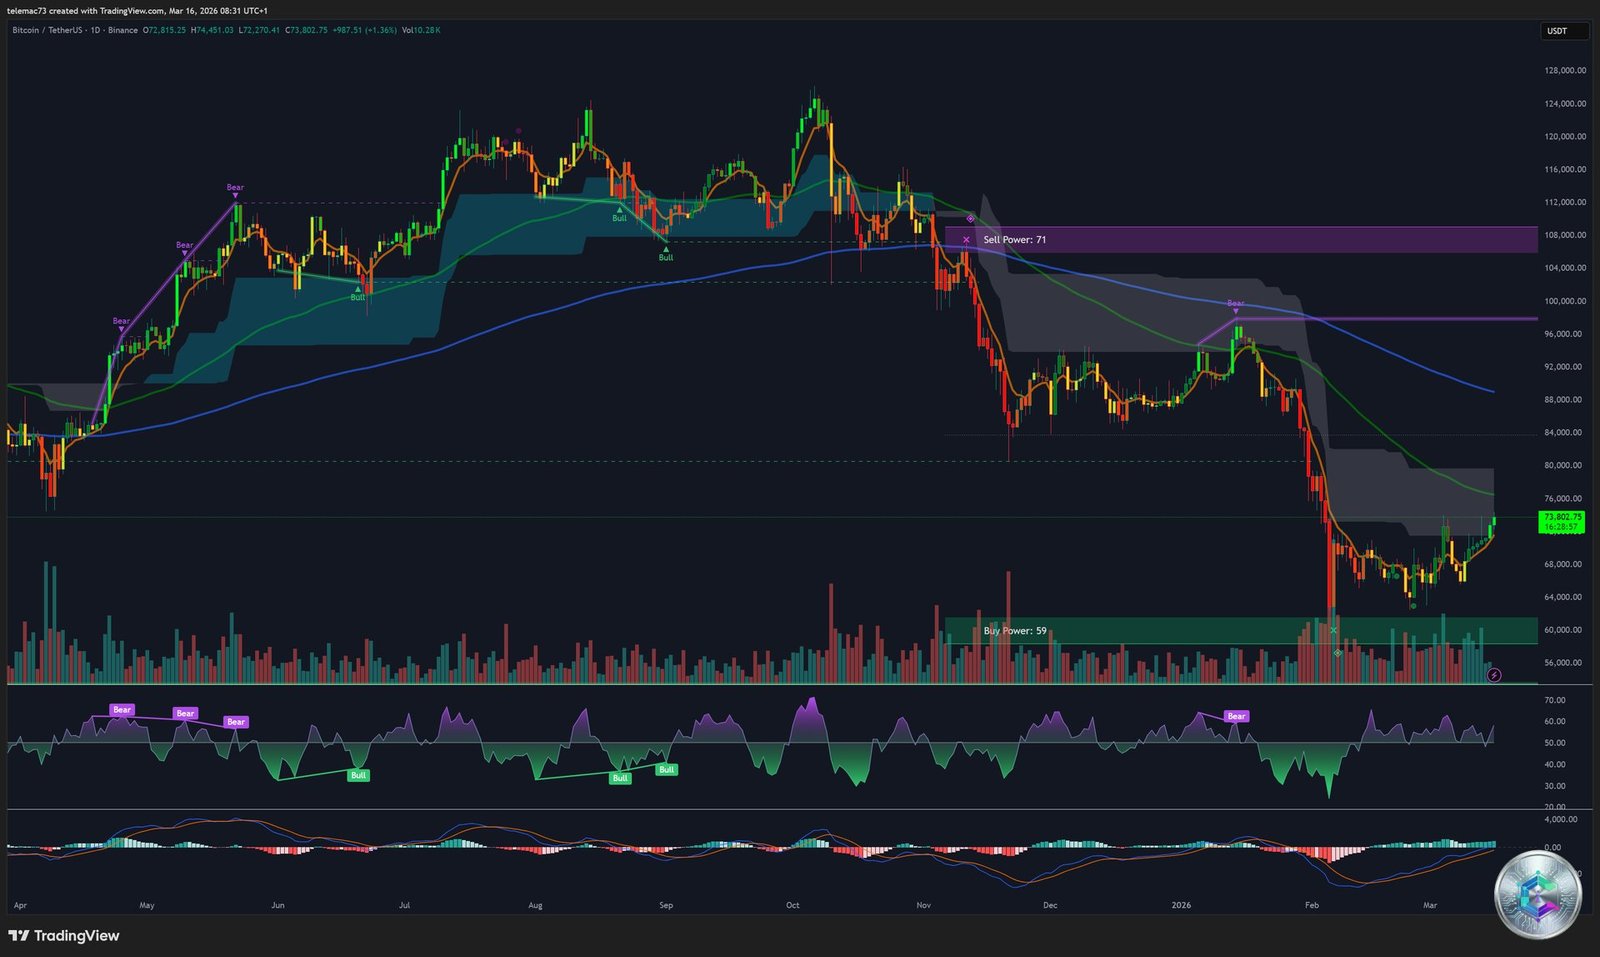
After an all-time high at approximately $126,000 in October 2025 and a drawdown of over 50% to the $60,000–$62,000 floor (an institutional accumulation zone confirmed by a « Buy Power: 59 » signal), BTC is tracing an asymmetric V-shaped recovery that clearly models an Ascending Triangle:
- Oblique base: consecutively higher lows from $60,000, reflecting growing buying pressure
- Horizontal ceiling: resistance at $74,500 tested with conviction
- Geometric breakout target: $80,700–$85,000
The Death Cross (SMA50 crossing below SMA200) on the 3-day chart has raised concerns in part of the analytical community. Historically rare (3 occurrences before 2026), this signal preceded average drawdowns of 35%. However, moving averages are, by mathematical nature, lagging indicators: the current Death Cross is the statistical artifact of the crash from $126,000, not a predictive signal. On the 1D chart, price is firmly trading above the EMA 50 ($71,681) and EMA 200 ($70,404), transforming these levels into solid dynamic supports.
Daily Oscillators Dashboard
| Indicator | Value | Signal |
|---|---|---|
| RSI (14) | 74.18 | ✅ Strong Buy (bullish momentum confirmed) |
| Stochastic (9,6) | 98.15 | ⚠️ Overbought — consolidation risk |
| MACD (12,26) | 540.80 | ✅ Strong Buy (expanding green histogram) |
| ADX (14) | 41.36 | ✅ Exceptionally strong trend validated (>25) |
| ATR | 585.87 | ⚡ High volatility — targets rapidly attainable |
4-Hour Chart (4H): Kumo Breakout & Bull Flags
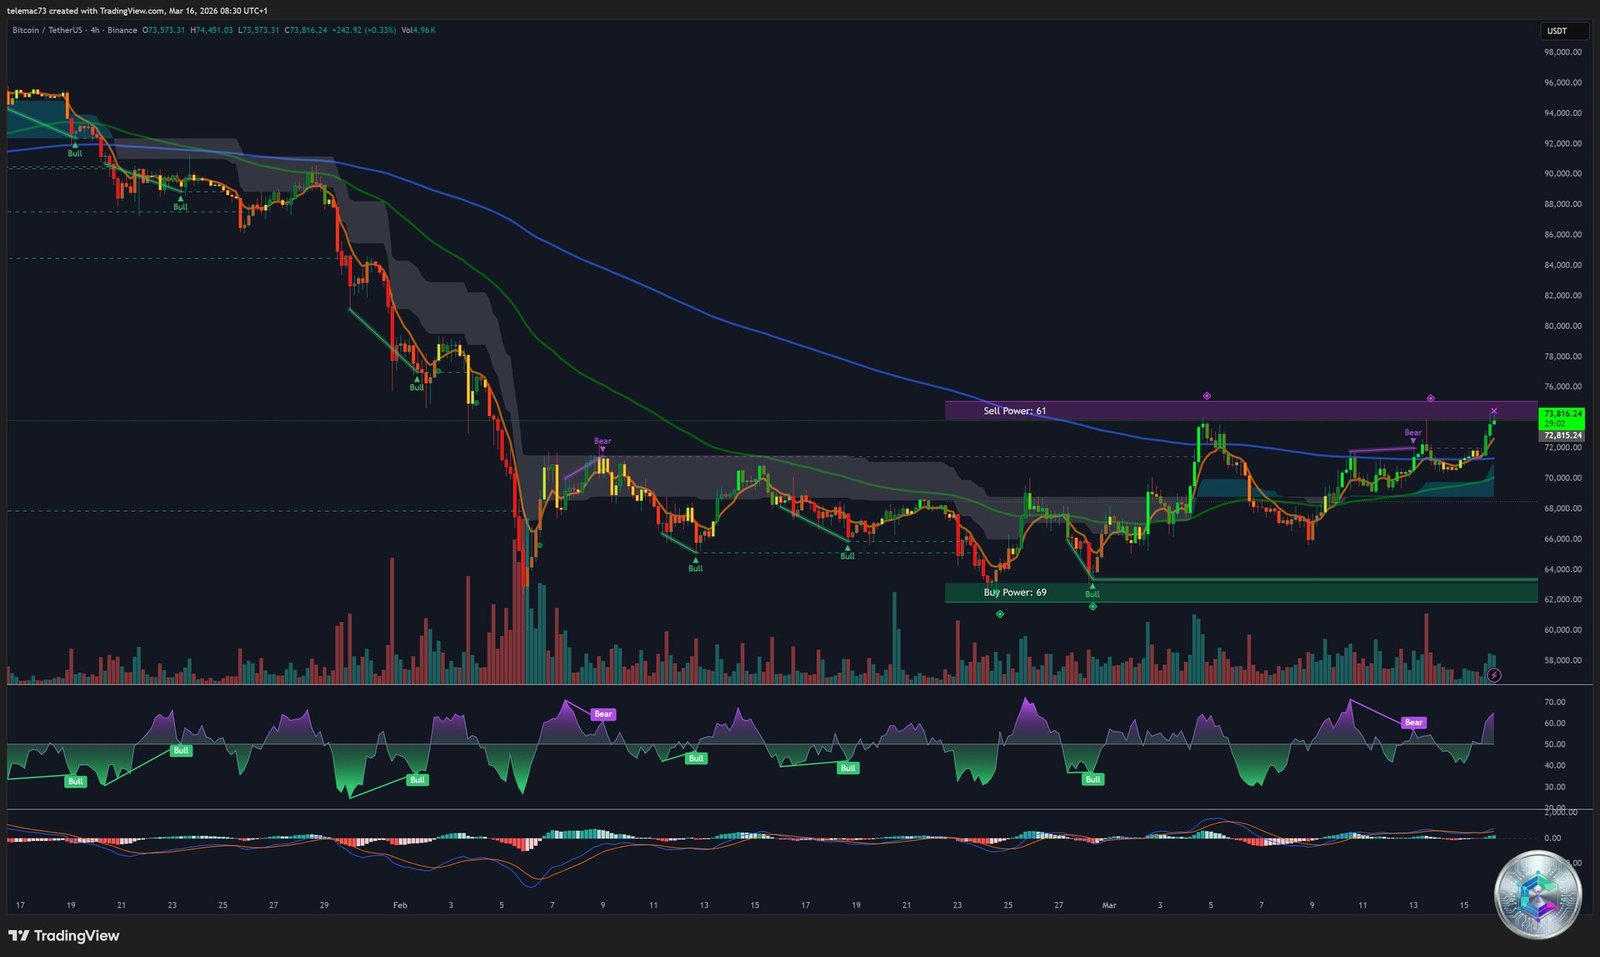
The 4H chart illustrates the anatomy of the recovery. The current candle has authoritatively broken above the upper boundary of the Ichimoku cloud (Kumo Breakout), a high-reliability tactical buy signal. The « Sell Power: 61 » zone at $73,816 is currently being gradually absorbed.
The bullish sequence is structured by repeated Bull Flag formations: violent impulse (flagpole) → orderly consolidation in a minor descending channel → breakout to the upside for a new leg higher. This mechanic reflects organic, healthy appreciation — no panic buying.
⚠️ An invalidation of the support trendline would trigger a tactical pullback toward the top of the Ichimoku cloud, now acting as support ($69,000–$70,000).
15-Minute Chart (15m): Liquidity Hunting
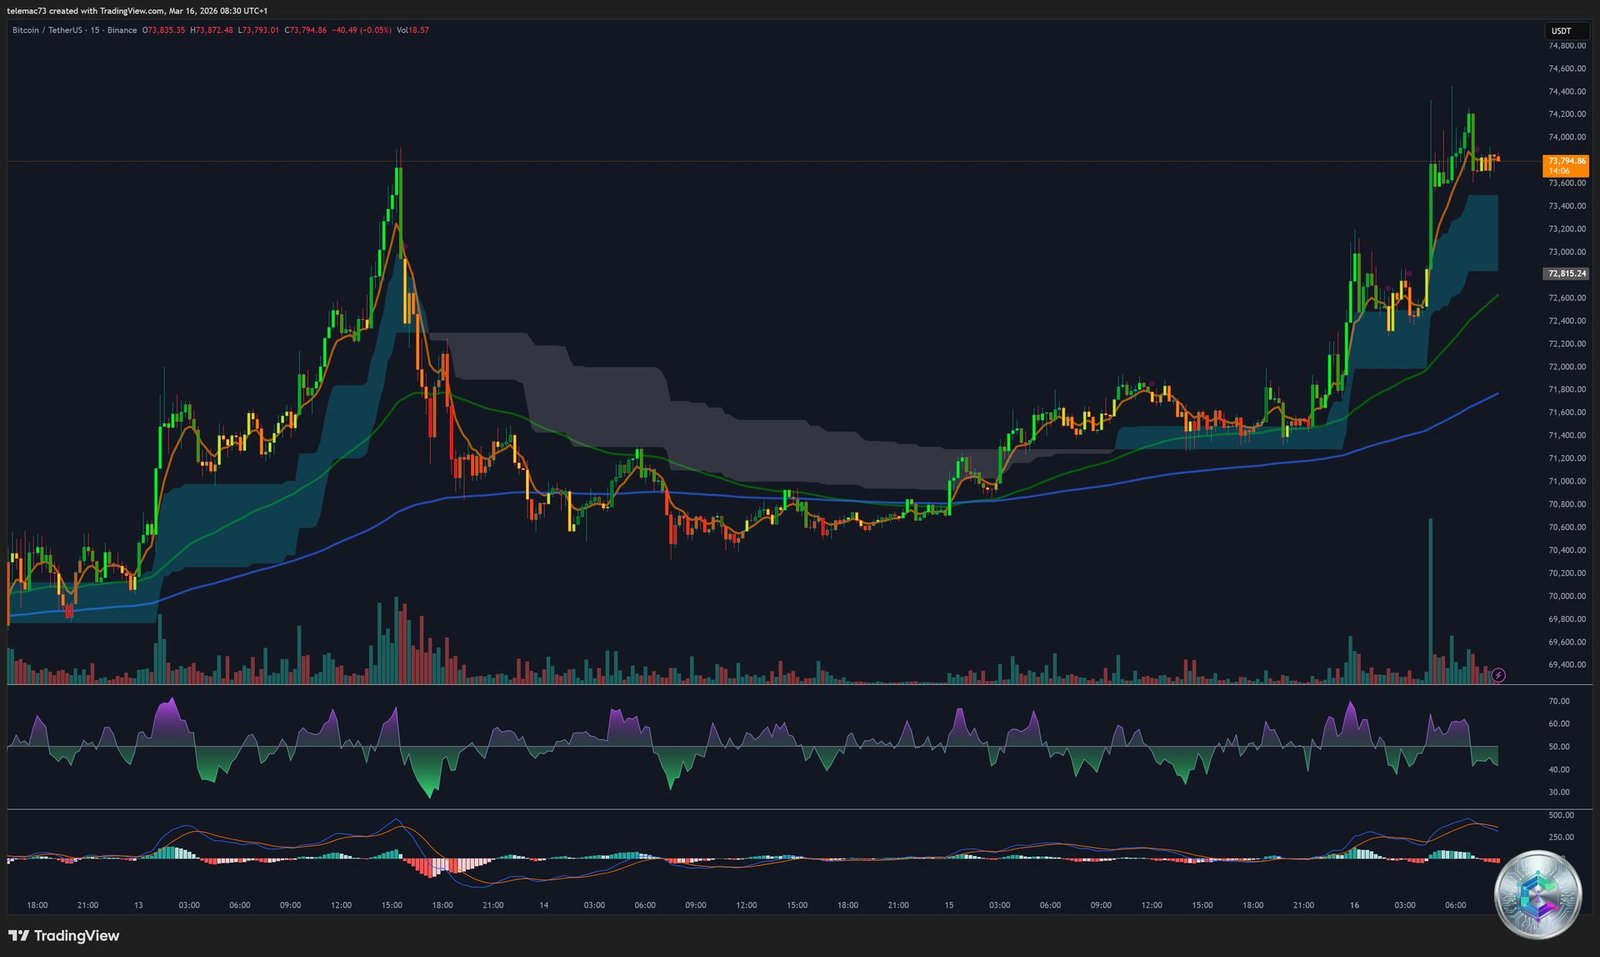
The 15-minute timeframe reveals an electrified market operating in a very high intraday volatility regime. The intraday peak at $73,794 followed by a rejection with a long upper wick illustrates a classic liquidity sweep: market makers briefly push price above obvious resistances to trigger short stop-losses and trap late breakout buyers, before violently reverting toward the mean.
The 15m oscillators (MACD short-term Death Cross, RSI in descending slope after overbought) signal temporary mechanical exhaustion. The market needs to reset these ultra-fast oscillators before mounting a new assault on the $74,000 level.
📐 Quantitative Dashboards
Daily Pivot Levels (Session: March 16, 2026)
| Methodology | S2 | S1 | Pivot | R1 | R2 | R3 |
|---|---|---|---|---|---|---|
| Standard (Classic) | $71,708 | $72,650 | $73,411 | $74,353 | $75,114 | $76,056 |
| Fibonacci | $72,358 | $72,760 | $73,411 | $74,062 | $74,464 | $75,114 |
| Camarilla | $73,279 | $73,436 | $73,411 | $73,748 | $73,904 | $74,060 |
| Woodie | $71,753 | $72,740 | $73,456 | $74,444 | $75,160 | $76,147 |
| DeMark | — | $73,030 | $73,601 | $74,734 | — | — |
The strong convergence around $73,400 (Classic Pivot) confirms the solid anchoring of the current valuation. The Classic R1 at $74,353 aligns precisely with the ascending triangle’s demarcation line and the Sell Wall identified on the Heatmap — the key level to watch.
🎯 Strategic Synthesis: Two Scenarios
✅ Primary Scenario: Bullish Breakout (Dominant Probability)
All technical signals support the completion of the ascending triangle. The $49.3B OI concentration and liquidation mapping indicate that short squeeze fuel is massed just above $74,500.
A confirmed daily (and 4H) close above this line will trigger a chain reaction of forced buying, projecting the asset toward:
- 🎯 Intermediate target: $80,700
- 🎯 Extended target: $85,000 and beyond
⚠️ Recessionary Scenario: Invalidation & Mean Reversion
A suddenly hyper-aggressive Fed stance (oil at $120, uncontrollable inflation) could act as a black swan event. If the market fails to absorb the Sell Wall at $74,000 and closes below the EMA 50 (~$71,400), deleveraging would target:
- ⬇️ Test of the institutional accumulation zone: $60,600–$64,000
Conclusion: The decision matrix calls for capital preservation until an unequivocal confirmation of the breakout direction, while strongly weighting probabilities in favor of bullish continuation — driven by the asymmetry of institutional liquidity flows and the ascending market structure.
⚠️ Disclaimer: This article is written exclusively for educational and informational purposes. It does not constitute investment advice or a recommendation to buy or sell any asset whatsoever. Cryptocurrency markets are highly volatile and carry a risk of total capital loss. Please consult a professional financial advisor before making any investment decision.