
Introduction: A Market at the Crossroads
In March 2026, the global financial ecosystem is navigating a period of exceptional turbulence, redefining historical correlations between traditional and emerging asset classes. Bitcoin (BTC), the benchmark cryptographic asset, sits at the epicenter of this redefinition. Pulled between a now-mature institutional adoption through standardized investment vehicles (ETFs) and a global macroeconomic environment marked by inflationary resurgences and geopolitical shocks, BTC’s behavior demands an unprecedented analytical framework.
The market has recently navigated through significant swings: a major pullback from annual highs beyond $90,000 reached in January 2026, down to a local low near $60,000, before entering a tactical consolidation phase around the psychological pivot of $70,000. This report offers a systemic dissection of all valuation vectors to derive probabilistic directional perspectives on the BTC/USD exchange rate.
⚠️ Macroeconomic Context: Latent Stagflation and Geopolitical Risk Premium
Middle East Tensions and the Energy Shock
The macroeconomic architecture of March 2026 is unequivocally dominated by escalating geopolitical tensions in the Middle East. The direct involvement of the United States, Israel, and Iran in a cycle of reprisals has rekindled fears of a systemic disruption to global energy supply chains. The Strait of Hormuz — through which approximately one-fifth of global oil trade flows — has crystallized the anxiety of market operators.
As a direct consequence, hydrocarbon markets experienced heightened volatility: WTI crude oscillated between $83 and $88, while Brent dangerously approached the $93 threshold, threatening the fragile global disinflation of prior quarters. Intense G7 deliberations and IEA proposals to release up to 182 million barrels from strategic petroleum reserves temporarily eased fears, acting as a short-term bullish catalyst for risk assets including Bitcoin.
The U.S. Labor Market: The « Higher for Longer » Paradox
Data released on March 12, 2026, on weekly jobless claims showed 213,000 new filings, below the consensus forecast of 215,000. This stubborn labor market resilience severely limits the Federal Reserve’s room to justify preemptive rate cuts, extending the « higher for longer » narrative.
However, persistent rumors around dovish candidates for the Fed chairmanship — particularly Kevin Hassett — maintain an asymmetry of forward expectations in markets. Portfolio managers are betting on significantly looser monetary policy by end-2026, justifying a gradual repositioning toward high-convexity assets, of which Bitcoin is currently the most asymmetric representative.
Bitcoin’s Behavioral Mutation: From Safe Haven to Risk-On Asset
A crucial observation of early 2026: the Bitcoin-as-« digital gold » narrative — decoupled in times of crisis — has been severely stress-tested. During the recent Middle East strikes, BTC suffered liquidation waves in perfect tandem with global equities, rather than appreciating as a traditional safe haven. Global macro hedge funds (HFRI Macro Index) posted +3.02% in February 2026, while the crypto benchmark index recorded a severe decline of -10.64% over the same stress period.
🔗 Network Fundamentals: The 20 Millionth Unit and Programmed Scarcity
Early March 2026 witnessed a historic milestone: the mining of the 20 millionth Bitcoin unit, occurring around block 940,000. This event cryptographically certifies that 95% of the total supply defined by Satoshi Nakamoto’s original protocol is now in active or dormant circulation. Only one million bitcoins remain to be issued — a task that will unfold over the next 114 years at the current minting pace of approximately ~450 new BTC per day.
This asymptotic scarcity places Bitcoin in a condition of total supply inelasticity relative to demand fluctuations — a characteristic that neither fiat currencies nor physical gold can claim. The dynamic difficulty adjustment mechanism ensures the block discovery time remains locked at ten minutes, regardless of global hashrate deployed.
In this context, Bitwise’s quantitative models suggest that for Bitcoin to reach a valuation of $1 million per BTC, it would only need to capture approximately 17% of the global store-of-value market (currently dominated by physical gold at ~$36 trillion), without requiring a full demonetization of gold.
🏦 Institutional Microstructure: The Reign of Spot ETFs
Market microstructure dynamics are now predominantly dictated by flows through U.S. Spot Bitcoin ETFs. After a consolidation period in late 2025, early 2026 saw a remarkable resurgence of institutional interest, with more than $1.5 billion in net inflows at their peak — including single-day subscription sessions exceeding $825 million. In March alone, funds captured over $735 million in fresh capital.
However, extreme instability characterizes these flows. In the 48 hours preceding this report, massive outflows exceeding $1 billion were recorded, fueled by unverified rumors of an imminent liquidation of Bitcoin reserves by the Venezuelan government — quickly invalidated by on-chain forensic analysis, but sufficient to trigger massive algorithmic redemptions. This episode vividly illustrates the extreme sensitivity of institutional capital to any narrative suggesting a « supply overhang. »
📊 On-Chain Analysis: MVRV, Realized Price, and Consensus Zones
On-chain metrics analysis (via Glassnode) reveals a particularly complex psychological market structure:
- Negative MVRV ratio for recent ETF holders: The average investor who entered recently is sitting at an unrealized loss. This configuration resembles conditions of creeping capitulation for « late entrants, » providing the fuel necessary for a leverage flush before a sustainable uptrend can resume.
- Realized Price (~$54,900): The volume-weighted average cost basis of all circulating supply. This represents the absolute fundamental support floor — the zone where « smart money » would intervene massively in any macroeconomic black swan event.
- True Market Mean (~$79,000): This quantitative model, which statistically isolates lost or multi-cycle dormant coins, materializes the primary macroeconomic resistance — the true structural glass ceiling to break for price discovery to resume.
The market is objectively trapped between an unshakeable fundamental valuation at $54,900 and a formidable on-chain resistance at $79,000, mathematically justifying the interminable consolidation phase observed around the gravitational axis of $70,000.
📈 Multi-Timeframe Chart Analysis
Daily View (1D): Ascending Triangle and Structural Resilience
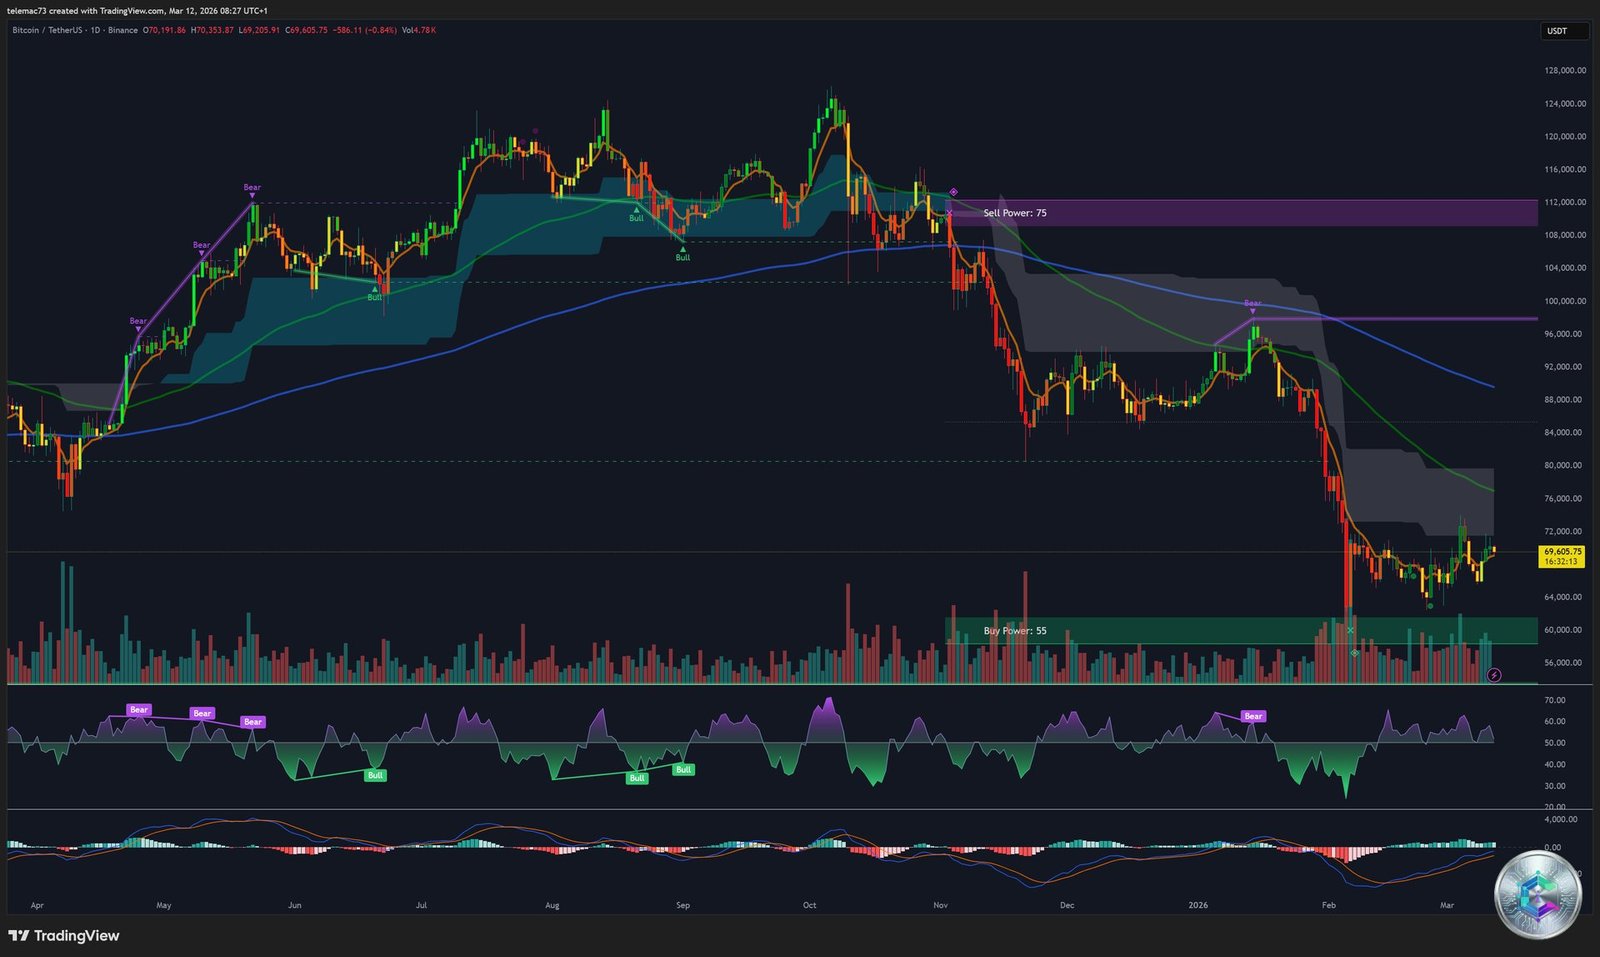
The daily chart reveals a Bitcoin demonstrating a defensive structure, yet one marked by remarkable resilience. After a drastic correction from highs near $74,000 toward the critical support of $60,000, price initiated a robust technical rebound of approximately 16% to reclaim the $70,000 threshold.
Price action is progressively drawing the contours of an ascending triangle, characterized by a clear horizontal resistance line in the $72,000–$74,000 zone contrasted against a series of higher lows — testament to aggressive, systematic accumulation. Chart theory attributes this pattern a statistically superior probability of bullish resolution.
Regarding indicators: the 50 EMA acts as dynamic support, confirming medium-term bullish bias. The 200 EMA serves as the deep safety net, confirming the secular bull regime. The MACD bears the scars of a « Death Cross » from the initial selloff, but the histogram shows a progressive drying up of selling pressure. The RSI oscillator has recovered from extreme oversold territory (~30) back to neutral ground.
4-Hour View (H4): Bear Flag vs. Structural Reversal
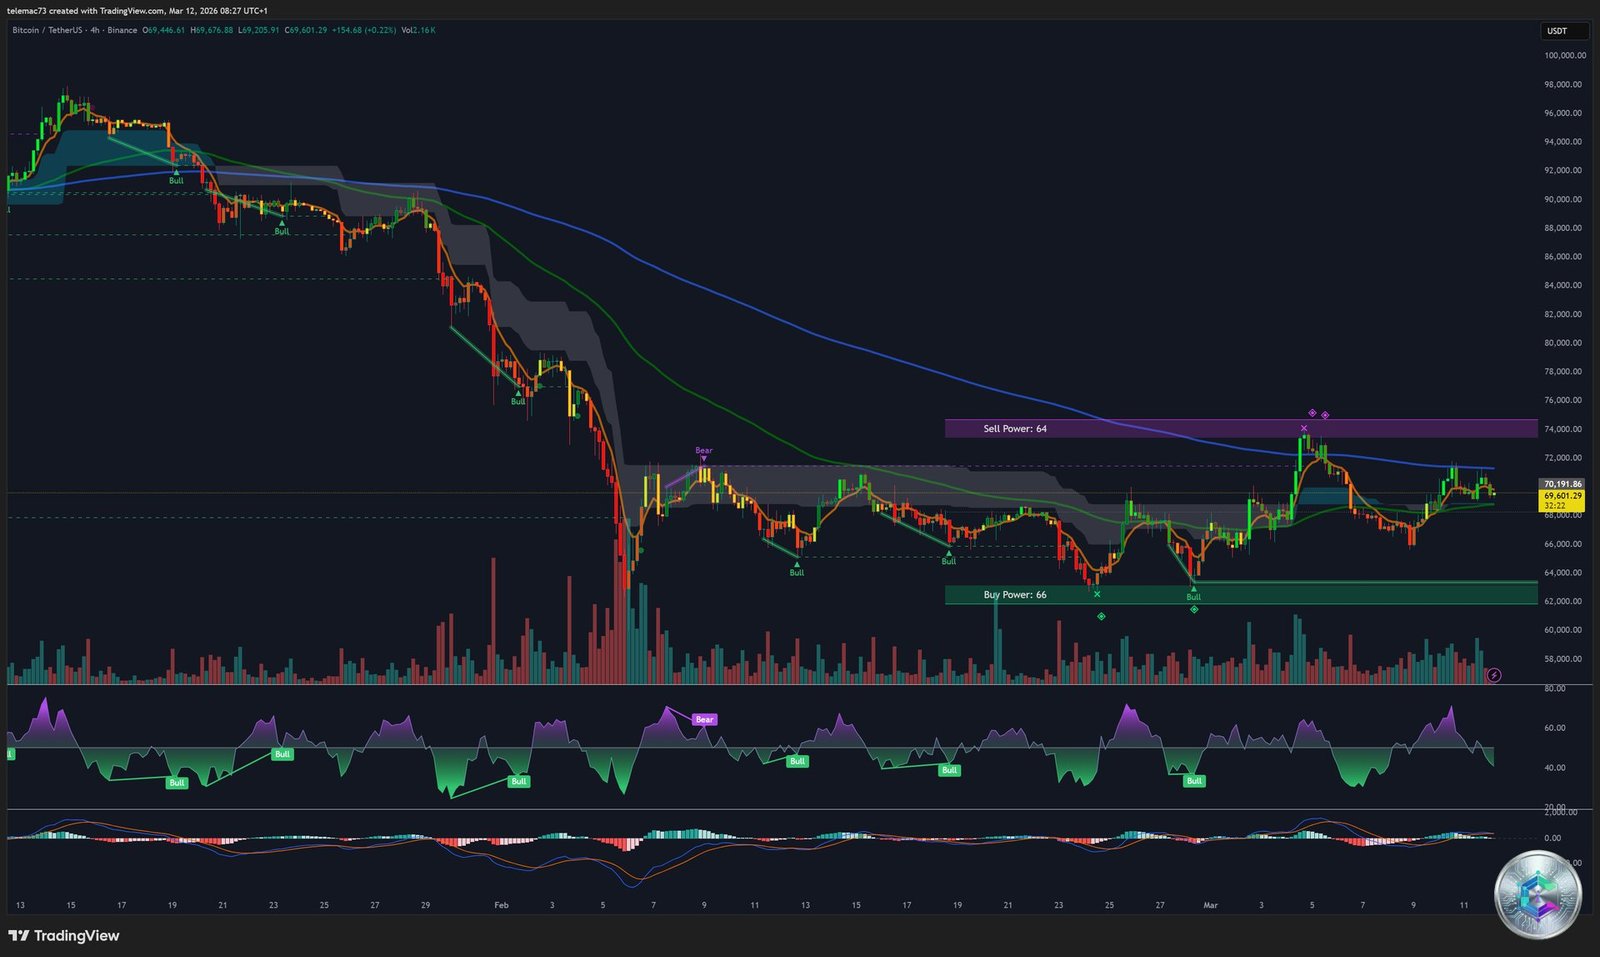
On the 4-hour chart, the moderately ascending channel formed during the recovery toward $70,000 takes on the classic technical morphology of a Bear Flag. If this pattern were validated by a decisive downside break, theoretical projections would extend below $55,000.
However, Bitcoin’s remarkable ability to stubbornly hold above $70,000, invalidating a « Triple Top » pattern identified at $68,077, tempers this pessimism. A « Sell Power » zone quantified at $74,000 and a « Buy Power » zone at $62,000 define the arena within which algorithms are currently operating.
15-Minute View (M15): Microstructure and Algorithmic Momentum
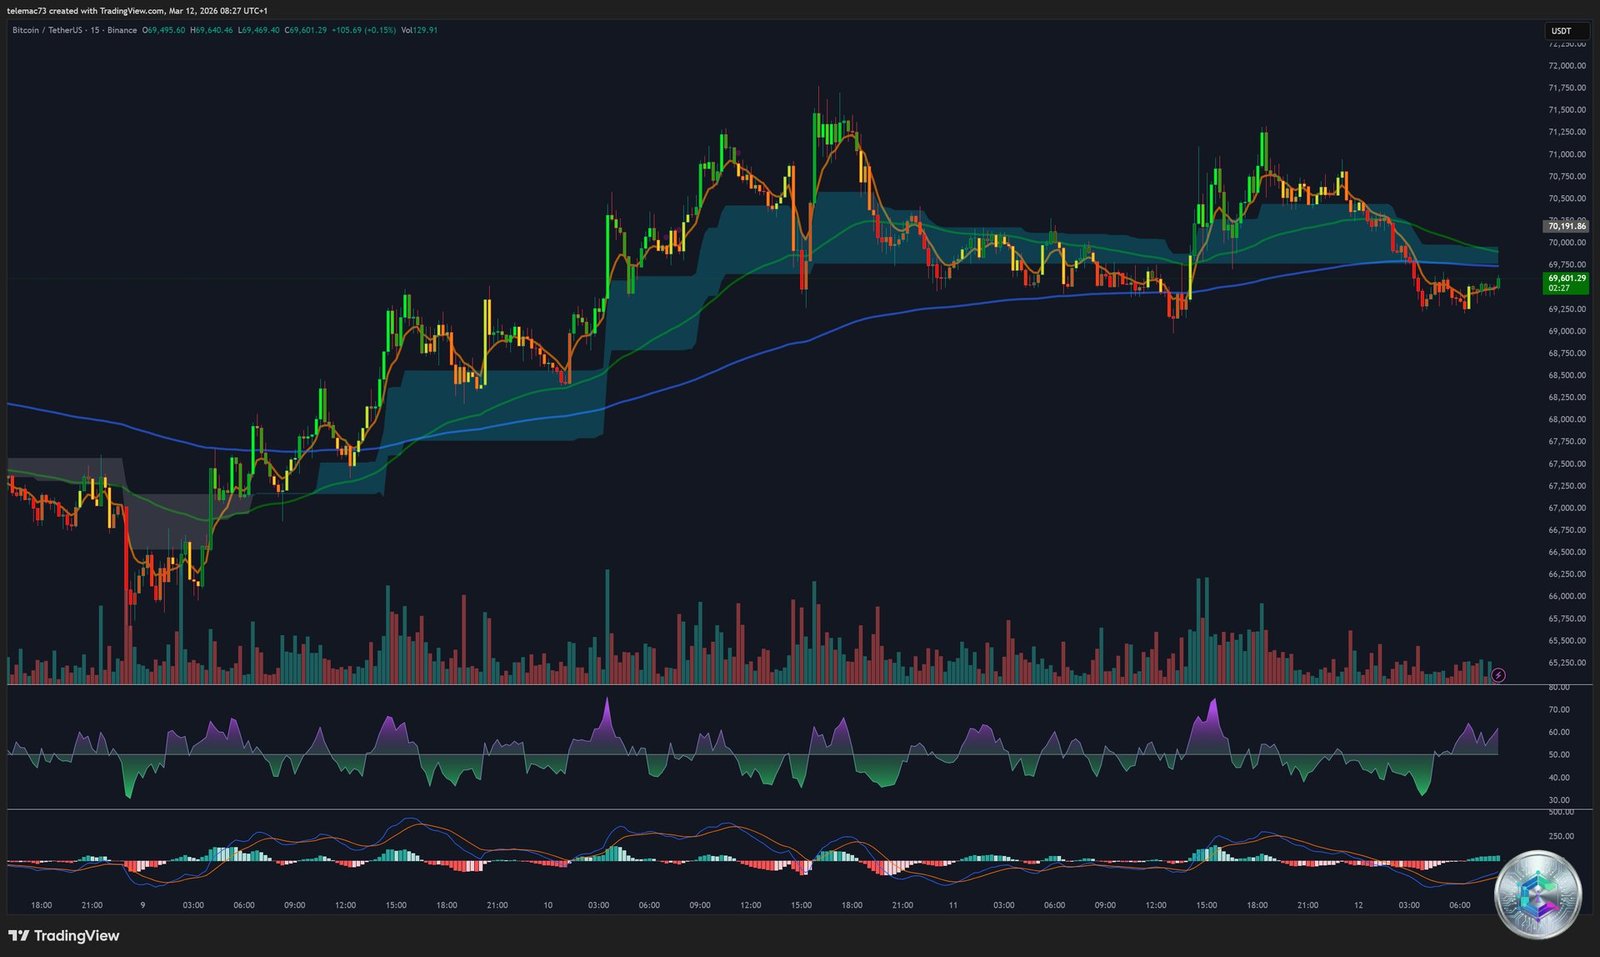
On ultra-short timeframes, price action becomes inherently erratic but remains an open book on liquidity microstructure. The 14-period RSI plunged toward an extreme oversold reading of 16 — signaling total capitulation at the intraday scale — before vigorously rebounding to stabilize around 51, the mathematical definition of a perfect balance between buying and selling pressure. The Supertrend indicator recently flipped from red to green, offering a mechanical entry signal for short-term trend-following strategies. The MACD is cycling through rapid Golden Cross / Death Cross sequences, symptomatic of a « choppy » market oscillating without conviction between $69,000 and $71,000.
Heatmap and Volume Profile: Hidden Oceans of Liquidity
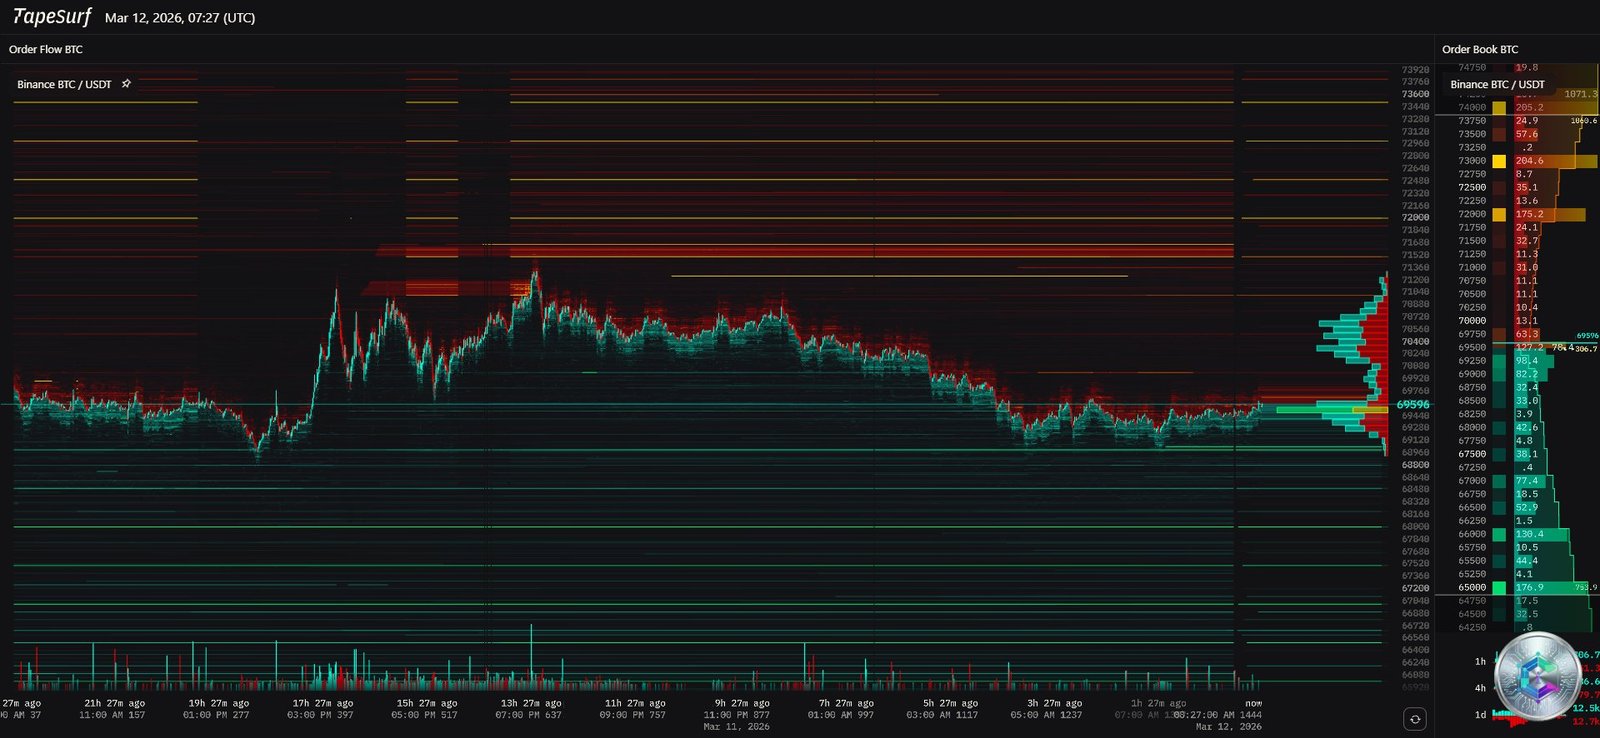
The Liquidity Heatmap (visualization of limit order book depth from platforms like TapeSurf) reveals the hidden intentions of dominant market participants:
- Ask Wall (Supply): An overwhelming density of institutional sell limit orders obstructs the path overhead between $72,000 and $74,100. This is the fundamental barrier preventing Bitcoin from initiating a new parabolic price discovery phase.
- Bid Wall (Demand): Thick layers of buy-side liquidity are stacked in descending steps below $64,000 down to $60,000 — natural algorithmic targets for engineering long squeeze cascades.
- Point of Control (POC) — VPVR: The price level with the highest traded volume over the displayed period forms a massive volume node in the $69,000–$70,000 zone, explaining why price remains anchored in this fair value area accepted by both camps.
🎯 Key Operational Levels: Summary Table
| Level | Price (USD) | Significance |
|---|---|---|
| Major Resistance (R3) | $74,700 – $75,000 | Institutional Take-Profit / Parabolic Bull Run trigger |
| Fibonacci Resistance (R2) | $74,100 | Critical Fibonacci retracement / Major seller absorption (Heatmap) |
| Local Resistance (R1) | $70,800 – $72,000 | Immediate glass ceiling / Start of supply wall |
| Pivot Point (PP) | $70,612 | Reference equilibrium / Intraday momentum pivot |
| Fair Value Zone | $70,000 – $70,100 | Accumulation hub / Neutral battleground |
| Minor Support (S1) | $68,800 | Neckline / First line of defense of high consolidation |
| Intermediate Support (S2) | $65,600 – $66,587 | Geometric target in bearish H&S pattern validation |
| Invalidation / Stop-Loss (S3) | $64,000 | Formal invalidation of long scenarios / Dense liquidity zone |
| Macroeconomic Floor | $59,500 – $60,100 | « Black Tuesday » panic low / Last resort before trend collapse |
🔮 Prospective Scenarios: Two Probabilistic Outcomes
Scenario Alpha 🟢 — Bullish Breakout Resolution
Required triggers: Geopolitical de-escalation in the Middle East, U.S. inflation data (CPI/PCE) meaningfully below consensus, a surprise deterioration in job openings (JOLTS). These elements would cement a dovish Fed pivot narrative, driving the 10-year Treasury yield and DXY lower in tandem.
Market mechanics: Reassured wealth managers would trigger massive ETF buy orders, with net inflows turning sustainably positive and absorbing floating supply. The Supertrend indicator, already green on short timeframes, would accelerate across higher timeframes, creating an institutional FOMO momentum spiral.
Expected price action: A confirmed daily close above $72,000 on expanding volume would act as a spark, triggering a violent short squeeze propelling the asset through R2 ($74,100) toward the quantitative trading model target of $74,700–$75,000, then onto a confrontation with the on-chain True Market Mean at $79,000. Protective stop-loss: below $64,000.
Scenario Beta 🔴 — Bearish Breakdown and Cascade Capitulation
Required triggers: A re-escalation of oil hostilities driving Brent above the $100 threshold, a stubbornly high Core CPI print, and a rigid labor market — forcing investment committees to definitively remove any probability of monetary easing from their 2026 models.
Market mechanics: A return of visceral fear, amplified by new unfounded rumors of sovereign liquidations (similar to the Venezuela FUD), would trigger relentless ETF outflows. Recent holders, watching their investment erode, would capitulate. The MVRV ratio would deteriorate into historical negative territory, and a Death Cross between the 50 and 200 EMA on the daily chart would formally confirm entry into Crypto Winter.
Expected price action: A decisive close below S1 at $68,800 would trigger a chain reaction of cascade liquidations toward $65,600, then $64,000, before testing the « Black Tuesday » psychological floor at $60,000. Should that level fail, the on-chain Realized Price at $54,900 represents the ultimate valuation sanctuary. Short take-profit target: $64,000. Stop-loss: above $74,700.
Conclusion: The Discipline of Waiting for Confirmation
The state of multivariate Bitcoin analysis in Q1 2026 paints a portrait of a financial asset in deep ontological transition. It navigates spectacularly — but perilously — between the mathematical fulfillment of its original digital gold vocation, propelled by an emission calendar that has now inscribed over 95% of its final supply into the blockchain’s immutable ledger, and the implacable pragmatic reality of its status as a hyper-institutionalized financial product, enslaved to ETF flows and the disciplinary rigors of global central bank monetary policy.
The critical $70,000 pivot currently represents the main front line of a financial war of attrition. Any significant capital deployment, in the absence of a clear directional signal, requires disciplined probabilistic risk management — awaiting a confirmed threshold breakout and resisting the siren call of the destructive noise generated by the ongoing consolidation.
⚠️ Disclaimer: This article is written for exclusively educational and informational purposes. It does not constitute investment advice, a recommendation to buy or sell, or an inducement to invest in digital assets or any other financial instrument. Cryptocurrency markets are highly volatile and carry a risk of capital loss. Please consult a licensed financial advisor before making any investment decisions.