


As of September 6, 2026, Bitcoin is pausing beneath a major resistance zone after a spectacular rally that began in late August. Price is oscillating between $79,400 and $80,200, capped by an institutional sell wall, while markets weigh the Federal Reserve’s next move. Combining multi-timeframe technical structure, order-book liquidity mapping and spot ETF flows, here’s a full read on what’s driving BTC/USDT right now.
Daily Overview: A Confirmed Trend Reversal
The daily chart shows a structural reversal following several quarters of bear-market conditions since the all-time high near $126,000. Through summer 2026, Bitcoin built an institutional accumulation floor between $57,000 and $60,000, steadily absorbing supply before breaking out directionally.
A clean break above the 50-day EMA ($70,693) and 200-day EMA ($72,419) restored a bullish moving-average alignment, with price now trading more than 12% above its 200-day average. This sets up a Golden Cross between fast and slow moving averages, confirming the regime shift. The advance, however, stalled sharply under the $81,000–$82,800 resistance band, which combines the 50-week moving average ($81,000) with the average cost basis of U.S. spot ETF holders ($82,500). Clearing that level would mark the shift from a technical bounce to a genuine new expansion cycle.
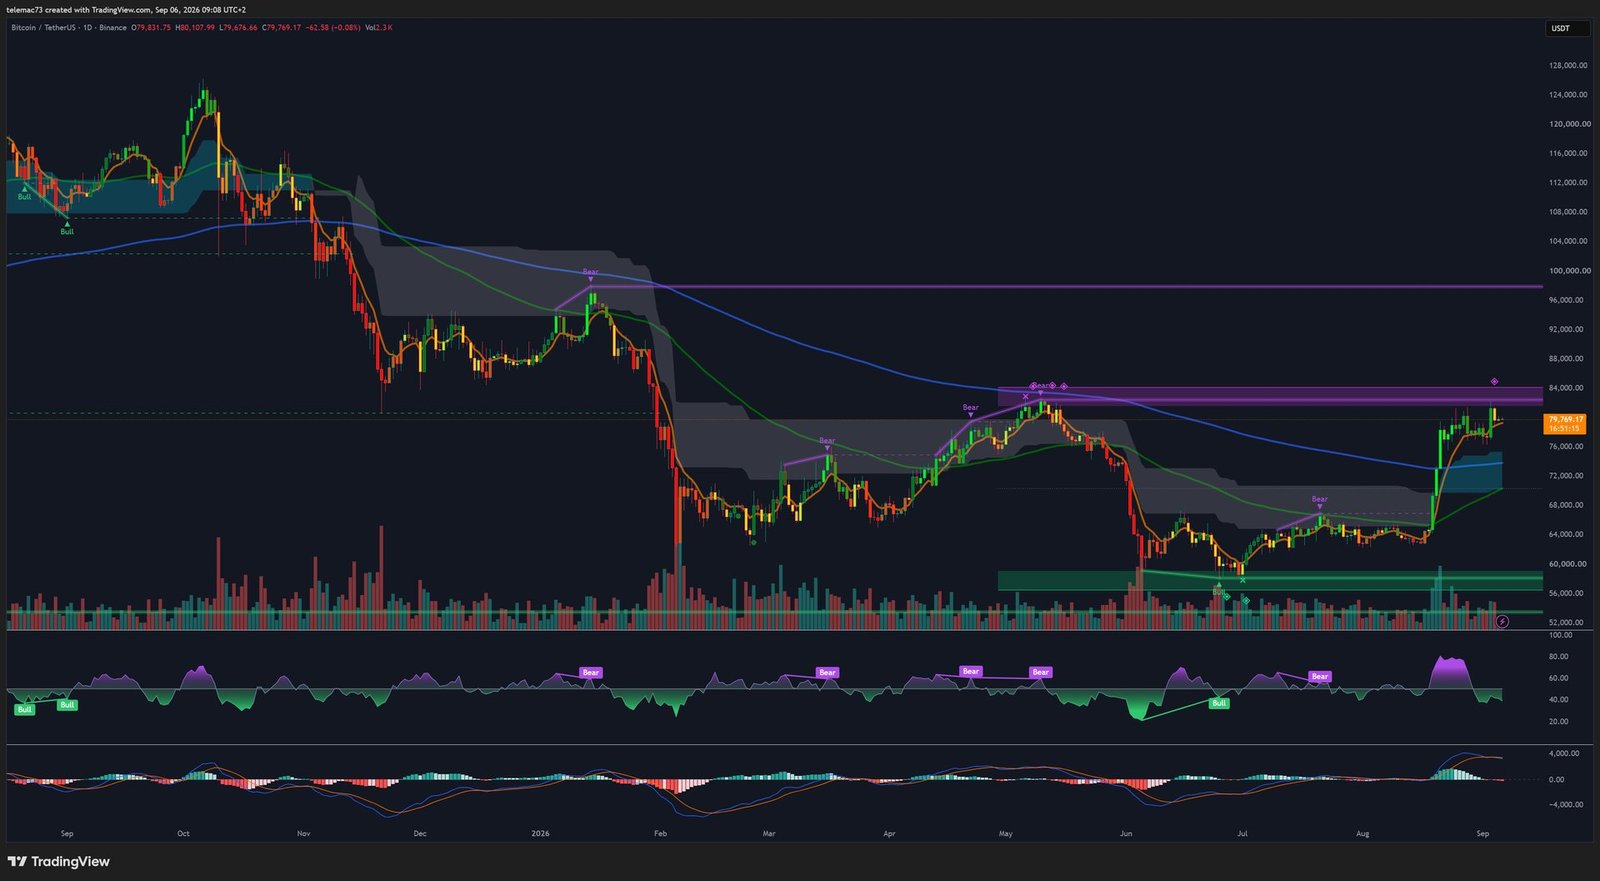
| Indicator (1D) | Observed value | Interpretation |
|---|---|---|
| Spot price | ~$79,630 – $79,800 | Consolidating under the $80,000 pivot |
| RSI (14) | 72.87 (recent peak 80–82) | Working off overbought via sideways drift |
| MACD (12,26,9) | Line 3,492 / Signal 3,480 | Histogram at +12, bullish momentum intact |
| 20-Day EMA | $75,260 | First major dynamic support |
| 50-Day EMA | $70,693 | Intermediate support confirming uptrend |
| 200-Day EMA | $72,419 | Bull/bear regime demarcation line |
The daily RSI spiked to 80–82 during the test of $82,000 — its highest reading of the year — and has since eased back to 72.87 while price holds above $79,000, pointing to orderly supply absorption rather than aggressive distribution.
4-Hour Chart: Compression Inside a Bull Flag
The 4-hour timeframe shows classic post-impulse consolidation after the vertical move from $68,000 to $82,281. The pattern is a textbook bull flag: swing lows keep climbing, with every pullback met by recurring buy flow. A leverage flush briefly dragged price to $77,000 before a long lower wick pulled the market back above the 4H 50-EMA. The intermediate bias stays bullish as long as $78,500 holds on a closing basis.
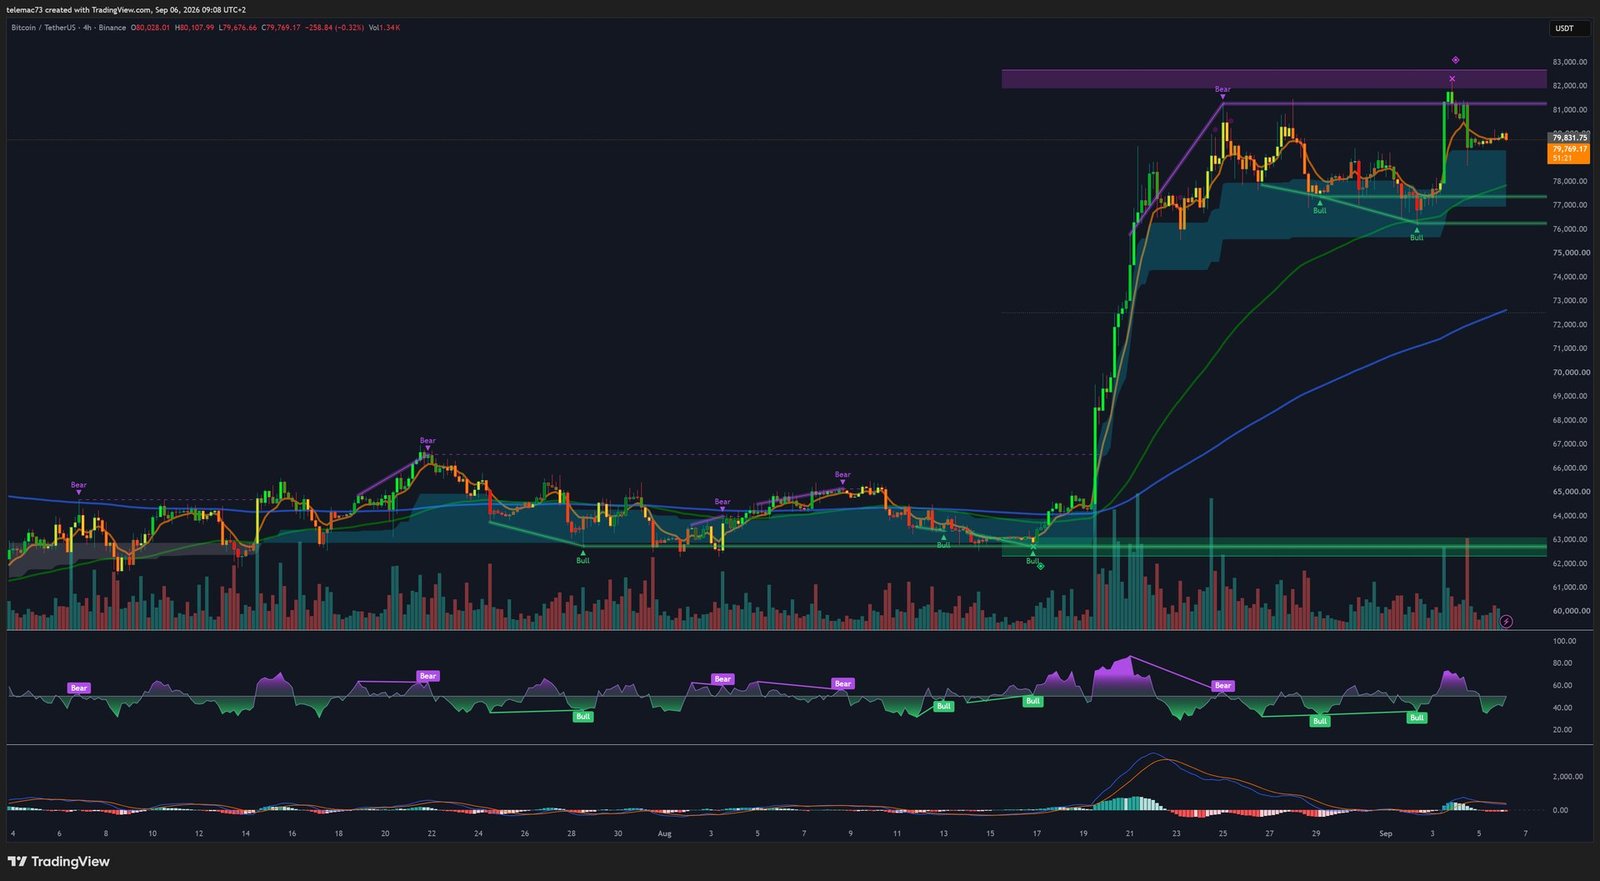
| 4H parameter | Level | Role |
|---|---|---|
| Chart pattern | Bull flag / compression wedge | Post-impulse continuation setup |
| Upper boundary | $81,500 – $82,300 | Trigger for a new bullish leg |
| Lower boundary | $77,000 – $78,500 | Structural support zone |
| 4H RSI | 55 – 60 (range 40–75) | Neutralizing intermediate overbought |
| 4H MACD | Neutral convergence | Volatility contraction before expansion |
15-Minute Chart: The Exhaustion Wick That Cleared the Market
Intraday, a sharp corrective move sliced price from $82,100 to $78,400 on a major volume spike, forming a selling-exhaustion wick that flushed out late longs and reset intraday leverage. Since then, the market has traded in a tight range around the $79,831 pivot, with fast and slow moving averages converging into a near-horizontal alignment.
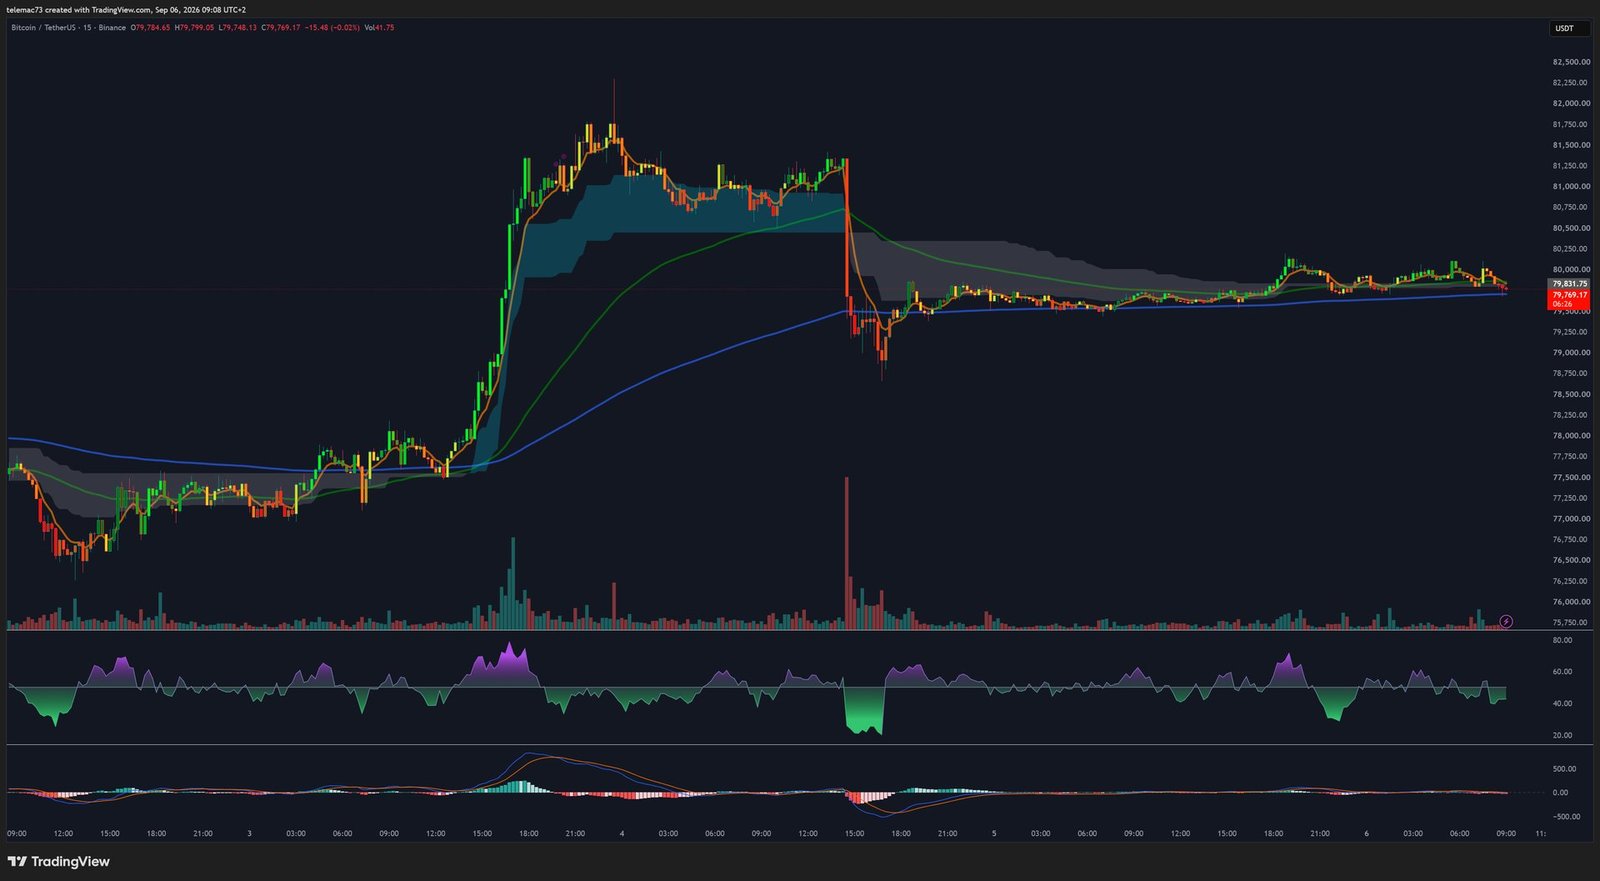
| Intraday element (15M) | Value | Implication |
|---|---|---|
| Central pivot | $79,831 | Immediate order-book equilibrium level |
| Intraday resistance | $80,250 – $80,500 | Threshold for a return to local highs |
| Intraday support | $78,400 – $79,350 | Protective floor after the capitulation wick |
| 15M RSI | 48 – 52 | Absolute neutrality after the sell flush |
| 15M MACD | Near-zero histogram | Extreme compression ahead of a volatile move |
Liquidity Map: The $82,300 Wall
The order-book heatmap (Tapesurf) confirms the chart-based read. A dense institutional sell wall sits precisely at $82,300, having repeatedly capped recent rally attempts. Beyond it, a relative liquidity void extends to $86,000, before new sell-side clusters appear near $88,000, with the book’s ultimate ceiling identified at $97,625. A validated break above $82,300 could therefore trigger an acceleration as price is pulled through thin order-book depth. On the buy side, well-defined passive bid clusters thicken between $75,000 and $78,000, confirming sustained institutional interest on every dip.
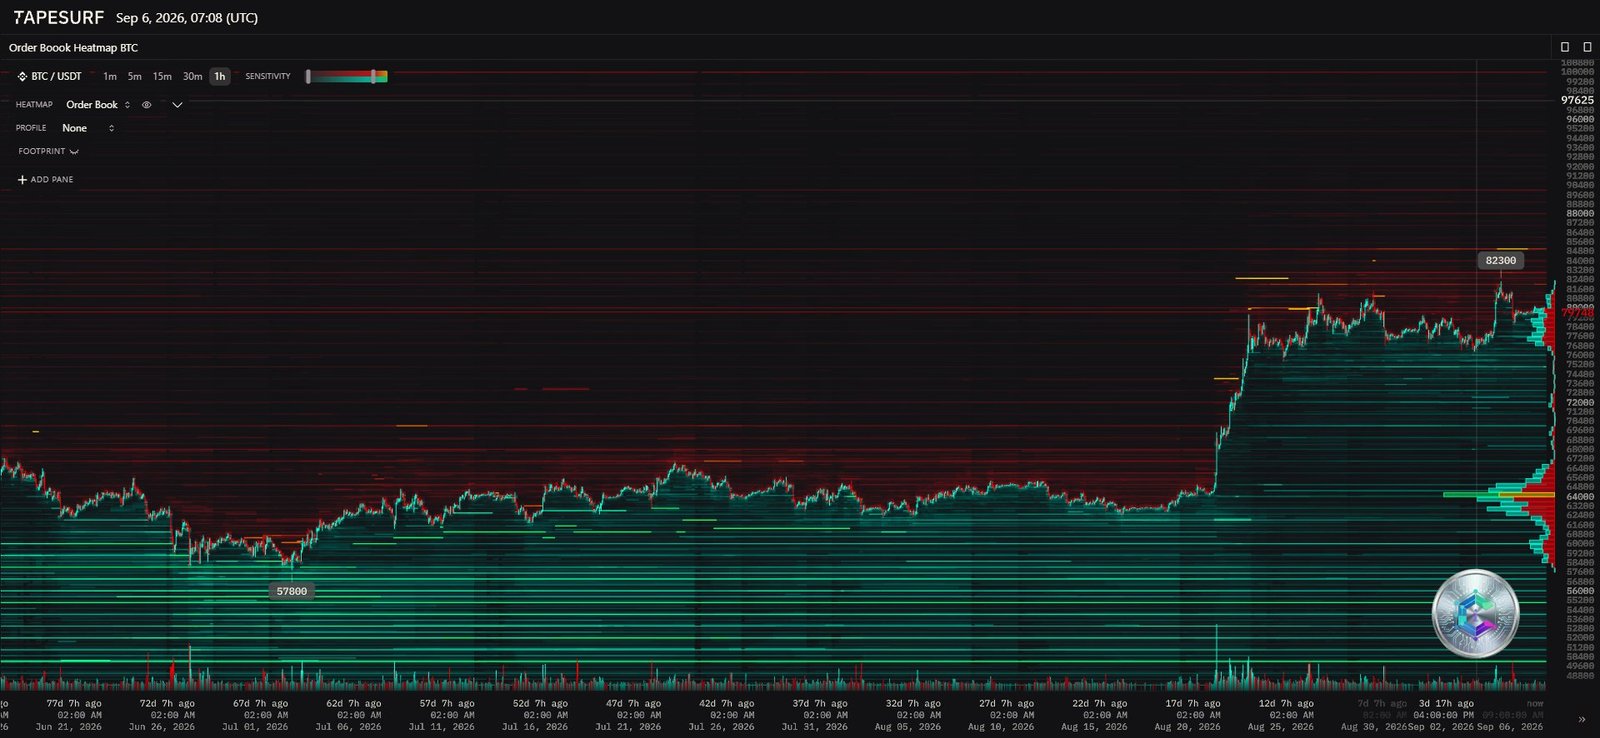
| Price zone | Cluster type | Strategic role |
|---|---|---|
| $97,625 | Macro liquidity ceiling | Ultimate long-term resistance |
| $84,000 – $88,000 | Potential short liquidations | Targets in a short-squeeze scenario |
| $82,300 | Institutional sell wall | Major absorption barrier |
| $77,000 – $78,000 | Passive buy wall | Buffer zone that absorbed the corrective wick |
| $57,000 – $60,000 | Long-term historical base | Macro accumulation foundation |
Fundamentals: ETFs, Derivatives and the Fed Factor
U.S. spot ETFs drove the summer rally, pulling in $3.8 billion in net inflows over three consecutive weeks into early September — including $731 million on September 3 alone, the largest daily inflow in eight months, led by BlackRock’s IBIT with $454 million. Cumulative assets under management for these vehicles now exceed $101 billion, roughly 6.3% of circulating supply, adding structural pressure on exchange-available float.
On the other side of the ledger, a stronger-than-expected U.S. jobs report and firm remarks from Kevin Warsh on persistent inflationary pressure have cooled rate-cut expectations ahead of the September 15–16 FOMC meeting, with markets now pricing a 52% probability of an extended pause or further tightening. On derivatives, aggregate open interest sits at $57.66 billion (+6.46% over 7 days), with a Binance long/short ratio of 0.78 (56.1% short vs. 43.9% long) — an asymmetric positioning that leaves short sellers exposed to forced liquidations on any upside break.
| Fundamental / derivatives indicator | Recent data |
|---|---|
| Weekly spot ETF flows | +$986.9M (week ending Sept. 5) |
| Cumulative net ETF assets | $101.3B (~6.32% of market cap) |
| Aggregate open interest | ~$57.66B (+6.46% / 7d) |
| Funding rate | ~10% annualized (neutral) |
| Long/Short ratio (Binance) | 0.78 (56.1% short / 43.9% long) |
| Sentiment index | 75 (“Greed” — cautious optimism) |
Two Scenarios for the Weeks Ahead
The interplay between bullish daily moving averages, 4H wedge compression and institutional spot flows sets up two possible paths forward.
Primary scenario — bullish continuation: a clean 4H close above $80,500, followed by a break through the $82,300 wall, would force a cascading liquidation of accumulated short positions and pull price through the thin-liquidity pocket above. Chart-based projections point first to $84,400, then to the $88,000–$90,000 zone. This scenario remains valid as long as $77,000 holds on a daily closing basis.
Alternative scenario — macro-driven correction: a hotter-than-expected U.S. inflation print could trigger a break of the $78,400 support, sweeping out protective stop-losses and sliding price into the $76,000–$77,000 zone, which coincides with the 20-day EMA ($75,260). A strong buy reaction there would preserve the yearly uptrend; a confirmed break below the 200-day EMA ($72,419), however, would invalidate the entire bullish structure and open the door back to $65,000.
| Scenario | Conditions | Targets | Invalidation |
|---|---|---|---|
| Bullish continuation | 4H close > $80,500 + absorption of $82,300 wall | $84,400 then $88,000–$90,000 | Daily close < $77,000 |
| Macro correction retest | Confirmed break of $78,400 | Reload zone $76,000–$77,000 | Weekly close < 200D EMA ($72,419) |
Conclusion
Bitcoin’s technical behavior as of September 6, 2026 reflects healthy consolidation within a trend that has clearly turned bullish again. The simultaneous break above the 50- and 200-day moving averages, paired with exceptional spot ETF subscription volume, has shifted market structure in buyers’ favor. The rejection under $81,500–$82,300 and the absorption wick on the 15-minute chart have purged excess leverage and pulled momentum oscillators back into a balanced zone favorable to a fresh impulsive move.
Order-book asymmetry — a precise sell wall at $82,300 alongside a predominantly short derivatives positioning — gives buyers a tactical edge should a positive catalyst emerge around mid-September’s macro data releases. Holding the $78,400 intraday support and the $76,000 medium-term base remains the key parameter for keeping probabilities tilted toward $88,000.
Disclaimer: This article is provided for informational and educational purposes only. It does not constitute investment advice, a recommendation to buy or sell, or a solicitation to trade digital assets. Cryptocurrency markets are highly volatile; always do your own research (DYOR) and consult a qualified financial advisor before making any investment decision.

