


In mid-August 2026, Bitcoin is navigating one of the most delicate phases of its current cycle. After reaching an all-time high of $126,000 in October 2025, the market’s benchmark asset now trades around $63,000, a retracement of over 50% that has brought its market capitalization down to roughly $1.26 trillion. Caught between macroeconomic pressure, institutional doubt and conflicting technical signals, the current price zone stands as a genuine crossroads for the rest of the cycle. This analysis offers a complete reading of the situation, combining the macro backdrop, on-chain data, order book microstructure and a multi-timeframe technical review.
A macroeconomic environment under heavy strain
Bitcoin’s trajectory remains closely tied to global liquidity and central bank decisions. Under the chairmanship of Kevin Warsh, the US Federal Reserve adopted a firmly restrictive stance at the June and July 2026 FOMC meetings, keeping rates unchanged and wiping out the rate-cut expectations markets had priced in. This « higher for longer » approach has drained speculative liquidity in favor of the dollar.
The macro picture nonetheless remains ambiguous: the June US jobs report disappointed, with only 57,000 jobs created versus expectations above 100,000, which temporarily softened the Fed’s tone and allowed a relief rally above $63,000. All eyes are now on the PCE inflation release scheduled for August 26, 2026, a key gauge for the future path of interest rates.
Adding to this monetary uncertainty is a major geopolitical escalation in the Middle East, with an open conflict between the United States and Iran reviving fears of disruption to maritime trade through the Strait of Hormuz. Bitcoin, theoretically designed as an uncorrelated asset, initially traded like a high-beta tech asset, falling in tandem with the Nasdaq.
The most structural shock, however, comes from within the ecosystem itself: for the first time since launching its strategy four years ago, MicroStrategy publicly acknowledged it was considering selling part of its BTC reserves, in order to bolster its dollar liquidity and support its preferred dividends. The announcement cracked the « hard floor » narrative the market had associated with the company’s systematic buying. At the same time, June 2026 recorded the worst outflows ever seen from US spot Bitcoin ETFs, roughly $4.5 billion, overwhelmingly driven by BlackRock’s IBIT fund.
Against this short-term adversity, asset managers such as Grayscale continue to defend the long-term structural thesis: deteriorating global public finances, growing blockchain adoption and shifting portfolio allocation preferences among younger generations are seen as durable drivers of institutional demand for a scarce asset like Bitcoin.
On-chain data: signs of an advanced capitulation
On-chain analysis offers a different lens than raw price action. The most telling metric right now is the share of supply held by « Short-Term Holders » (coins held for less than 155 days), which fell to 23.5% in August 2026. Historically, every time this metric has dropped below the 25% threshold, the market has formed a macro or intermediate bottom, as the most fragile speculators get flushed out in favor of conviction holders.
Current conditions bear striking similarities to the end of the 2018 and 2022 bear markets: news flow saturated with pessimism, thin trading volumes, and a consensus leaning toward lower prices. This widespread despair has historically been one of the most reliable contrarian signals for cycle-based investment strategies.
Order book X-ray: the liquidity heatmap
The order book heatmap makes it possible to visualize where demand and supply are concentrated before orders are even executed. As of mid-August 2026, this map reveals a heavily asymmetric order book, characteristic of a market in a phase of compression and patient accumulation.
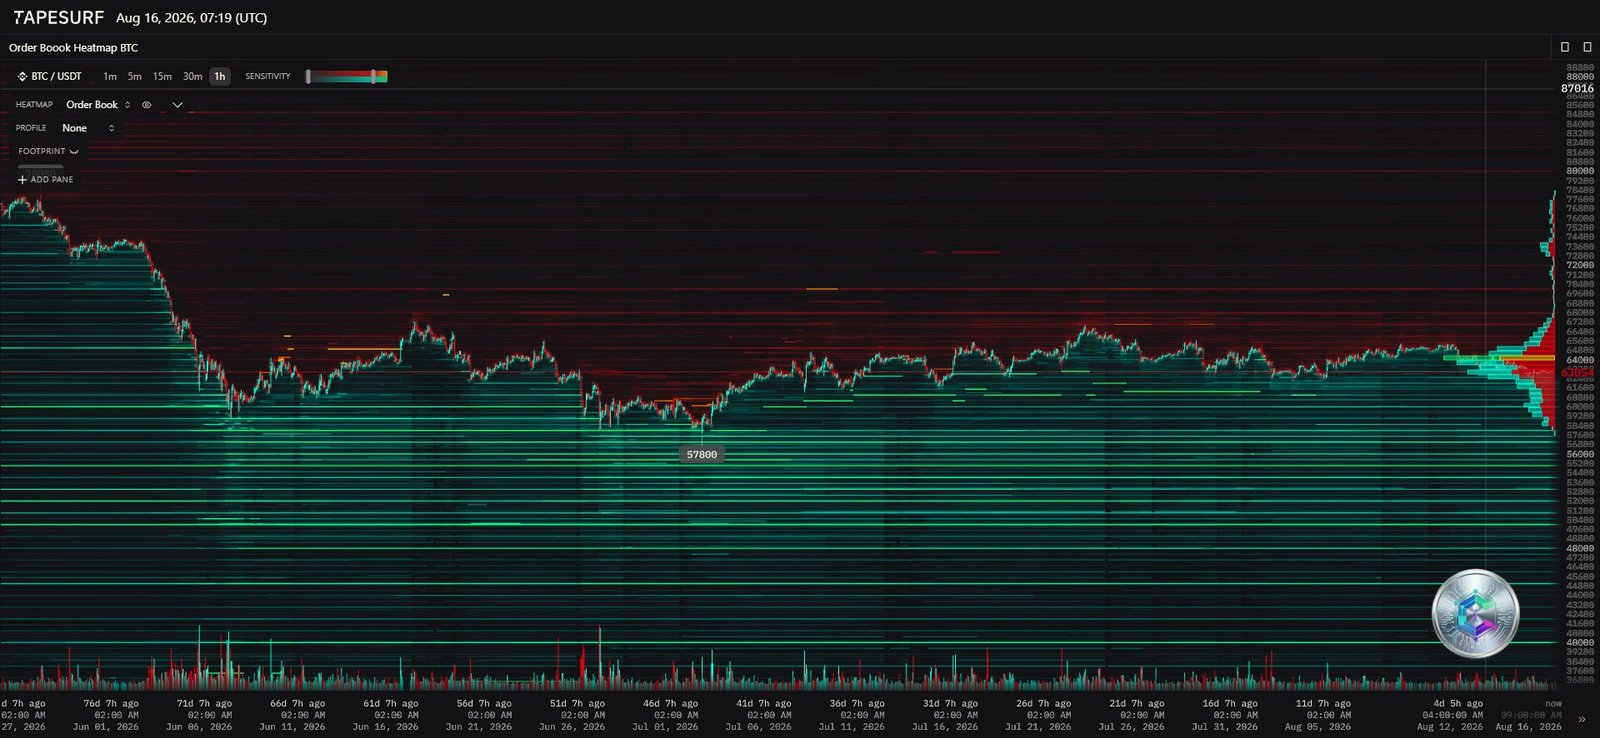
The lower half of the map is dominated by dense buy-order walls, with a particularly strong concentration around $57,800, seen by market makers and institutional players as the optimal discount zone. This density creates a genuine absorption cushion that slows the velocity of declines and turns liquidations into accumulation. An intermediate demand zone is also active between $61,800 and $63,000.
Conversely, the upper part of the book paints a suffocating distribution picture: sell orders stack up massively as price approaches $65,000, with resistance intensifying all the way to the $67,000 region. This latent supply explains the systematic rejections seen during recent relief rallies.
Multi-timeframe technical review
Daily chart: macro-structural fragility
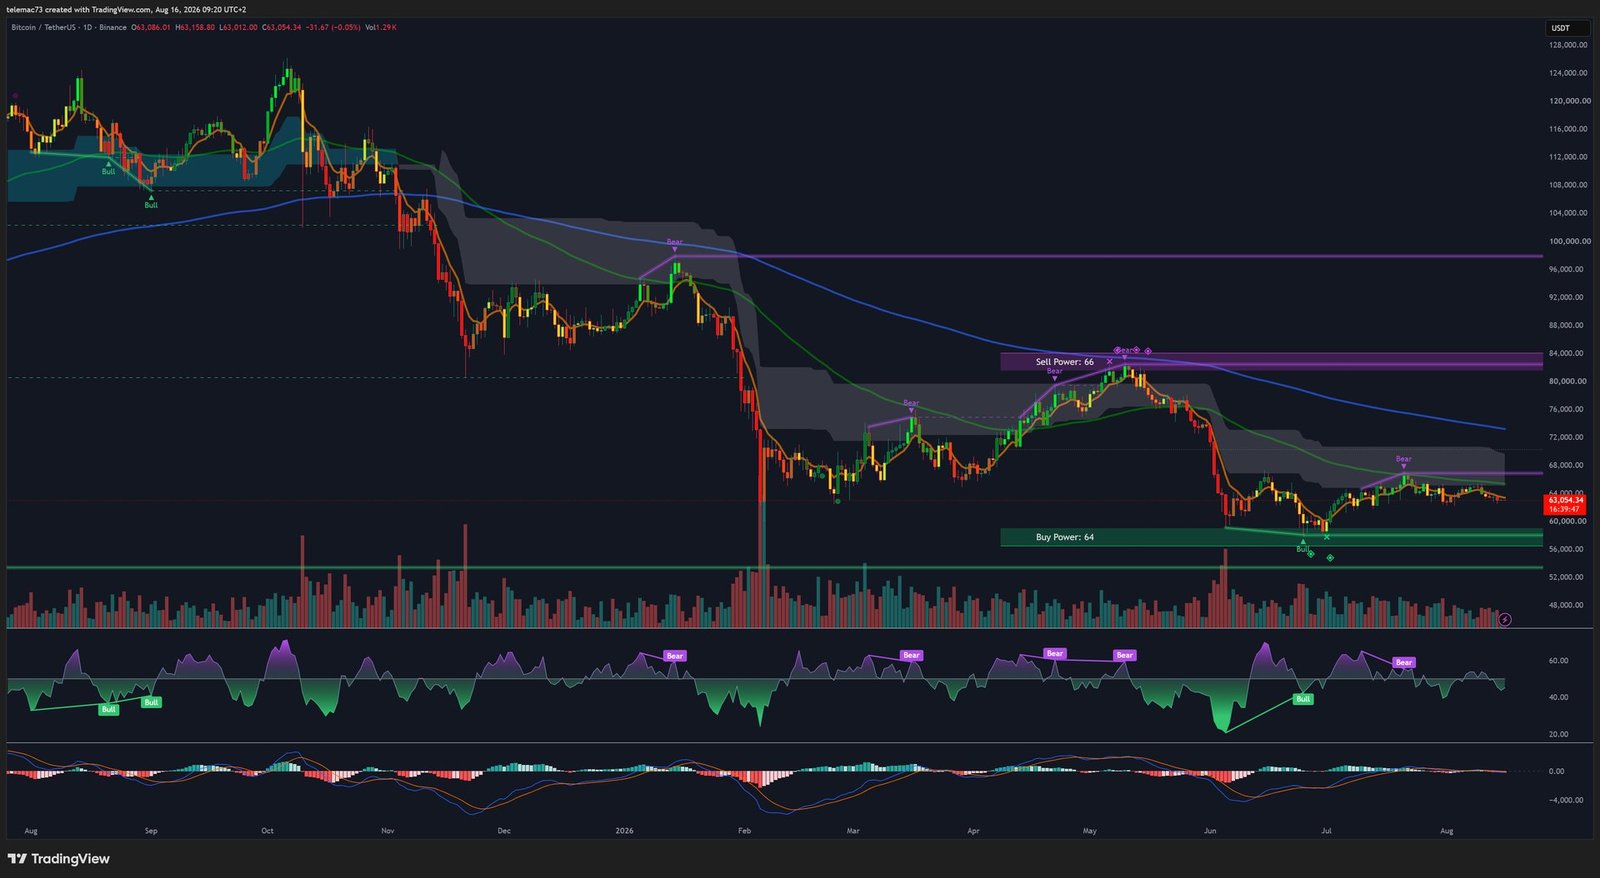
The daily chart paints the picture of an asset trapped in a heavy downtrend, with a technical score degraded to -51 over a one-to-six-quarter horizon. The most concerning feature remains the ongoing formation of a « Head and Shoulders » reversal pattern, whose head peaked at the October 2025 top and whose neckline sits around $63,104. A volume-confirmed break below this level would open the door to $59,791, then to a major capitulation target between $54,499 and $53,000.
Zooming out, Bitcoin remains within a downward trend channel established over several months. In late June, the market recorded its first weekly close below the 200-week moving average since the heart of the 2023 bear market. On a more constructive note, the asset has completed a 50% Fibonacci retracement of its major bull move, a « discounted value » zone that tends to attract contrarian buyers.
4-hour chart: compression and indecision
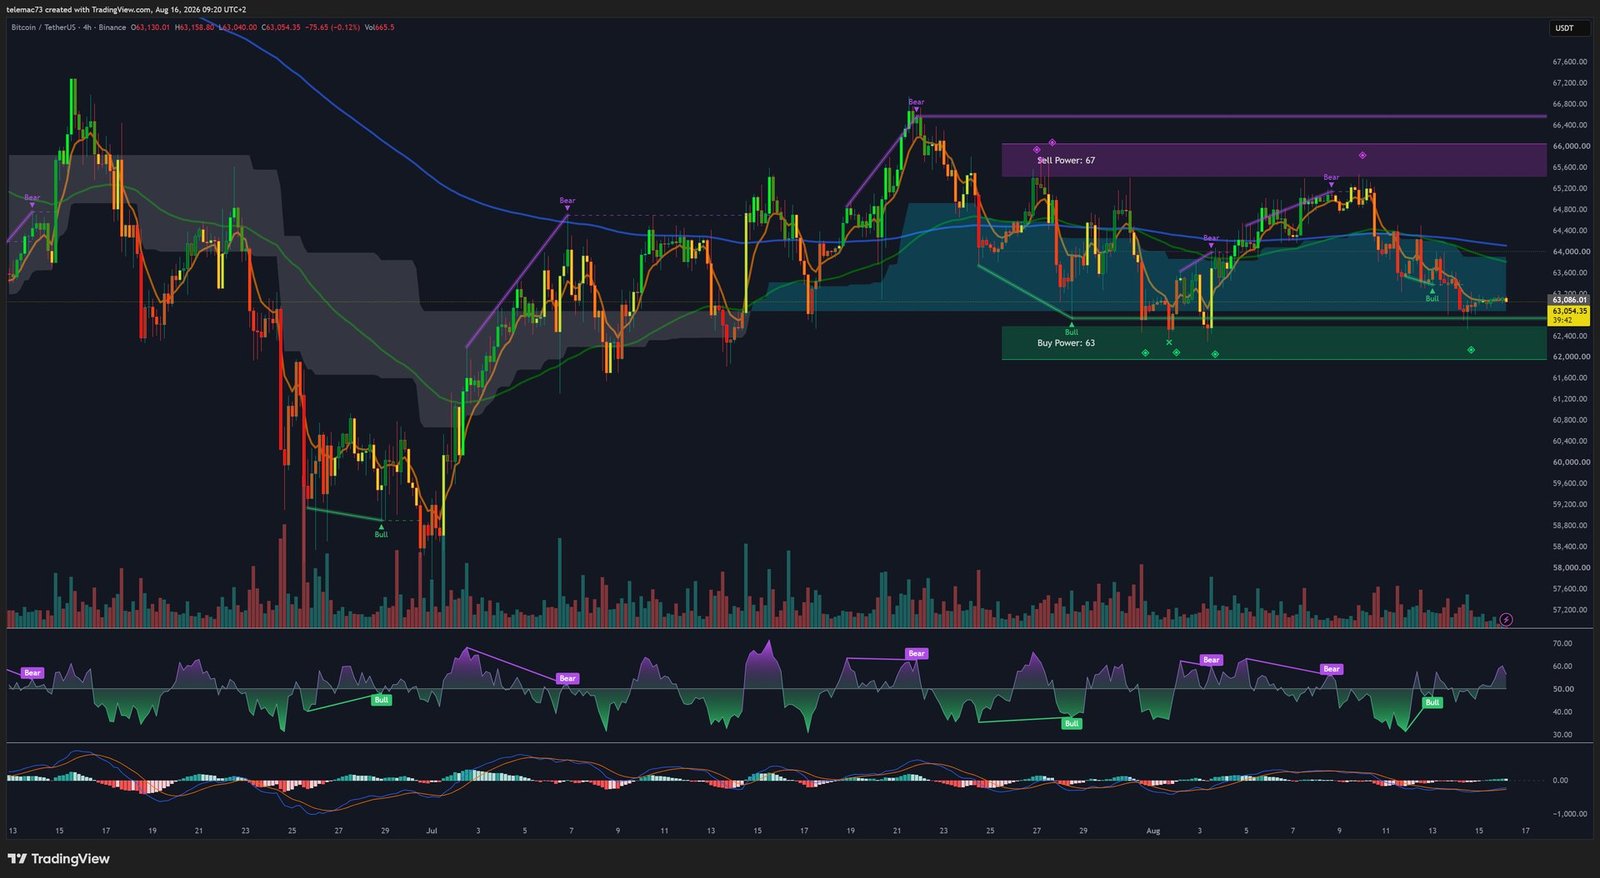
The 4H chart confirms a market driven by indecision: the sideways consolidation of recent weeks is shaping a compression triangle, or possibly a bear flag, a pattern typically classified as a continuation setup. An intense supply zone (the « Golden Zone ») spans $65,000 to $66,900 and has systematically rejected buying attempts, while a demand zone supports price structure between $61,800 and $63,000. Price is currently leaning on a pullback pivot around $64,355.
15-minute chart: market noise and liquidity extraction
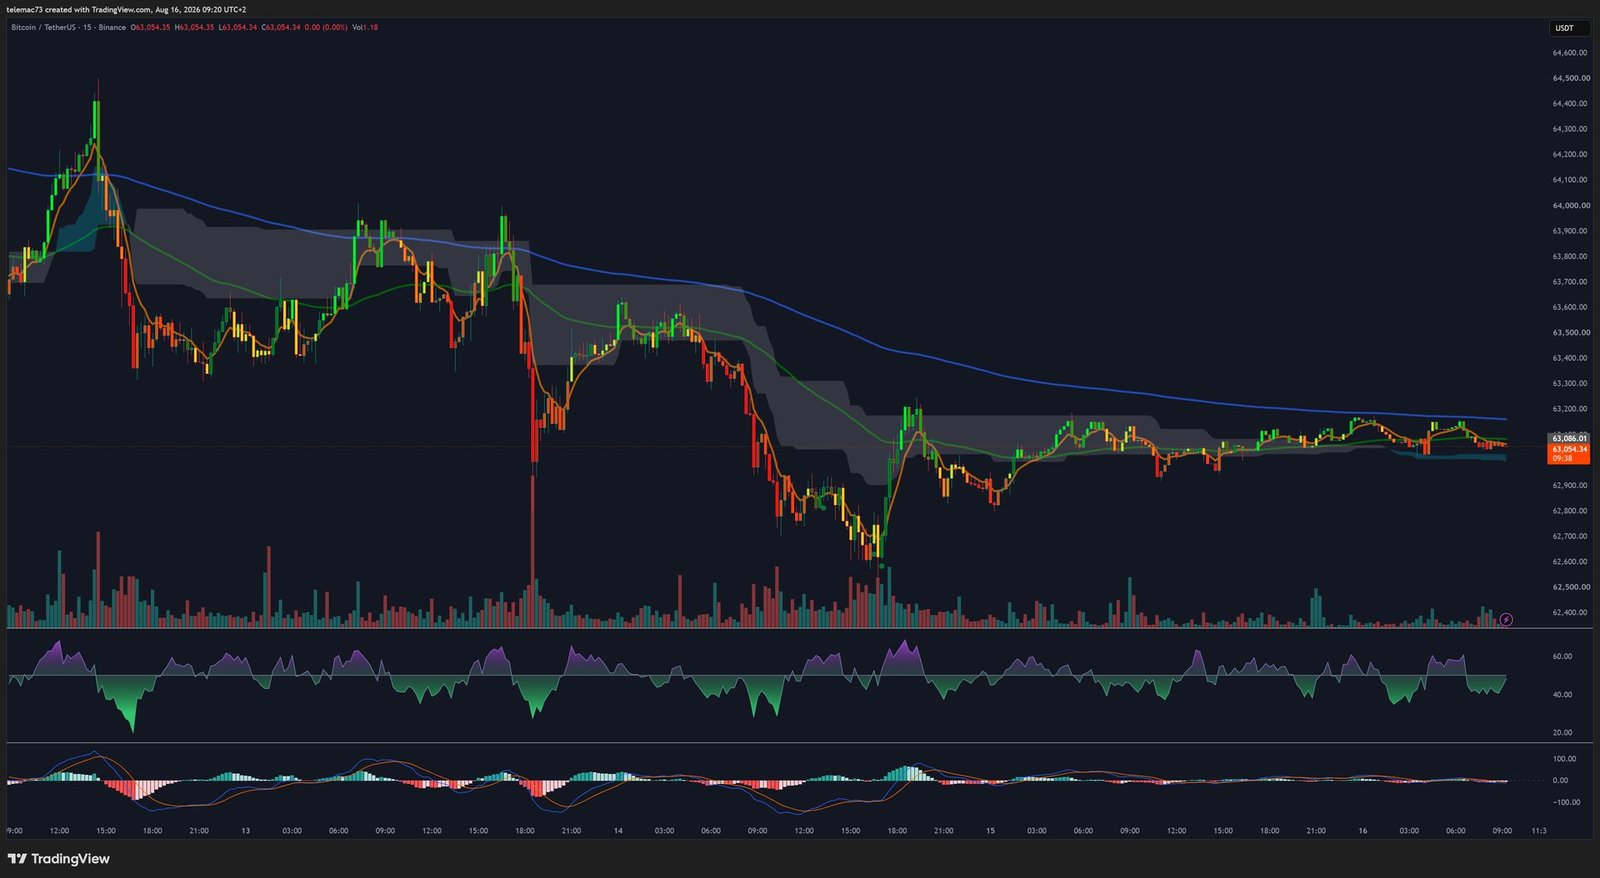
On the shortest timeframe, price is trading within a bearish channel, characterized by sharp impulsive sell waves followed by « ABCD »-structured corrections. This behavior reflects an ongoing hunt for sell-side liquidity by larger operators, triggering stop-losses placed below recent lows before pushing price back up. A high-risk opportunity has been identified in the form of a « Bullish Cypher » harmonic pattern, whose confluence zone aligns with a residual inefficiency gap around $60,000, with a strict invalidation point set at $65,500.
Oscillators and mathematical indicators
The monthly RSI sits at a weak 43, far from euphoric territory, while the daily RSI remains locked in a persistent downtrend, struggling to break above the 50 midline. On shorter timeframes (4H, 15M), multiple incursions into oversold territory are visible, with a few mild bullish divergences that have so far failed to translate into forceful upward impulses.
The MACD confirms this distributive bias: bullish crossovers (« Golden Cross ») are absent from every relevant timeframe, while the 4H chart is littered with bearish crossovers (« Death Cross »), with every rejection near $65,000 immediately followed by negative histogram expansion. On the daily, the MACD remains deeply entrenched in negative territory.
| Indicator | Reading |
|---|---|
| Short-term score (1-6 weeks) | Negative (-84) — active distribution phase |
| Medium-term score (1-6 months) | Mildly negative (-28) — channeled downtrend |
| Long-term score (1-6 quarters) | Negative (-51) — breakdown of macro-structural dynamics |
| Daily RSI | Persistent downtrend, below the 50 level |
| MACD (4H & daily) | Dominated by « Death Cross » signals, no clear accumulation signals |
Key levels to watch
| Level | Nature |
|---|---|
| $74,000 | Major medium-term resistance |
| $69,000 | Intermediate resistance |
| $66,900 | Top of the resistance « Golden Zone » |
| $65,000 | Bottom of the « Golden Zone » / bullish validation threshold |
| $64,355 | Short-term pullback pivot |
| $63,104 | Neckline of the Head and Shoulders pattern |
| $62,700 | Critical short-term support |
| $60,667 | Intermediate support |
| $57,000 – $58,000 | Major institutional demand zone |
| $53,000 | Extreme capitulation target |
Two scenarios going forward
Bearish scenario: continued distribution
This scenario remains dominant over the short and medium term. Anxiety around the upcoming PCE inflation release, combined with the fresh risk premium from a possible MicroStrategy token sale, continues to weigh on demand. A clean break below $62,700, confirming the loss of the $63,104 neckline, would trigger a cascade of stop-loss liquidations and a mechanical drop toward the major liquidity zone between $57,000 and $58,000, with an extreme theoretical target of $54,499 in the event of an additional exogenous shock.
Bullish scenario: the bear trap
A minority scenario in the short term, but historically recurrent during phases of psychological capitulation, this outcome rests on seller exhaustion, as suggested by the drop in Short-Term Holder supply to 23.5%. A full absorption of selling pressure by buy-side liquidity walls, combined with a benign PCE report, could allow a volume-backed reclaim of the « Golden Zone, » confirmed by a daily close above $65,000. Such a move would force short positions to cover (short squeeze), opening the path toward $67,000.
| Horizon | Approach |
|---|---|
| Short term (Day / Scalp) | Scaled buys within the $61,800-$63,000 zone, strict stop-loss below $60,800, gradual profit-taking toward $63,500 |
| Medium term (Swing) | Neutral until a breakout is confirmed: below $61,000 for a bearish bias, above $65,000 on a daily close for a bullish bias |
| Long term (DCA) | The zone below $63,000, near the 200-week moving average, has historically represented a favorable progressive accumulation window |
Conclusion
As of mid-August 2026, Bitcoin appears as a severely tested asset, constrained within a complex distribution structure: a threatening Head and Shoulders pattern, anemic momentum oscillators, and a heavily asymmetric order book favoring institutional sellers. Losing the $62,700 support could trigger a capitulation move toward the buy walls sitting between $57,000 and $58,000.
Still, it would be risky to extrapolate this short-term fragility onto the entire cycle. On-chain data reveals an extraordinarily advanced speculative cleanse, with less than 25% of supply held by short-term participants, while the long-term macro thesis — currency debasement against sovereign debt — continues to support structural demand for Bitcoin. The current zone, anchored to the 200-week moving average, has historically served as the incubation ground for major bull markets. Professionals will likely favor strict tactical neutrality until this compression resolves technically, while maintaining methodical accumulation plans over the longer term.
Disclaimer: this article is provided for informational and educational purposes only. It does not constitute investment advice, a recommendation to buy or sell, or a solicitation to trade any financial asset. Cryptocurrency markets are highly volatile and carry a risk of capital loss. Always do your own research (DYOR) and consult a qualified financial advisor before making any investment decision.

