


In mid-August 2026, Bitcoin (BTC) sits at a rare confluence: robust underlying institutional demand, an increasingly mature on-chain architecture, and a geopolitical risk premium weighing heavily on risk appetite. The asset is currently consolidating in a tight, high-tension range, oscillating mainly between $63,000 and $65,000 — a zone concentrating the attention of high-frequency trading algorithms, market makers, and long-term investors alike.
Total crypto market capitalization remains remarkably resilient, holding around $2.19-2.22 trillion, while the Fear & Greed Index hovers between fear (37) and neutrality (40) — reflecting a defensive posture ahead of, and following, major macroeconomic releases. This analysis offers a comprehensive read of these directional forces: institutional flows, structural regulatory developments (with a focus on Switzerland’s pioneering role), and a detailed breakdown of technical charts and the liquidity heatmap.
The macroeconomic chessboard: underlying disinflation vs. geopolitical risk premium
Bitcoin’s behavior this August remains tightly linked to central bank monetary policy. The dominant catalyst of the week was the August 12 release of the US Consumer Price Index (CPI) by the Bureau of Labor Statistics. Annual CPI growth slowed to 3.4% in July, down from 3.5% in June — a figure perfectly in line with analyst consensus. Core CPI, which excludes volatile food and energy components, also moderated, coming in at 2.5% year-over-year and +0.2% month-over-month.
A granular read of the report reveals contrasting sectoral dynamics: energy prices fell 1.5% for the month (after -5.7% in June), with gasoline down 2.9%. Shelter costs rose just 0.1%, dragged down by a 3.3% drop in hotel prices. Conversely, used vehicles (+0.4%) and medical care services (+0.6%) posted modest rebounds. This gradual disinflation allowed markets to lower their expectations for prolonged elevated interest rates — the 2-year US Treasury yield fell roughly 15 basis points since late July, settling at 4.18%.
| Macro Metric (US) | June 2026 | July 2026 | Consensus |
|---|---|---|---|
| Headline CPI (YoY) | 3.5% | 3.4% | 3.4% |
| Core CPI (YoY) | 2.6% | 2.5% | 2.5% |
| Core CPI (MoM) | 0.0% | 0.2% | 0.2% |
| Energy (MoM) | -5.7% | -1.5% | N/A |
| US 2-Year Treasury Yield | ~4.33% | 4.18% | N/A |
This favorable macro backdrop, however, is sharply offset by an extremely tense geopolitical environment. The persistent Middle East standoff and explicit threats from Iran’s Supreme National Security Council regarding a closure of the Strait of Hormuz pushed crude oil prices up nearly 5%, brushing $81.80 a barrel. A potential closure of this strategic shipping lane represents a major asymmetric inflationary risk, one capable of erasing recent CPI progress by passing a shock through global production costs. The result: the US dollar, buoyed by its safe-haven status, keeps downward pressure on the nominal valuation of cryptocurrencies.
Tactical decoupling from the tech sector
In Q2 2026, a striking divergence emerged: Bitcoin fell 13.4% while the Nasdaq-100 surged 27.7%, an underperformance attributed to ETF outflows and weak corporate demand. But the tide turned in July: as institutional investors grew wary of stratospheric tech and AI valuations, the Nasdaq-100 corrected 6.6% while Bitcoin gained 7.5%, buoyed by a renewed surge of flows into spot ETFs. This crossover confirms that Bitcoin is beginning to assert itself as an uncorrelated asset, capable of absorbing diversification-seeking capital when traditional equity markets overheat.
Institutional flows, on-chain activity, and ecosystem dynamics
US spot Bitcoin and Ethereum ETFs recorded cumulative net inflows of roughly $1.1 billion over a single recent week — their best performance since mid-April. Between August 3 and 7, Bitcoin ETFs alone captured $865.3 million in net inflows across five consecutive days of accumulation, averaging close to $186 million per day.
This institutional buying pressure is corroborated by on-chain analysis: roughly 155,000 BTC have been accumulated within the $62,000-$65,000 price range, establishing a massive average cost basis for a new cohort of strategic investors. This hoarding behavior largely explains the resilience of technical support around $63,000. On the whale front, a major bearish entity (on-chain prefix 0x66f8) recently closed a $136 million short position while simultaneously opening a 40x-leveraged long — a possible signal that structural sell-side pressure is running out of steam.
Endogenous frictions and the altcoin ecosystem
The ecosystem is not without friction: the market had to absorb shockwaves from a security flaw affecting Trezor hardware wallets (with no confirmed theft to date, but a renewed sense of caution around self-custody), as well as a controversial minority-chain split. Trump Media also posted $238 million in accounting losses for the quarter ended in June, largely attributable to the depreciation of its Bitcoin holdings. On the altcoin side, Ethereum is holding above the $1,900 threshold, while BNB, Solana, Tron, Hyperliquid, and Dogecoin posted rallies ranging from 2.80% to 16.46%. Cardano and XRP, by contrast, saw corrections, with XRP stabilizing near parity at $1.00 after dipping to $0.90.
The regulatory landscape: the Swiss model versus UK inertia
Regulatory clarity remains a decisive factor for sovereign capital flowing into Bitcoin. While the UK’s ambitions of becoming a global crypto hub have been slowed by the shelving of the cross-party parliamentary group’s digital assets bill, Switzerland continues to consolidate its status as a frontier jurisdiction with an unmatched legal framework.
FINMA guidance and the DLT Act
FINMA’s publication of Guidance 01/2026 on crypto-asset custody marks a decisive turning point for institutional adoption. It clarifies prudential expectations for banks, securities firms, and portfolio managers regarding operational risks tied to distributed ledger technology. Anchored in the federal DLT Act that took effect in 2021, the Swiss approach clarifies that banks may hold crypto-assets as segregable custody assets, benefiting from absolute legal protection in the event of institutional bankruptcy — provided assets are held under individual or collective custody with mathematically unambiguous customer shares.
Licensing overhaul and token taxation
The revision of the Financial Institutions Act (FinIA) abolishes the old “Fintech license,” which capped deposits at CHF 100 million, in favor of a new “Payment Instrument Institution” license with no volume cap — provided client funds are fully backed by high-quality liquid assets or held with the Swiss National Bank. On the tax front, the Federal Tax Administration offers advance tax rulings for Token Generation Event projects, providing legal certainty before capital is even committed.
Compliance constraints and international standards
This permissive innovation framework comes paired with strict compliance requirements aligned with FATF standards: enforcement of the Travel Rule for virtual asset service providers, systematic KYC requirements, and the rollout of the automatic exchange of information (AEOI) on crypto-assets involving 111 partner states under OECD auspices. This structure creates a two-speed market: absolute institutional legitimacy for capital seeking safety, offset by higher transactional friction for speculative capital.
Microstructure analysis: the order book heatmap
Exploring the order book heatmap reveals the topography of Bitcoin’s latent liquidity, offering a window into the intentions of market makers and institutional whales.
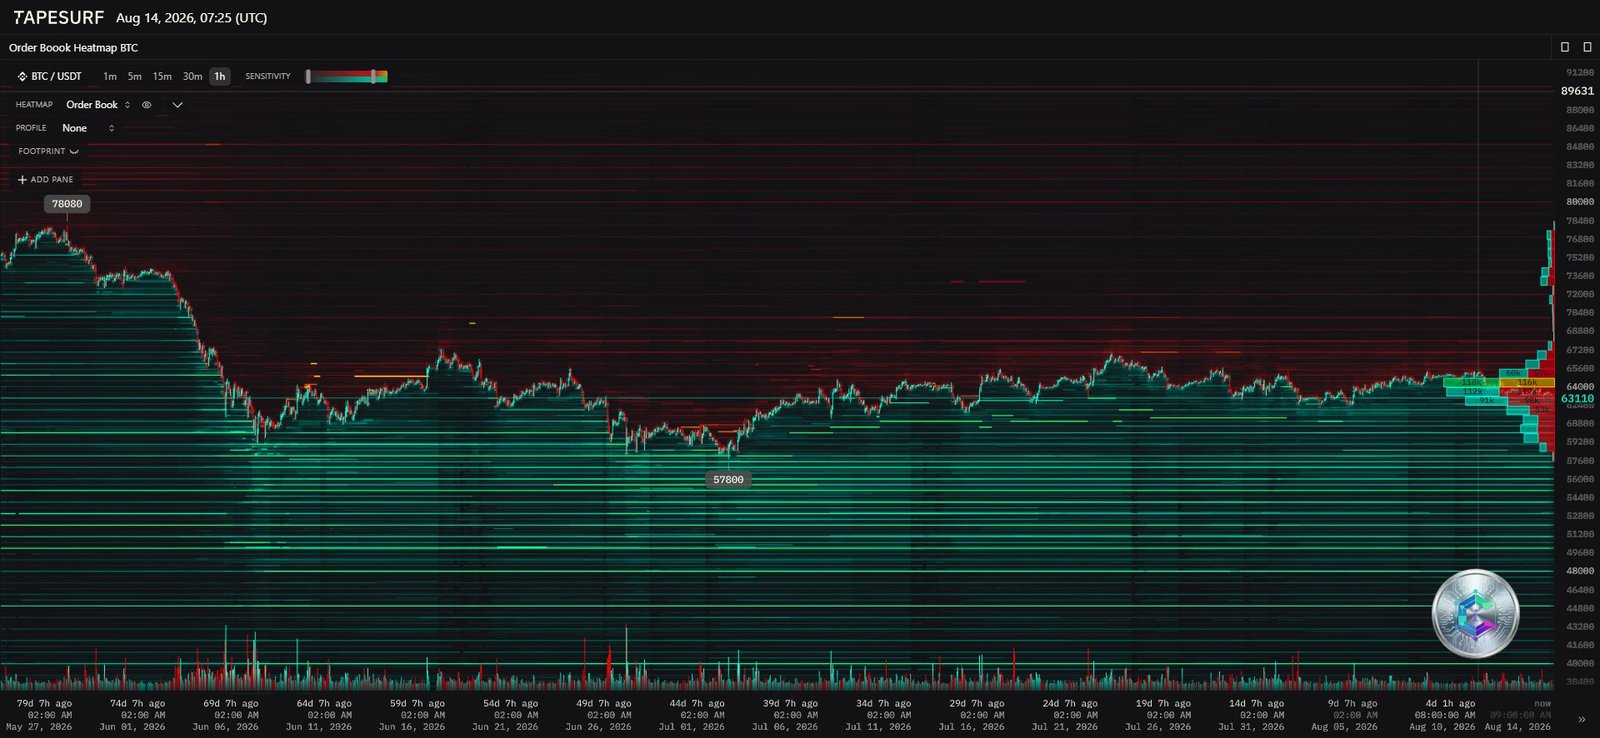
The analysis shows a massive concentration of sell-side liquidity, marked by intense red and orange horizontal streaks, sitting just above the current price of $63,110. These sell walls stack densely across the $64,500-$66,000 zone, acting as a glass ceiling that mechanically absorbs any bullish market-buy impulse. Conversely, the downside support structure shows more diffuse buy-side liquidity bands, with a notable block around $62,000 and a second, lower one near $57,800 — a density noticeably thinner than the overhead sell-side wall.
One caveat is worth noting: such massive walls can sometimes reflect “spoofing” — placing large orders with no genuine intent to execute, purely to influence market sentiment. However, the persistence of these blocks over several days, corroborated by actual price rejections, argues in favor of a genuine institutional distribution zone rather than a simple algorithmic mirage.
Multi-timeframe chart analysis: a fractal price breakdown
A professional technical assessment of Bitcoin requires a fractal breakdown of price. Examining the daily (1D), four-hour (4H), and fifteen-minute (15M) timeframes together allows for a dissection of the underlying trend, the medium-term reversal structure, and intraday volatility.
Macro trend: the daily chart (1D)
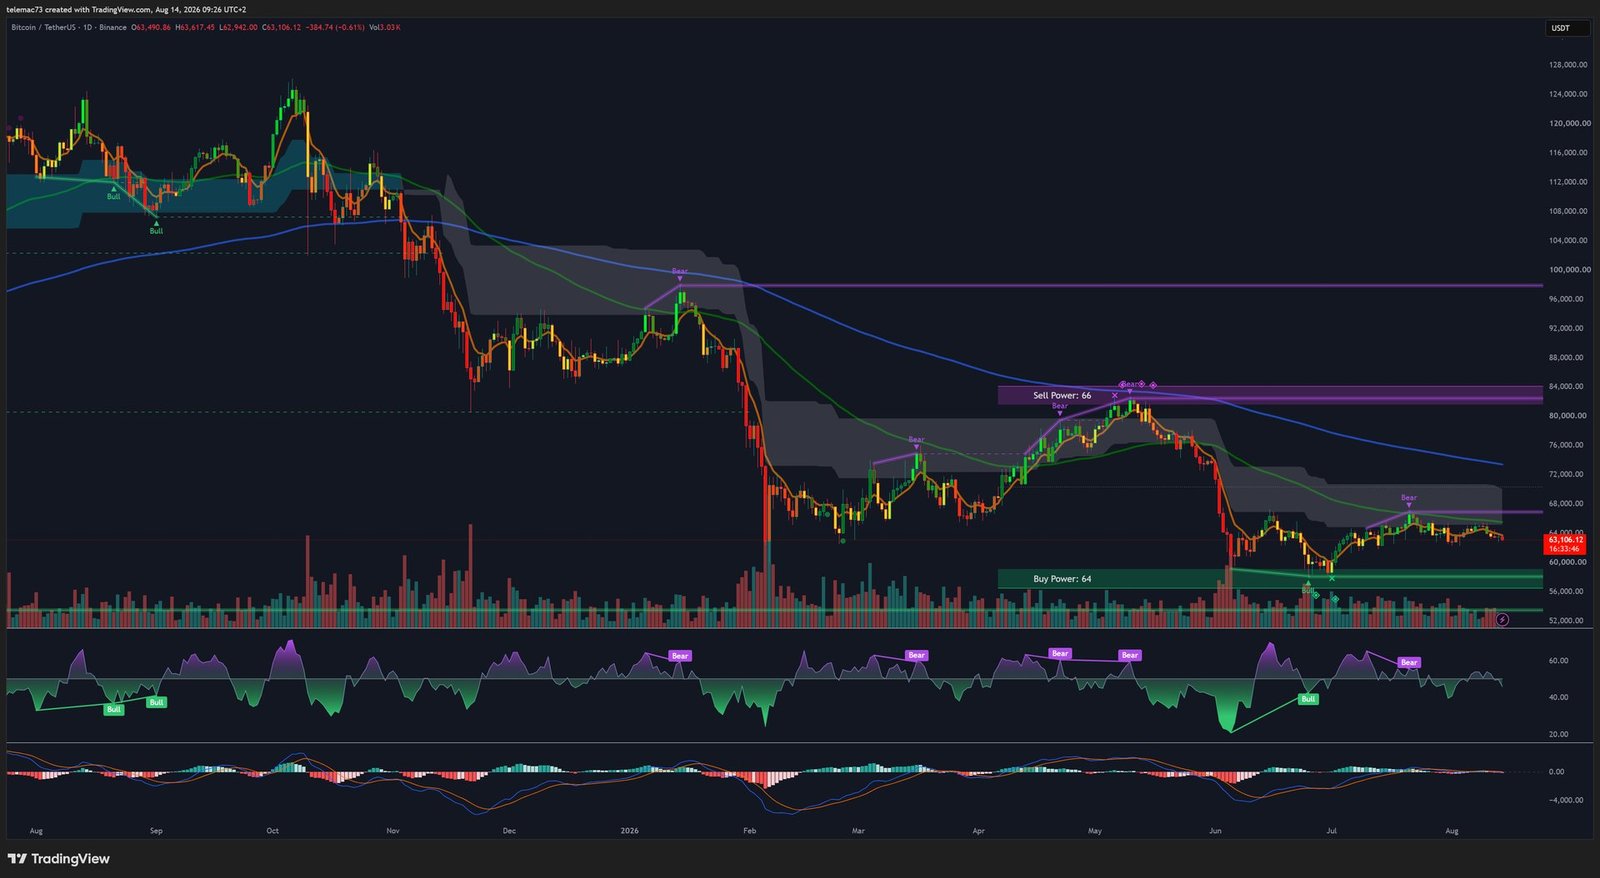
The daily chart illustrates the spectacular decline from the year’s earlier highs, when the asset ventured well beyond $100,000. Current price action, around $63,106, sits within a broad retracement and leverage-flushing move. A massive “Sell Power” block sits between $80,000 and $84,000 — the cycle’s absolute macro resistance — while a “Buy Power” block is clearly marked in the $58,000-$60,000 region, a floor successfully defended during previous capitulations.
The 14-period RSI sits in the lower neutral zone (40-45), recovering from historically oversold readings. Long-term moving averages show a bearish spread characteristic of a recently confirmed “Death Cross.” A glimmer of hope, however, comes from the MACD, whose negative histogram is progressively shrinking — though no directional “Golden Cross” has yet been confirmed on this timeframe.
Medium-term dynamics: the 4-hour chart (4H)
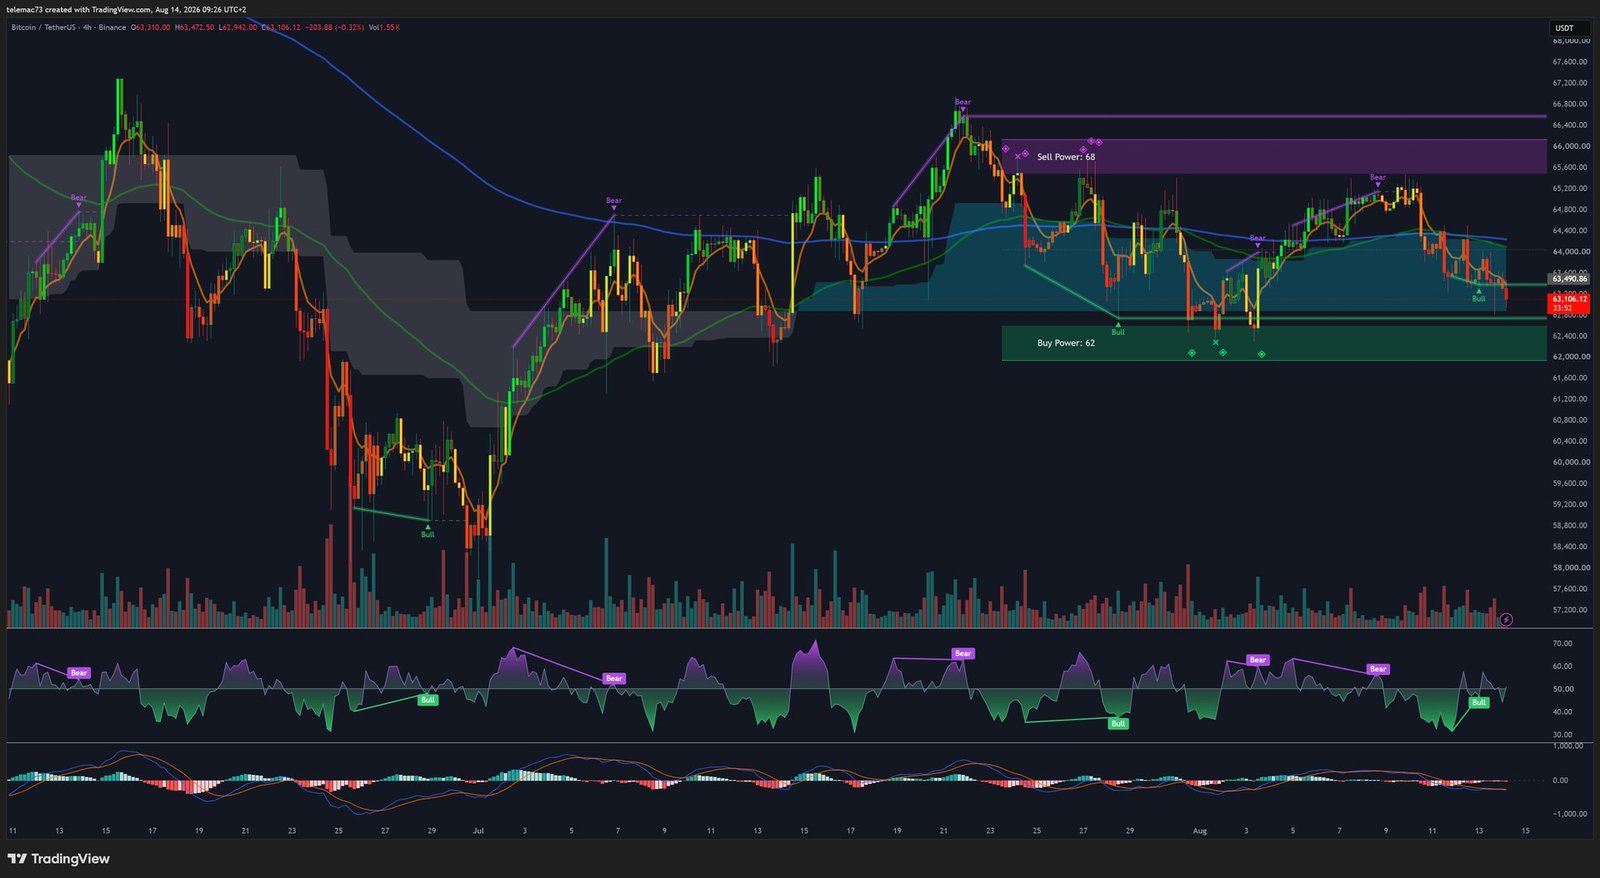
On this timeframe, Bitcoin is trapped in a compression pattern resembling a bear flag, strictly bounded between $62,000 and $65,600. A threatening “Sell Power” zone sits between $65,000 and $66,000, aligning with the red liquidity blocks observed on the heatmap, while the “Buy Power” zone spans $62,000 to $63,000.
The RSI oscillates almost randomly around its 50 midline, with no sustained extreme readings — a hallmark of directionless, range-bound conditions. The MACD winds around the zero line with a subtle hidden bearish divergence: recent price highs, though reaching similar levels near $65,000, struggle to generate matching strength on the oscillator. A sustained break below $63,600-$63,800 risks triggering a cascade of long liquidations, while a convincing break above $64,500 on volume could force short sellers to cover (short squeeze).
Intraday microstructure and volatility: the 15-minute chart (15M)
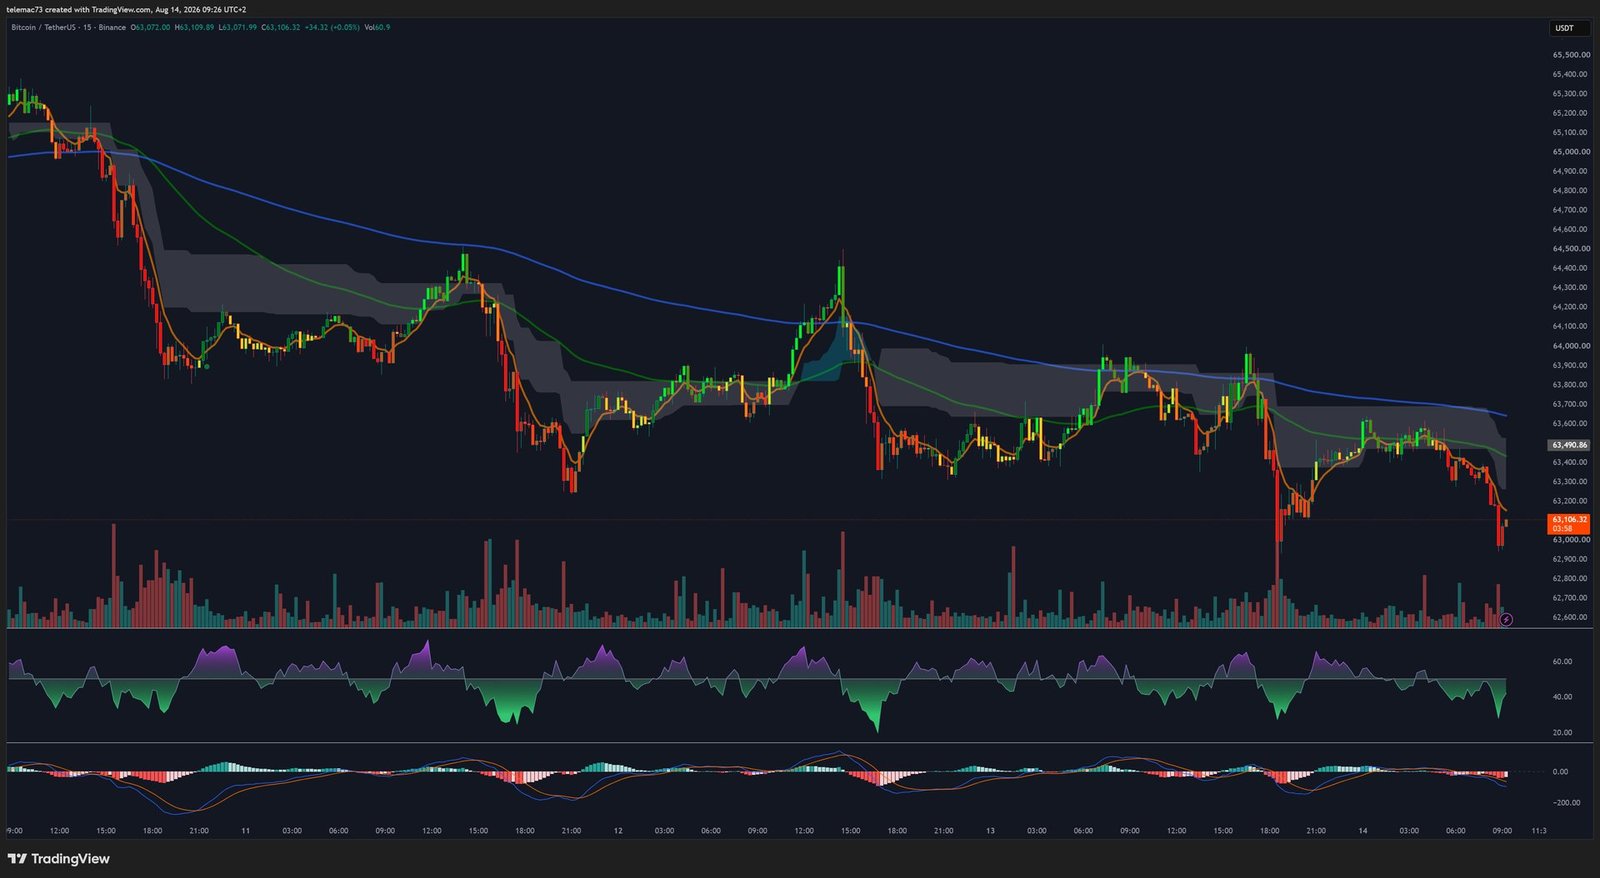
This timeframe reveals extreme nervousness, with long wicks pointing to liquidity grabs orchestrated by institutional players. Recent price action shows a violent rejection near $64,000-$64,500, followed by a sharp drop and a tentative rebound around $63,100. Short-term moving averages are now acting as aggressive dynamic resistance.
The RSI hit extreme oversold readings during the last drop, plunging below the 30 threshold. However, the weakness of the subsequent rebound — with price struggling to reclaim and hold $63,500 — betrays latent structural supply that hasn’t been fully flushed out. The MACD remains deeply negative, with only tentative signs of bearish exhaustion.
Quantified summary of key technical levels
| Level Type | Price Zone (USD) | Rationale |
|---|---|---|
| Macro resistance (1D) | 80,000 – 84,000 | Major historical “Sell Power” zone. Massive distribution from early-2026 cycle capital. |
| Pivot resistance (4H) | 65,000 – 65,600 | Critical resistance; confluence of the bear-flag top and maximum sell-wall density on the heatmap. |
| Intermediate resistance | 64,200 – 64,500 | Intra-channel point of control. A break is essential to invalidate immediate bearish pressure. |
| Current price (spot) | ~63,106 | Current trading zone. Unstable equilibrium between ETF liquidity and sell algos. |
| Local pivot support (4H) | 63,600 – 63,800 | First-line support. A confirmed close below exposes the asset to cascading liquidations. |
| Volume support (4H) | 62,000 – 63,000 | “Buy Power” zone. Corroborated by the massive 155,000 BTC on-chain accumulation. |
| Macro support (1D) | 58,000 – 60,000 | Last-resort floor. A break would invalidate the secular bull market thesis. |
The geometric analysis confirms the dominance of bearish compression structures. The descending channel observed on the 4-hour chart reflects demand’s inability — despite ETF flows exceeding a billion dollars weekly — to overcome latent sell-side supply seeking an exit. The absence of a “Golden Cross” on the higher timeframes underscores that the market has not yet gathered the momentum needed for a structural trend reversal.
Conclusions and strategic outlook
Bitcoin is currently the stage for an invisible tug-of-war between structurally bullish institutional flows on one side, and persistent exogenous risk factors dampening broader risk appetite on the other. Massive inflows into US ETFs, together with 155,000 BTC accumulated on-chain in the $62,000-$65,000 band, are building an exceptionally dense valuation floor. The conversion of major short sellers into long positions confirms that the traditional-capital adoption thesis remains fully intact.
Through the lens of chart analysis, however, the asset shows genuine short-term vulnerability: the bear-flag structure on the 4-hour chart, corroborated by the mass of sell orders visible on the heatmap above $64,500, proves that spot supply is temporarily outpacing demand’s absorption capacity. On the macro front, cooling US inflation offers a favorable tailwind by boosting the odds of rate cuts — an environment traditionally supportive of Bitcoin’s valuation multiples. This catalyst, however, is being neutralized by the threat of an oil shock tied to the Strait of Hormuz, which is pushing institutional capital toward the safety of the dollar and sovereign bonds.
Finally, the ongoing regulatory transformation, led by the Swiss vanguard (FINMA guidance, the DLT Act, the Payment Instrument Institution license), continues to anchor digital assets more permanently within the architecture of traditional finance. Ultimately, Bitcoin is navigating a complex price-discovery phase this summer of 2026, consolidating its institutional support base while flushing out its last speculative leverage excesses. Breaking out of this congestion zone will require an alignment of catalysts: either a geopolitical de-escalation in the Middle East, or a technical confirmation via a volume-backed break of the $65,600 resistance.
Disclaimer: this article is provided for educational and informational purposes only. It does not constitute investment, financial, or trading advice of any kind. Cryptocurrencies are highly volatile assets, and any capital commitment should be based on independent research and, where appropriate, the guidance of a qualified professional.

