


Bitcoin is grinding through one of the tightest consolidation phases of its current cycle this July 2026. Boxed inside a narrow 64,000–67,000 dollar range, the leading crypto asset is the stage for a quiet but decisive tug-of-war between massive institutional inflows, a knife-edge US monetary policy decision, and combustible geopolitics. Our team reviewed the multi-timeframe charts (15-minute, 4-hour, daily) alongside the order-book heatmap to bring you a structured read on where things stand.
What the liquidity heatmap is telling us
Reading the order book through a heatmap has become an essential tool for gauging market participants’ short-term intentions. Unlike a standard candlestick chart that only shows the past, a heatmap reveals the depth of resting liquidity at each price level.
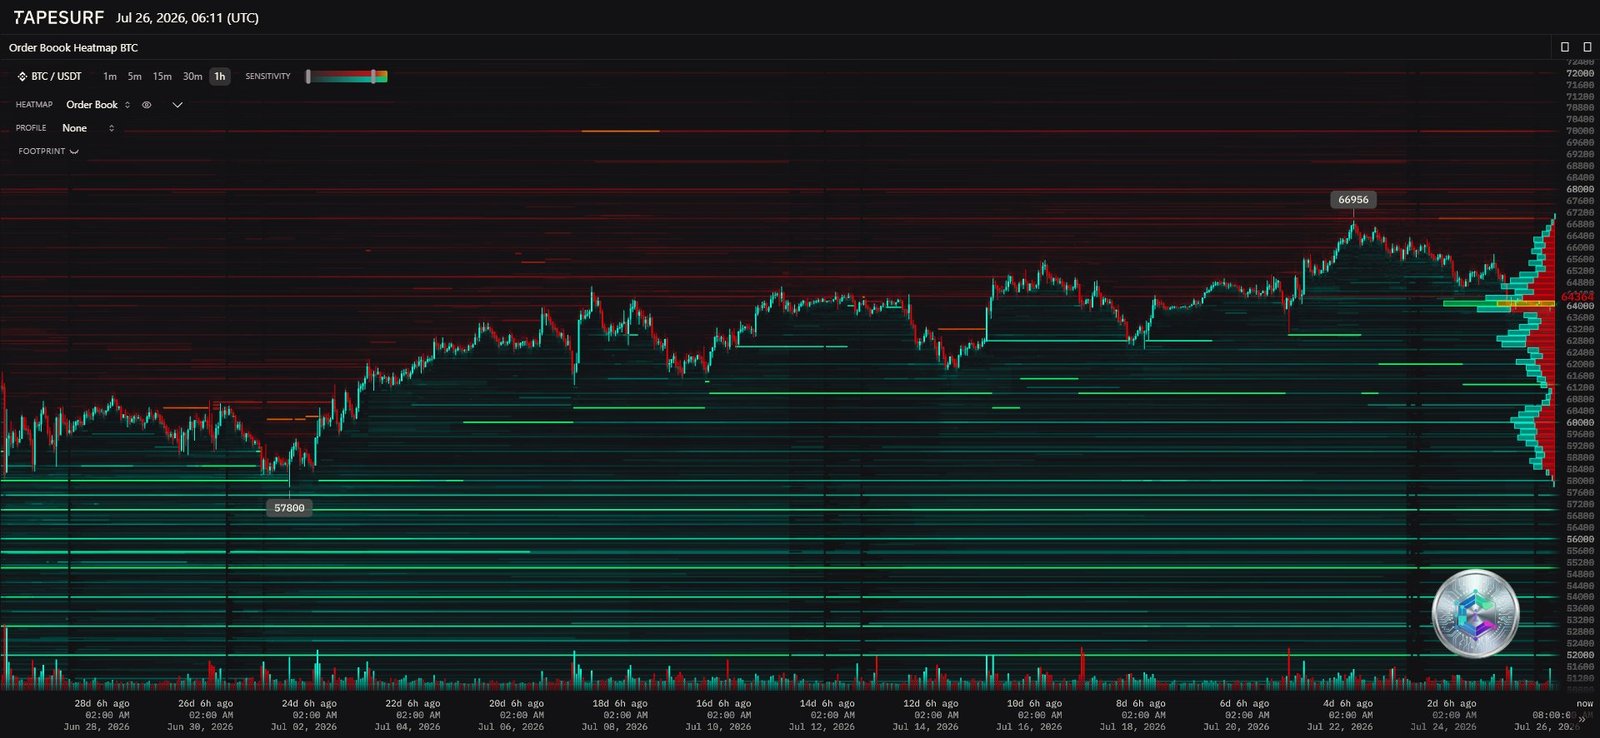
The current structure is clearly polarized. On the downside, a genuine wall of buy-side liquidity has formed between 64,000 and 64,150 dollars, explaining why sellers have repeatedly failed to push price durably below this floor. On the upside, dense sell-side liquidity thickens as price approaches 67,200 dollars, a sign that long-term holders are using every rally to take profits.
Something worth flagging for experienced traders: part of the liquidity sitting above 66,000 dollars shows the fingerprints of « spoofing » — large orders placed with no real intention of being filled, meant to discourage breakout attempts. Should the market still manage to absorb the genuine liquidity at 67,200 dollars, the liquidity void just above it could trigger a short squeeze pushing price quickly toward 70,000 dollars.
The daily chart: structural indecision
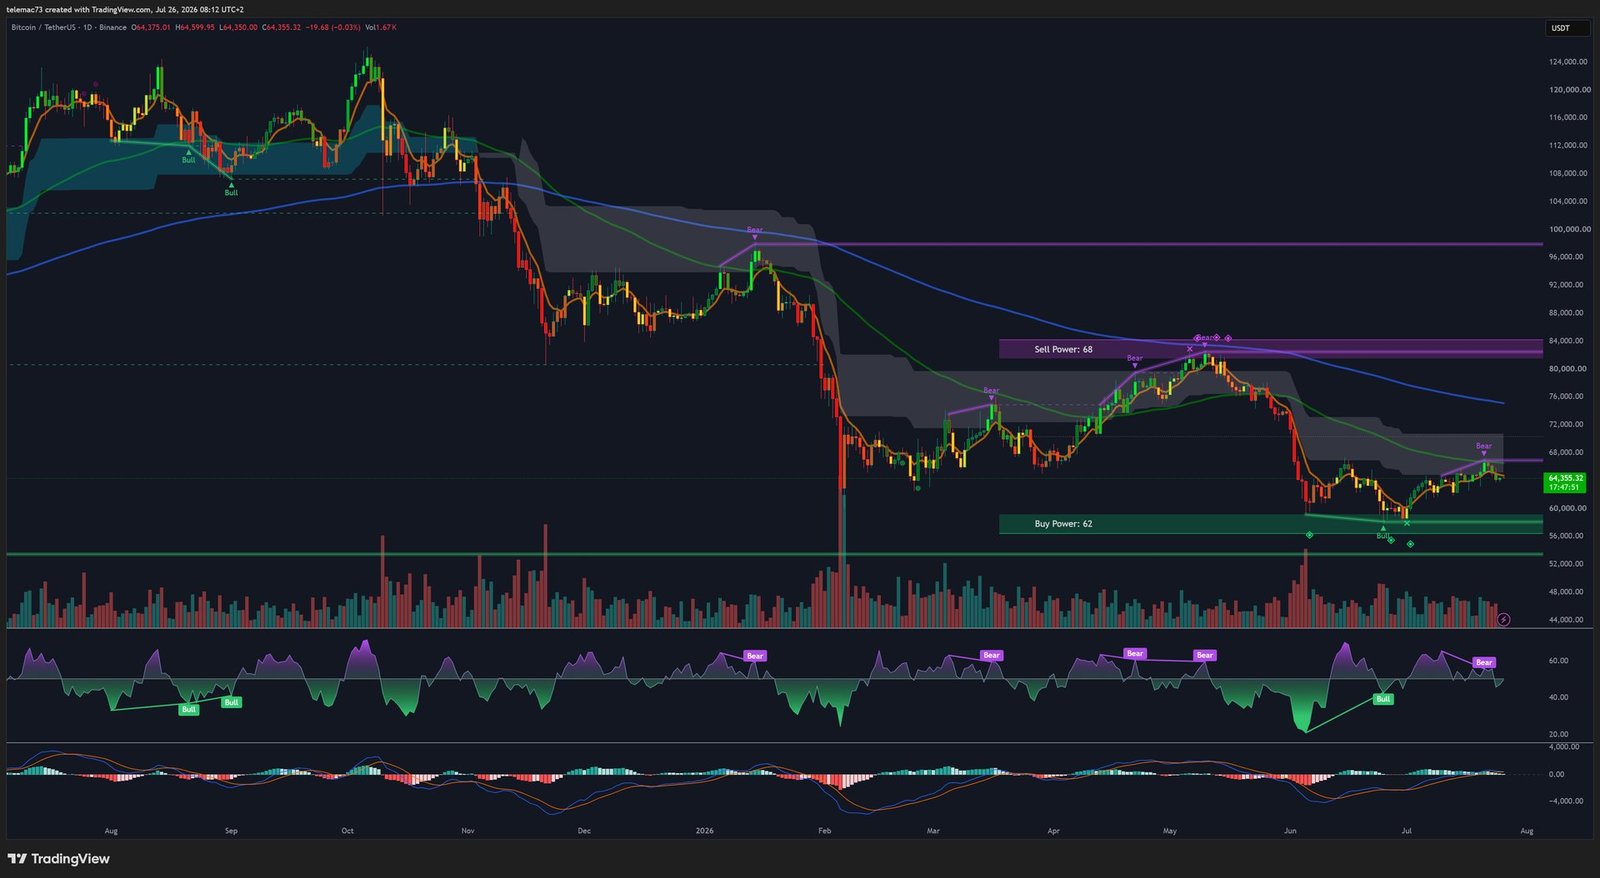
On the daily timeframe, Bitcoin is caught in an intense friction zone between its 50-day EMA, around 65,135 dollars, and its 200-day SMA, whose estimates range between 65,192 and 73,997 dollars depending on the weighting model used. This convergence zone is decisive: should the 50-day EMA cross below the 200-day SMA, a « Death Cross » would trigger systematic selling that could drag price toward 58,000 dollars. Conversely, a « Golden Cross » would confirm a resumption of the uptrend toward new all-time highs above 74,000 dollars.
Oscillators reinforce this picture of indecision. The 14-period RSI is stuck between 49 and 54 — a near-perfect neutral reading that often precedes a volatility explosion. The MACD, negative at -11.86, nonetheless shows a shrinking histogram, suggesting selling pressure is gradually running out of steam.
The 4-hour chart: compression triangle or bear flag?
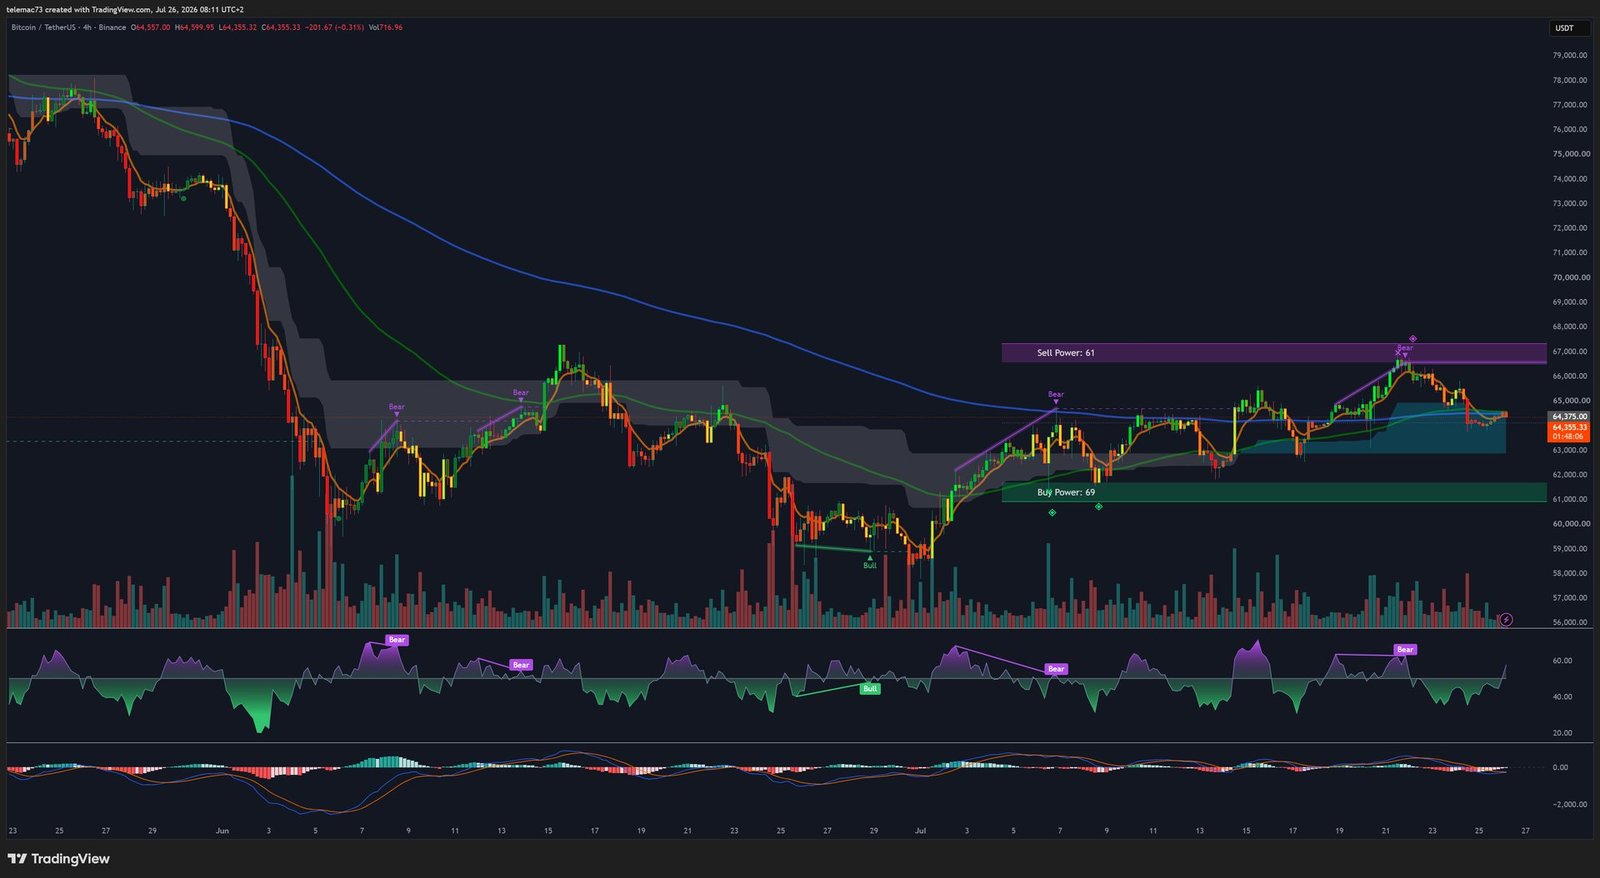
On the 4-hour chart, two competing readings emerge. The first sees a symmetrical compression triangle, with higher lows defended around 64,100 dollars and lower highs repeatedly rejected near 66,500 dollars. The gap between one-year realized volatility (42%) and historically low implied options volatility (37%) confirms a tightly coiled market storing up energy ahead of a decisive resolution. A volume-confirmed break above 67,200 dollars would open the path toward 68,000 dollars.
The second, more cautious reading sees a modest ascending channel off the 57,000-dollar summer low, potentially forming a bear flag within a broader downtrend. A break of the 64,150-dollar support would validate this scenario and project price toward the 53,000-dollar zone.
The 15-minute chart: algorithms’ playground
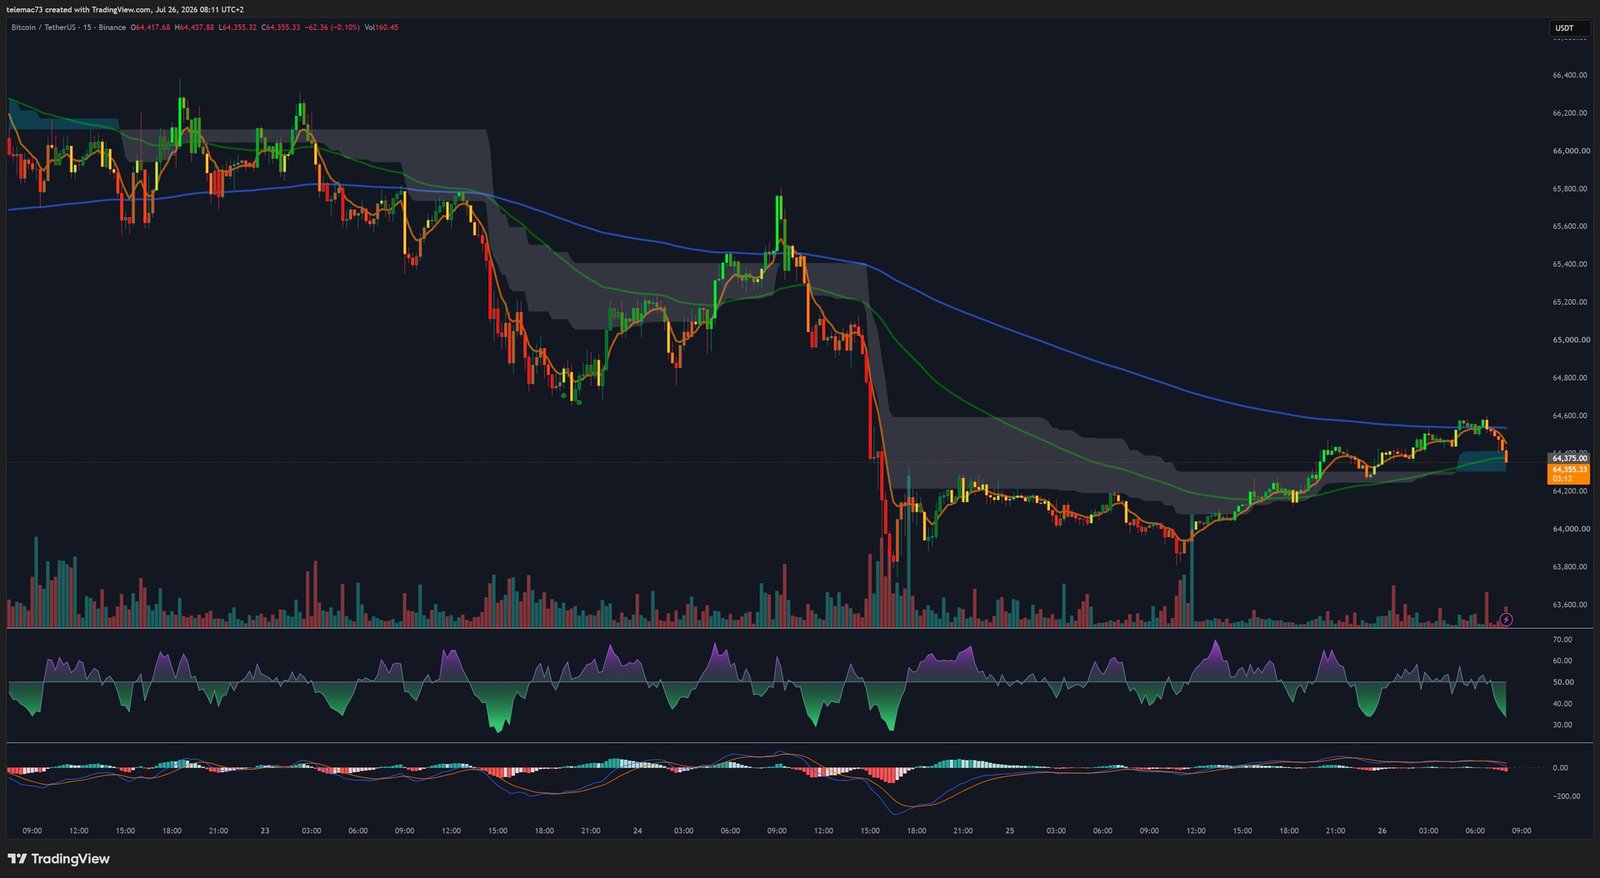
On this very short timeframe, the 65,500-dollar pivot acts as the daily front line. The long wicks visible on the chart reflect repeated liquidity sweeps: every push above 66,000 dollars is immediately rejected, absorbing the stop-losses of retail traders positioned against the trend. The M15 RSI swings between extreme oversold (below 20) and extreme overbought (above 80) readings, feeding mean-reversion strategies rather than genuine trend signals.
Key technical levels at a glance
| Technical level | Price (USD) | Significance |
|---|---|---|
| Macro resistance | $73,997 | Monthly all-time highs, adjusted 200-EMA |
| Psychological resistance | $70,000 | Major sell-side liquidity wall |
| H4 resistance | $67,200 | Ceiling of the 4H compression triangle |
| Intraday pivot | $65,500 | M15/H1 battleground |
| Structural support | $64,100 | Floor of the H4 triangle, buy wall |
| Secondary support | $62,500 | Historical accumulation zone |
| Macro danger support | $58,115 | Recent monthly lows |
The macro backdrop weighs in
Technicals can’t be divorced from the macro picture. All eyes are on the FOMC meeting of July 28-29, 2026, with the federal funds rate currently sitting between 3.5% and 3.75%. Prediction markets are pricing in over an 82% probability of a hold, after briefly flirting with hike odds earlier in July on sticky inflation fears. A slowdown in year-over-year inflation to 3.5%, versus 3.8% expected, has temporarily eased pressure on the dollar.
Much of this residual inflation is being driven by massive AI-related capital expenditure, which is straining supply chains and energy prices. South Korea’s Kospi index, heavily exposed to semiconductor names, has crashed more than 31% from its June peak, illustrating just how fragile the AI-driven speculative frenzy can be and its potential to drain global liquidity. Layered on top is a geopolitical storm in the Middle East, with tensions around oil exports pushing crude above 90 dollars a barrel and reinforcing the restrictive real-rate cycle.
An institutional wall absorbing the shocks
Against these macro headwinds, capital structure within the crypto industry is acting as a powerful shock absorber. US spot Bitcoin ETFs have strung together seven consecutive sessions of net inflows, pulling in nearly a billion dollars, including a single 203-million-dollar day that fully offset the prior week’s outflows. More than 1,084 new ETFs have launched this year alone, underscoring the scale of institutional adoption.
Meanwhile, corporate treasuries continue an aggressive accumulation strategy independent of short-term price swings, draining the floating supply available on exchanges. On the retail side, data from India’s WazirX shows a profound shift: deposits are outpacing withdrawals by a factor of 2 to 6, and 95% of active traders are now repeat users — a sign of the shift from pure speculation toward long-term investing.
Options and derivatives: the $72,000 wall
The options market has built an impressive wall of nearly 2.5 billion dollars in open interest at a 72,000-dollar strike expiring at the end of July — coinciding with the Fed meeting. Should spot price break above 67,200 dollars, market makers who sold those calls could be forced to buy Bitcoin aggressively to hedge their exposure, a gamma squeeze mechanism capable of sharply accelerating the rally. On Polymarket, the odds of a month-end close around 67,500 dollars are priced at 78.5%, reflecting cautious optimism rather than outright euphoria.
Ethereum and altcoins lagging behind
Bitcoin dominance is mechanically strengthening in this environment. Ethereum, trading around 1,877 dollars, shows a weaker annual performance (-48% versus -44% for BTC) and is leaning dangerously on its 1,790-dollar support. Major altcoins are undergoing regular corrections as institutional investors favor the most established asset in the digital asset class amid restrictive policy rates above 3.5%.
What historical cycles suggest
Macro-cyclical models note that a July rebound — like the one currently underway after price briefly pierced the 200-week SMA during the summer drop to 57,000 dollars — has historically given way to weakness in August and September during US midterm election years, before a bottom forms in the fourth quarter. On-chain data partly supports this scenario: the MVRV Z-Score has reset into negative territory without price ever breaking below the historical « Balanced Price, » estimated around 37,700 dollars, hinting at a consolidation-by-time scenario rather than a violent capitulation.
Conclusion: kinetic energy waiting to release
Bitcoin’s July 2026 market is a textbook case of the modern financial duality: unstoppable fundamental adoption (ETFs, corporate treasuries, maturing retail behavior) colliding with an oppressive macro ceiling (AI-driven inflation, restrictive rates, unstable geopolitics). Technically, this collision shows up as extreme compression across every timeframe, with an enormous amount of kinetic energy waiting to be released.
- A daily close above $67,200 would invalidate the consolidation and open the path toward $70,000.
- Holding the $64,150 support remains the prerequisite for short-term sentiment stability.
- The July 28-29 Fed meeting, combined with the $2.5 billion options expiry, is the most likely catalyst for a volatility resolution.
Disclaimer: this article was written for purely educational and informational purposes. It does not constitute investment advice or a recommendation to buy or sell. Cryptocurrency markets are highly volatile; always do your own research and consult a qualified financial advisor before making any investment decision.

