


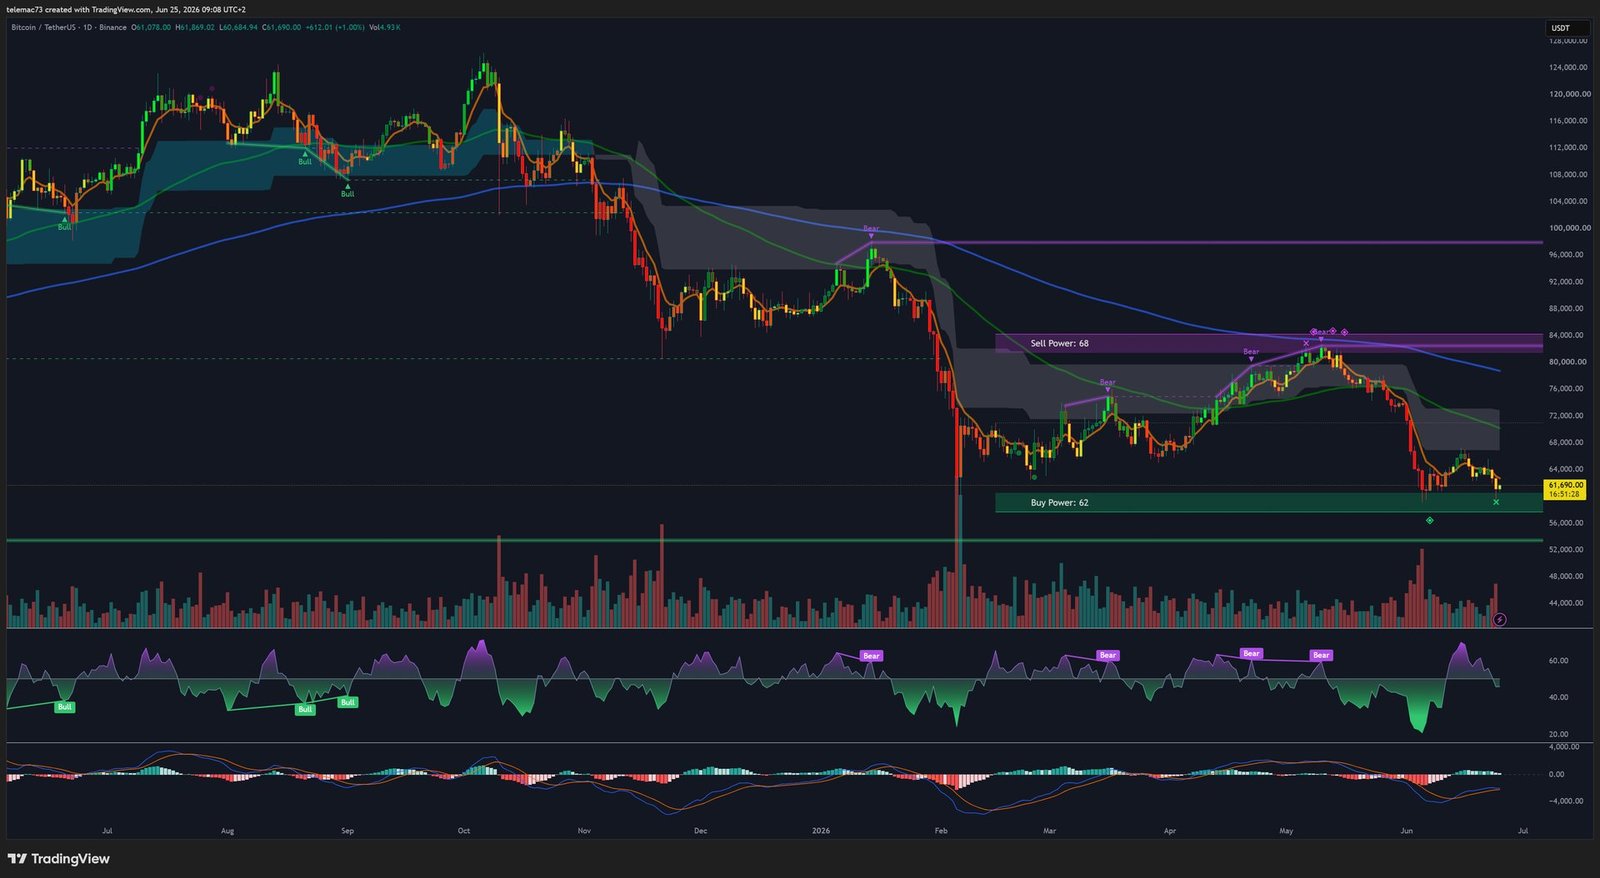
The digital asset ecosystem is navigating a period of major structural recalibration in June 2026. Bitcoin (BTC), the benchmark and barometer of this ecosystem, is oscillating around critical technical levels following a brutal correction of over 50% from its all-time high set in October 2025. The convergence of restrictive macroeconomic forces, unprecedented ETF capital outflows, and a complex market microstructure demands a thorough, multi-dimensional analysis.
Part I: Macroeconomic Context — The Forces Driving the Market
1.1 The Fed Under Warsh: Monetary Hawkishness and Total Uncertainty
The Federal Reserve’s approach under Chairman Kevin Warsh has become firmly hawkish. The sudden abandonment of forward guidance has triggered a violent repricing of interest rate expectations, mechanically penalizing non-yield-bearing assets like Bitcoin. Simultaneously, the Fed’s banking supervision division was reorganized, eliminating crypto-specific oversight in favor of a broader risk assessment — an ambiguous signal that has amplified institutional risk aversion in the near term.
1.2 The SpaceX IPO and the AI Rotation: A Massive Liquidity Vacuum
The launch of the largest IPO in history — SpaceX on the Nasdaq in June 2026 — has diverted massive capital flows away from the crypto sphere into the technology sector. Market participants now overwhelmingly favor the volatility and potential returns of the artificial intelligence trade, leaving Bitcoin starved of demand catalysts. Competition from tech giants (Samsung, SK Hynix) is further eroding BTC’s relative appeal as a speculative store of value.
1.3 The US-Iran Peace Deal: The Vanishing Risk Premium
The formal signing of the US-Iran peace agreement on June 19, 2026 drastically reduced the geopolitical risk premiums that have historically supported Bitcoin as an alternative safe-haven asset. Paradoxically, this stabilization eliminated a key defensive buying narrative, forcing BTC to trade almost exclusively on its intrinsic fundamentals and liquidity flows — which were precisely in a phase of contraction.
Part II: Capital Flows Anatomy and Market Microstructure
2.1 The Bitcoin Spot ETF Hemorrhage: $8 Billion in Outflows
Bitcoin spot ETFs — which had been the primary fundamental driver of BTC’s ascent to all-time highs in 2025 — are experiencing an unprecedented capital hemorrhage in June 2026. June 23 alone recorded $113.78 million in net outflows, dominated by a massive single-day withdrawal of $182 million from BlackRock’s iShares Bitcoin Trust (IBIT).
| Key Market Metric (June 2026) | Value |
|---|---|
| Total ETF Outflows (June 2026) | $8,000,000,000 |
| Net ETF Outflows YTD (2026 Cumulative) | $3,100,000,000 |
| Daily Net Outflows (June 23) | $113,780,000 |
| Single-Day IBIT Outflow (June 23) | $182,000,000 |
| Global Bitcoin ETF AUM | > $105,000,000,000 |
| Circulating Supply | ~20,050,000 BTC |
| Bitcoin Market Dominance | 58.2% |
2.2 Rising Dominance: The Internal Flight to Quality
Despite the institutional capitulation via ETFs, Bitcoin’s dominance has risen significantly to 58.2% of the global crypto market — a classic bear market dynamic. Meme coins see their trading volume share collapse to just 12.17%, while Layer-1 protocols reach 32.87%, signaling a clear preference for technological utility over pure speculation. Notably, the 30–45 age cohort is the only demographic segment to have increased its market share (36% → 38%), suggesting a maturing investor base oriented toward long-term accumulation.
2.3 Cascading Liquidations: $838 Million in 24 Hours
Client positioning reveals a striking imbalance: 85.7% long vs. 14.3% short as of June 22 — a powerful contrarian signal. The breach of the $60,000 psychological threshold on June 24 (intraday low: $59,023) triggered $838.10 million in forced liquidations across the crypto market in 24 hours. This self-reinforcing feedback loop — margin calls → forced market sells → further liquidations — exemplifies the systemic destruction of a cascading long squeeze.
Part III: Multi-Timeframe Technical Analysis
3.1 Order Book Heatmap: An X-Ray of Liquidity
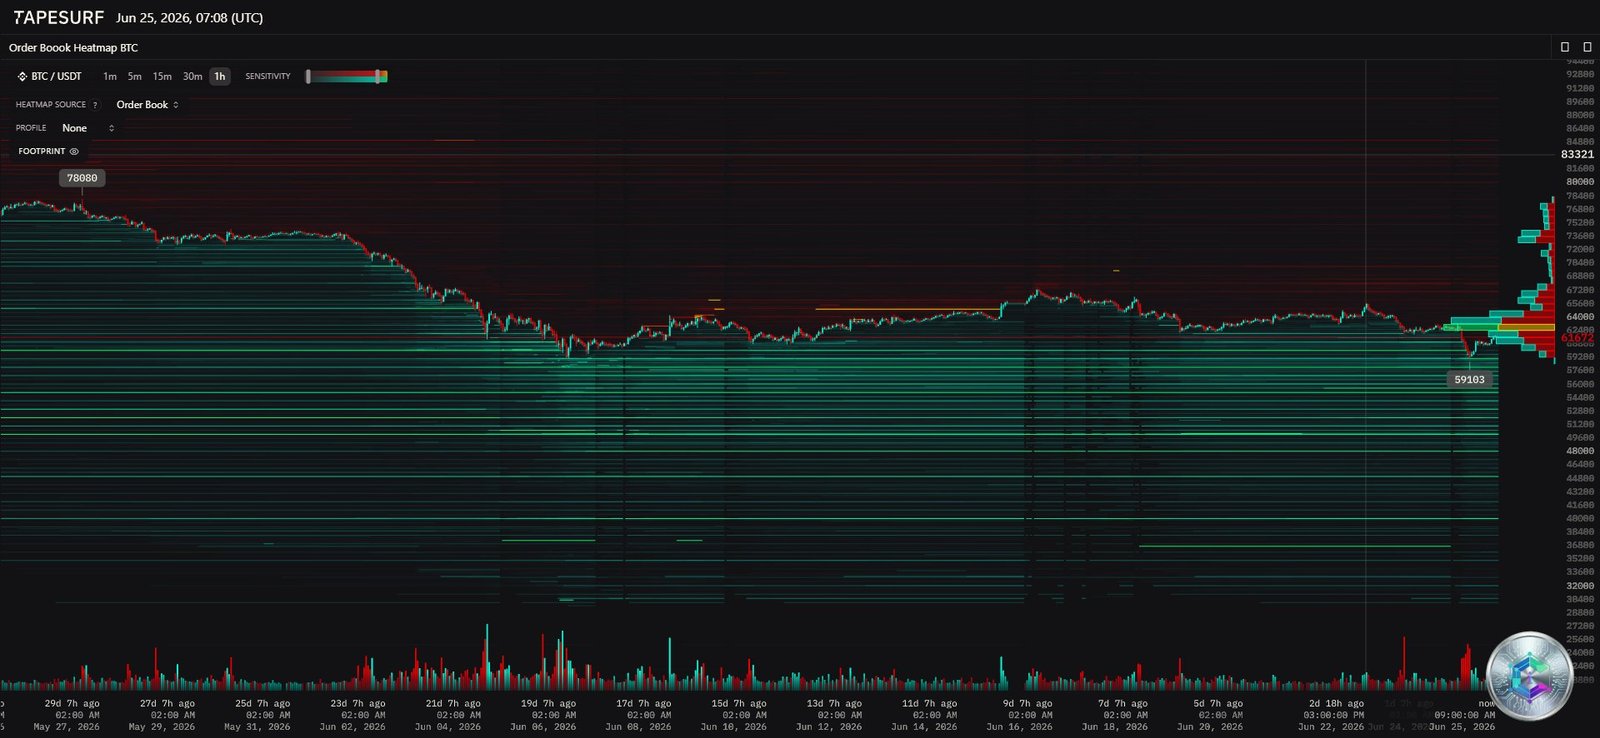
- Institutional Resistance: Dense concentration of sell walls above $65,000, becoming extremely thick toward $67,000 and $70,000 — institutional distribution zones corroborated by ETF outflow data.
- Absorption Support: Thick green bands concentrated between $59,000 and $61,000 acted as an absorption cushion during the flash crash. The $59,183 band represents a major inflection point.
- Central Liquidity Void: Between $62,000 and $64,500, Heatmap intensity is notably thin — explaining why the price can swing thousands of dollars on minimal volume within this range.
3.2 Daily Chart (1D): Death Cross and Structural Bear Market
Bitcoin is trading below all major moving averages: SMA 20 ($63,539), SMA 50 ($71,813), SMA 100 ($72,235), and SMA 200 ($76,587). The SMA 50 is converging toward a Death Cross with the SMA 200 — a mathematical confirmation of a secular bear market. The daily MACD histogram remains deeply negative, classifying any price bounce as a technical correction within a broader downtrend.
3.3 4-Hour Chart: Bear Flag and Volatile Compression
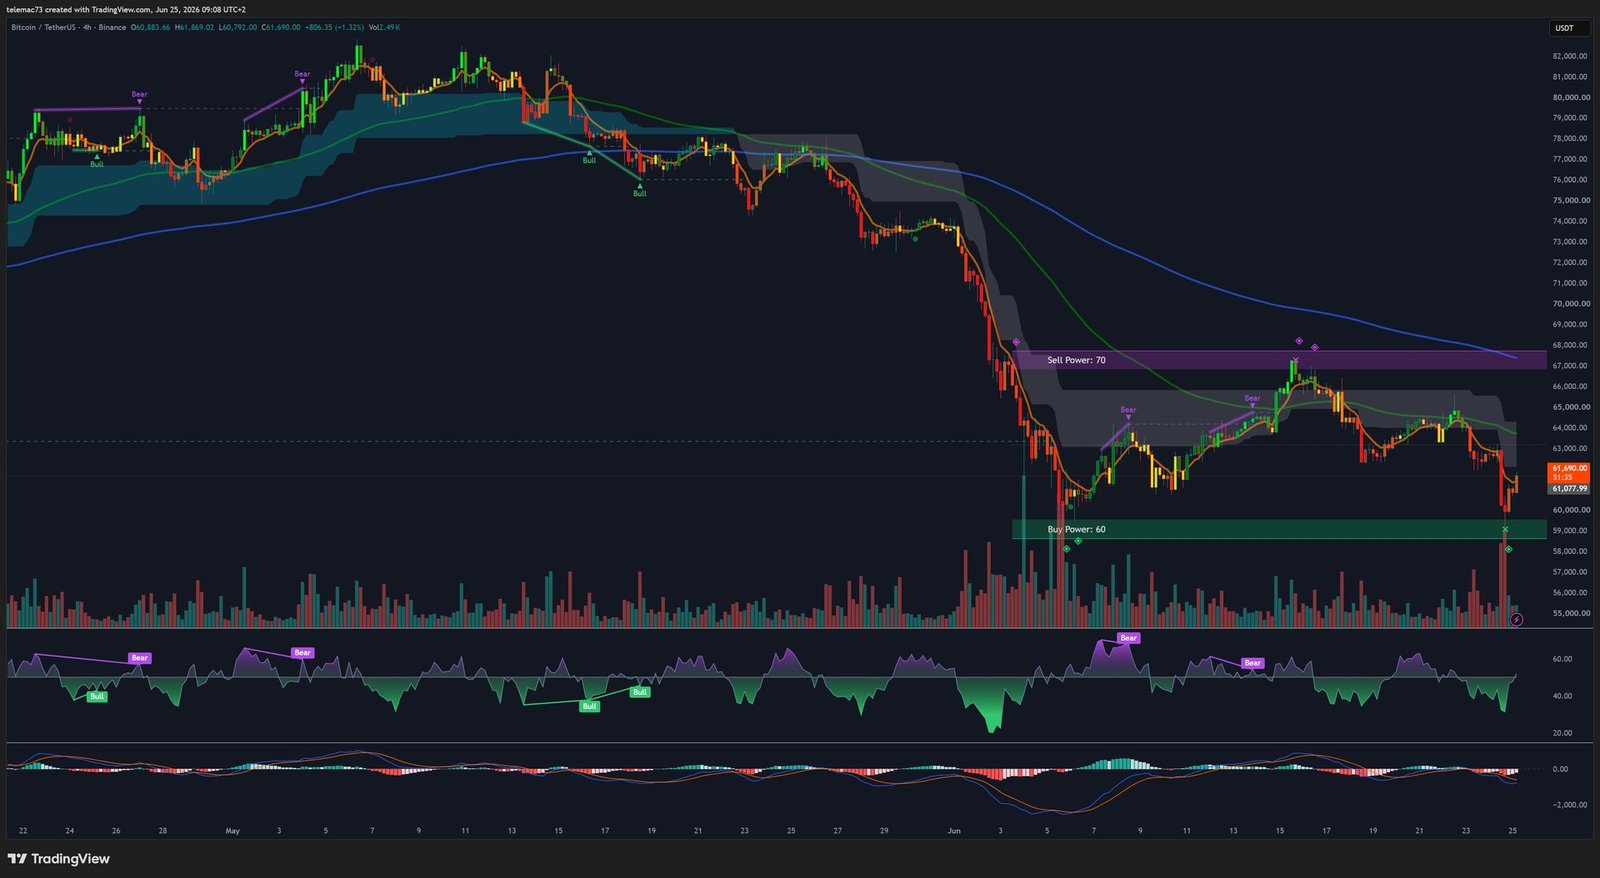
The relief rally following the liquidation cascade (toward $66,000) painted a textbook Bear Flag — a narrow ascending channel with declining volume following a violent bearish impulse. The failure to hold above $66,000 resolved the flag to the downside, pulling the price back to $63,900–$64,000. However, the 4H MACD is attempting a minor Golden Cross below the zero line, indicating a fragile short-term stabilization.
3.4 15-Minute Microstructure: Compression Triangle and Kinetic Energy
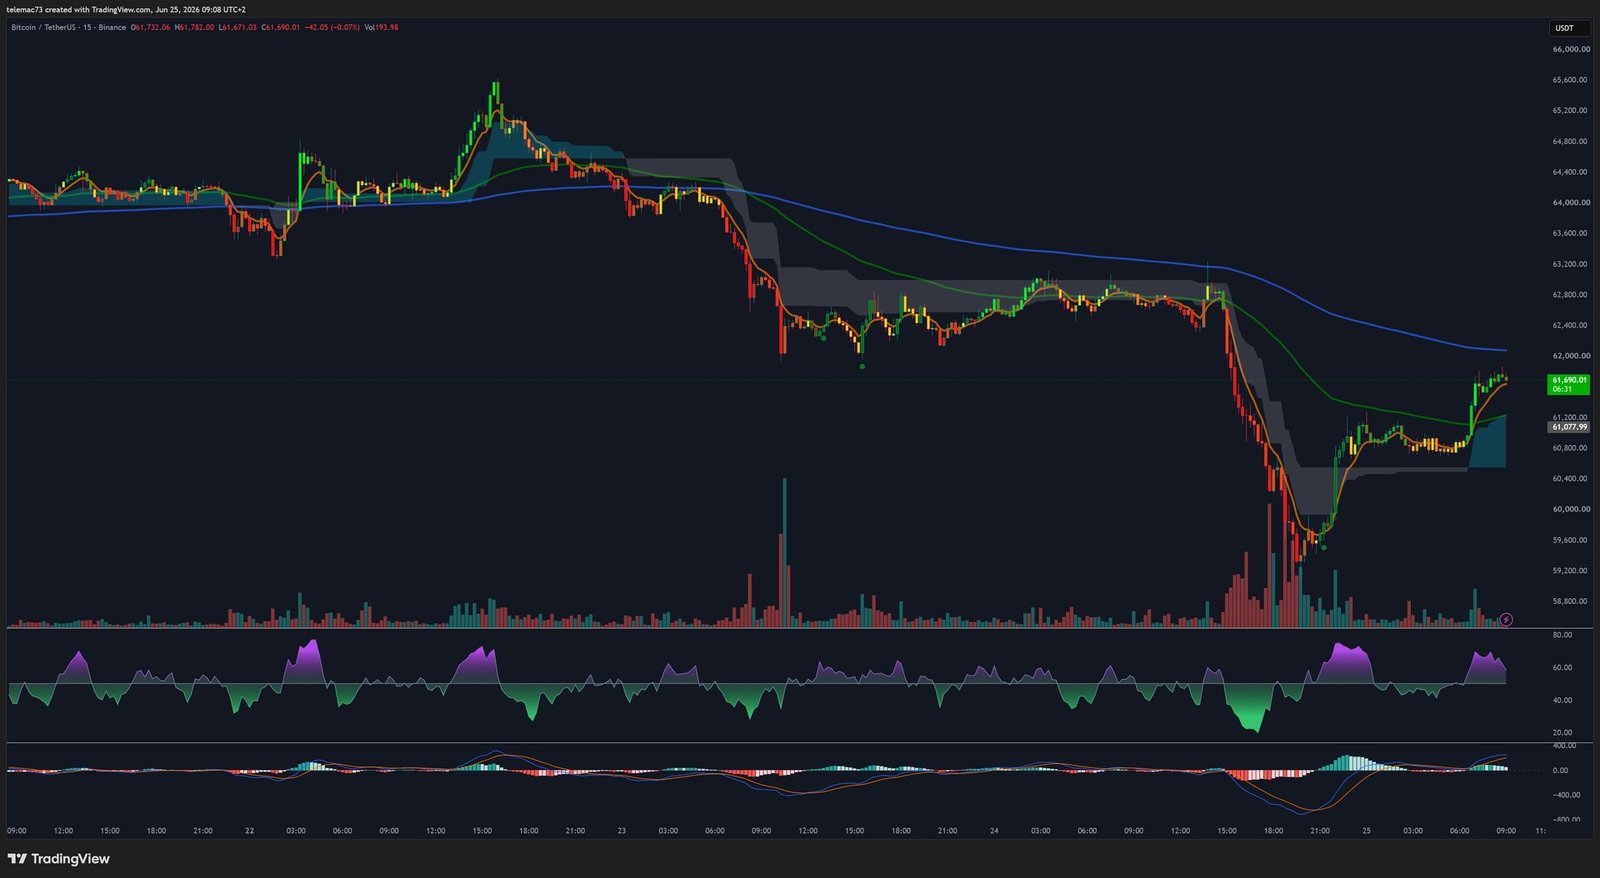
Following the $838M liquidation purge, a rapid V-shaped recovery formed on the 15-minute chart. Price subsequently entered an asymmetric compression triangle (pennant) above $61,000. With volatility cycling through an extreme compression phase, kinetic energy is accumulating — a violent directional breakout is imminent. The RSI is oscillating wildly between overbought (>80) and oversold (<20), characteristic of an algorithm-driven market awaiting a macroeconomic catalyst.
3.5 Critical Technical Level Map
| Category | Price Level (USD) | Implication |
|---|---|---|
| Macro Resistance (R2) | $86,704 | Bullish extension target post-pivot |
| Intermediate Resistance (R1) | $80,136 | Classic upper pivot zone; massive supply area |
| Central Pivot Point | $76,265 | Medium-term theoretical equilibrium |
| Fibonacci 50% Resistance | $68,000 | 50% retracement of the May–June decline |
| Critical Fib 44% Resistance | $67,000 | Key level to invalidate the bearish bias |
| POI Zone (sellers) | $65,000–$66,000 | Point of Interest — short entry initiation zone |
| Current Price | ~$64,035 | Below all major SMAs |
| Absorption Support (S1) | $61,000–$63,000 | Demonstrated institutional Buy Power |
| Psychological Support | $60,000 | Vital frontier — daily close below = capitulation |
| Extreme Support / Wave 5 Target | $59,023 | Recent low — Elliott Wave 5 completion target |
Part IV: Oscillators and Quantitative Modeling
RSI (14-day): Currently reading between 35.43 and 41 — a zone of pronounced weakness, yet not the extreme capitulation territory (below 30) typically associated with confirmed bottoms. The overall weakness structure has not been seen with such persistence since the 2022 crypto winter, suggesting a bottoming process may be underway, conditional on macroeconomic stability.
Williams %R: At 70.437, confirming continuous selling conditions. ADX (14-day): At 36 — well above the 25 threshold, confirming a strong, directional bearish trend with genuine institutional conviction behind the selling pressure. Elliott Wave: Bitcoin appears to be deploying the 5th and final impulse wave of a major corrective cycle, with the projected target coinciding precisely with the $59,000 zone. Completion of this wave would theoretically open the door to a new bullish impulse or a complex ABC corrective rebound.
Part V: Historical Parallels — 2024 vs. 2026
The summer of 2024 provides a near-perfect analytical mirror: the German government liquidated confiscated Bitcoin holdings in waves, while the Mt. Gox trustee distributed 140,000 BTC (worth ~$9 billion) to 127,000 creditors — creating a combined supply overhang of nearly $12 billion. The collective fear of market flooding was immense. Yet the market absorbed the shock and survived.
In 2026, the challenge is financially equivalent in magnitude (~$8 billion in ETF outflows) but structurally different in nature: these are voluntary institutional withdrawals driven by macroeconomic risk aversion, not forced liquidations from court-ordered processes. This voluntary nature means these capital flows could reverse with significant velocity the moment monetary conditions ease — unlike the irreversible 2024 sell-offs. Nevertheless, the immediate impact on order book depth is identical: a dramatic thinning of bid-side liquidity.
Part VI: Strategic Scenarios
🔴 Bearish Scenario: Systemic Structural Breakdown (High Tactical Probability Short-Term)
If ETF outflows maintain their pace (above $100M/day) and Bitcoin fails to defend the $61,000–$63,000 absorption zone, a decisive daily close below $60,000 would trigger a new cascade of forced liquidations — potentially exceeding the $838M event of June 24. Price would then be drawn toward the recent low of $59,023 and into uncharted territory toward the 2024 consolidation lows.
🟢 Bullish Scenario: Organic Resilience and Directional Reversal (Conditional Validation)
- Reclaim $65,000 with a decisive close — neutralizing algorithmic selling pressure and dismantling the Bear Flag narrative.
- Break $67,000 on a weekly close — invalidating the bearish thesis and triggering a short squeeze against leveraged sellers.
- Extension targets: $68,000 (Fib 50%), $70,000 (Fib 61.8% — the sellers’ Maginot Line), $74,000 (Fib 78.6% — full bull market resumption).
Strategic Conclusion
Bitcoin is undergoing an asymmetric stress test. The toxic convergence of a hawkish Fed, historic AI euphoria centered around the SpaceX IPO, and $8 billion in ETF outflows has drained the immediate catalysts for price appreciation. Technically, the asset is trading below all major moving averages with lethargic momentum, threatening to complete Elliott Wave 5 toward $59,000.
Yet the resilience of on-chain metrics — 58.2% dominance, a maturing investor demographic, and demonstrated institutional absorption at $59,000–$61,000 — testifies to a robust underlying infrastructure. Patient capital is silently accumulating the volatility shed by fearful speculative capital. The trajectory for the next quarter will ultimately hinge on the fragile equilibrium between exogenous macroeconomic shocks and the market’s ability to vigorously defend the $60,000 floor. As Bitcoin has proven repeatedly — from the German government’s 2024 sell-offs to the Mt. Gox distributions — this decentralized financial protocol possesses a unique and demonstrated capacity to absorb and survive even the most severe systemic imbalances in global capital flows.
⚠️ Disclaimer: This article is written for educational and informational purposes only. It does not constitute investment advice or a recommendation to buy or sell any digital asset. Cryptocurrency markets are highly volatile and carry significant risk of capital loss. Please consult a licensed financial advisor before making any investment decisions.

