


As June 2026 draws to a close, Bitcoin (BTC) is trading at a pivotal crossroads near $64,000, caught between a restrictive macroeconomic backdrop and an unprecedented acceleration in institutional adoption. Between the Federal Reserve’s hawkish pivot, a new generation of ETFs, and a multi-timeframe technical compression, the leading crypto asset is bracing for a major directional move.
A resolutely hawkish Fed under Kevin Warsh
The June 17, 2026 FOMC meeting, the first chaired by new Fed Chair Kevin Warsh, kept the federal funds rate range unchanged at 3.50%-3.75% in a unanimous vote. While the pause was largely expected, it was the dot plot that rattled markets: nine committee members now anticipate at least one more rate hike before year-end, six of them expect two. Only one member projected a cut — a striking contrast to expectations earlier in the year.
This hawkish revision is rooted in PCE inflation revised up to 3.6% for 2026 (from 2.7% in March) and a US labor market that remains remarkably resilient. For Bitcoin, the « higher-for-longer » mantra mechanically raises the opportunity cost of holding a non-yielding, highly volatile asset — largely explaining the repeated failure to break the $67,000 resistance in recent weeks.
A fragile Middle East ceasefire: relief under tension
The mid-June announcement of a 60-day ceasefire between the US and Iran, brokered in Switzerland, triggered a sharp risk-on rotation: WTI crude fell back toward $80, fueling a BTC rebound past $64,000 and toward $66,500, accompanied by significant short squeezes. However, conflicting claims about the closure of the Strait of Hormuz — denied by US CENTCOM — quickly dampened the optimism and pushed traders back into a cautious, risk-management posture.
Franklin Templeton’s DRIP ETFs: a new kind of structural demand
The month’s most consequential development remains Franklin Templeton’s (a $1.78 trillion asset manager) filing for two novel ETFs: the Franklin US Equity Bitcoin DRIP Index ETF and the Franklin US Innovation Bitcoin DRIP Index ETF. The mechanics: 95% of the portfolio in large-cap US equities, 5% in Bitcoin exposure, with equity dividends automatically reinvested into Bitcoin rather than distributed in cash, capped at 20% exposure during quarterly rebalances.
This structure could effectively turn Bitcoin into a passive institutional liquidity sponge — a recurring, price-agnostic source of demand entirely decoupled from the usual cyclical market sentiment. Regulatory approval isn’t expected before September, but the signal already sent to smart money is significant.
On-chain: whale accumulation versus retail panic
The market shows a sharp dichotomy. Between June 11 and 13, entities holding between 100,000 and 1 million BTC added roughly 11,000 BTC to their balances, corroborated by continued net outflows from centralized exchanges into cold storage. Meanwhile, the Fear & Greed Index dropped to 15, a level of extreme fear typically associated with retail panic selling. Yet net realized losses are shrinking — 234,000 BTC versus 400,000 BTC during the previous major liquidation wave at comparable price levels — suggesting weak hands have largely already capitulated.
Price is also trading dangerously close to many miners’ average production cost, a structural stress that historically coincides with the final stages of a bear market capitulation rather than its beginning.
Liquidation heatmap: the tension zones to watch
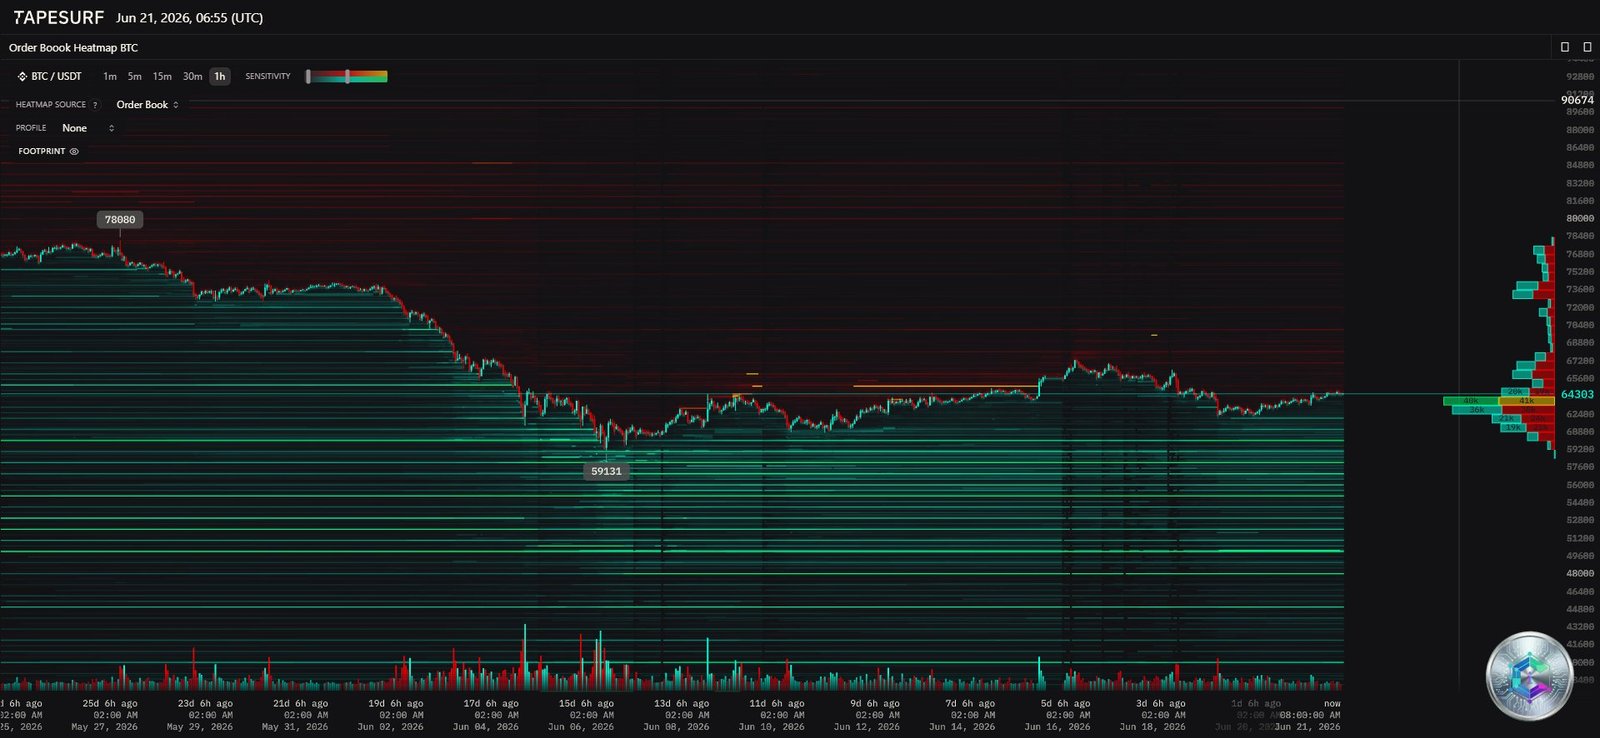
The heatmap reveals significant liquidity pockets above current price: the immediate friction zone between $65,000 and $67,000 could fuel a short squeeze, while the round-number psychological thresholds of $80,000, $90,000 and $100,000 act as longer-term magnets.
To the downside, a significant liquidity void has been identified below $60,000. A decisive break of this support could open the door to a liquidation cascade toward the $54,000-$55,000 zone — a scenario already partly materialized in early June, when $1.73 billion in positions were liquidated in 24 hours. Dense options positioning around the $65,000 strike also generates a volatility-dampening effect via dealer delta-hedging, helping explain the current sideways consolidation.
Multi-timeframe technical analysis
Daily chart: MA-50/MA-200 compression
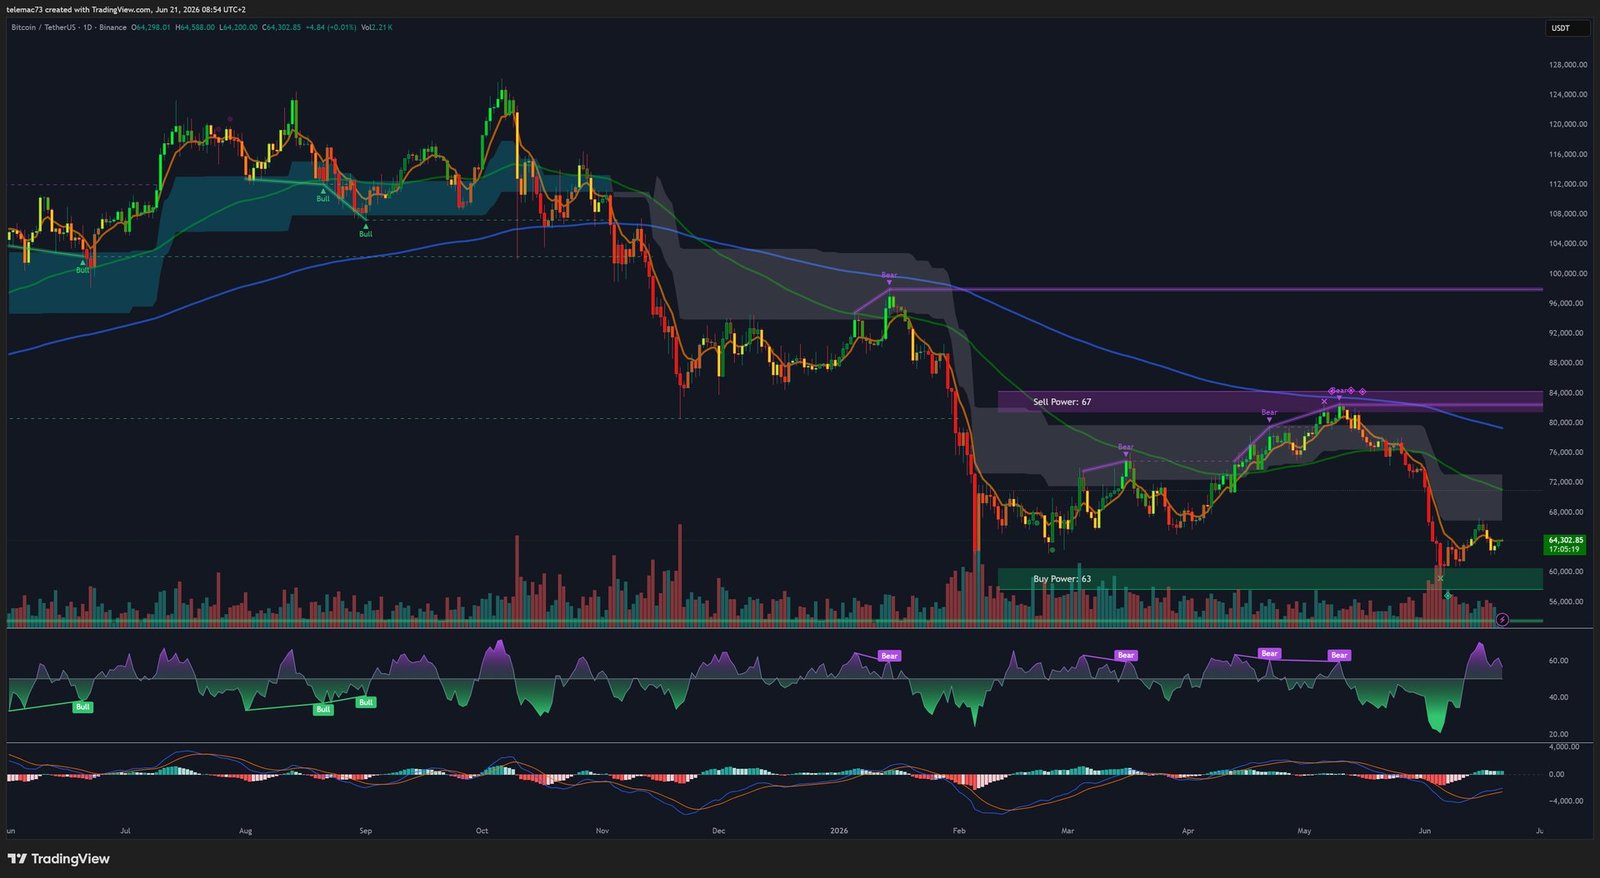
Bitcoin is trading in a dangerous compression zone between its 50-day moving average, acting as dynamic resistance, and its 200-day moving average, acting as structural trend support. A bearish crossover of these two averages would confirm a Death Cross — historically a bearish signal for quant algorithms. Conversely, a clean reclaim of the MA-50 would open the door to a potential future Golden Cross.
The daily RSI, after dipping below 30 during the slide toward $60,900, has begun a quiet climb toward the neutral 45-50 zone even as price chops sideways — a hidden bullish divergence suggesting selling pressure is fading. The MACD, meanwhile, is flattening sharply near the zero line, a classic precursor to a coming volatility expansion.
4-hour chart: compression triangle and bull flag
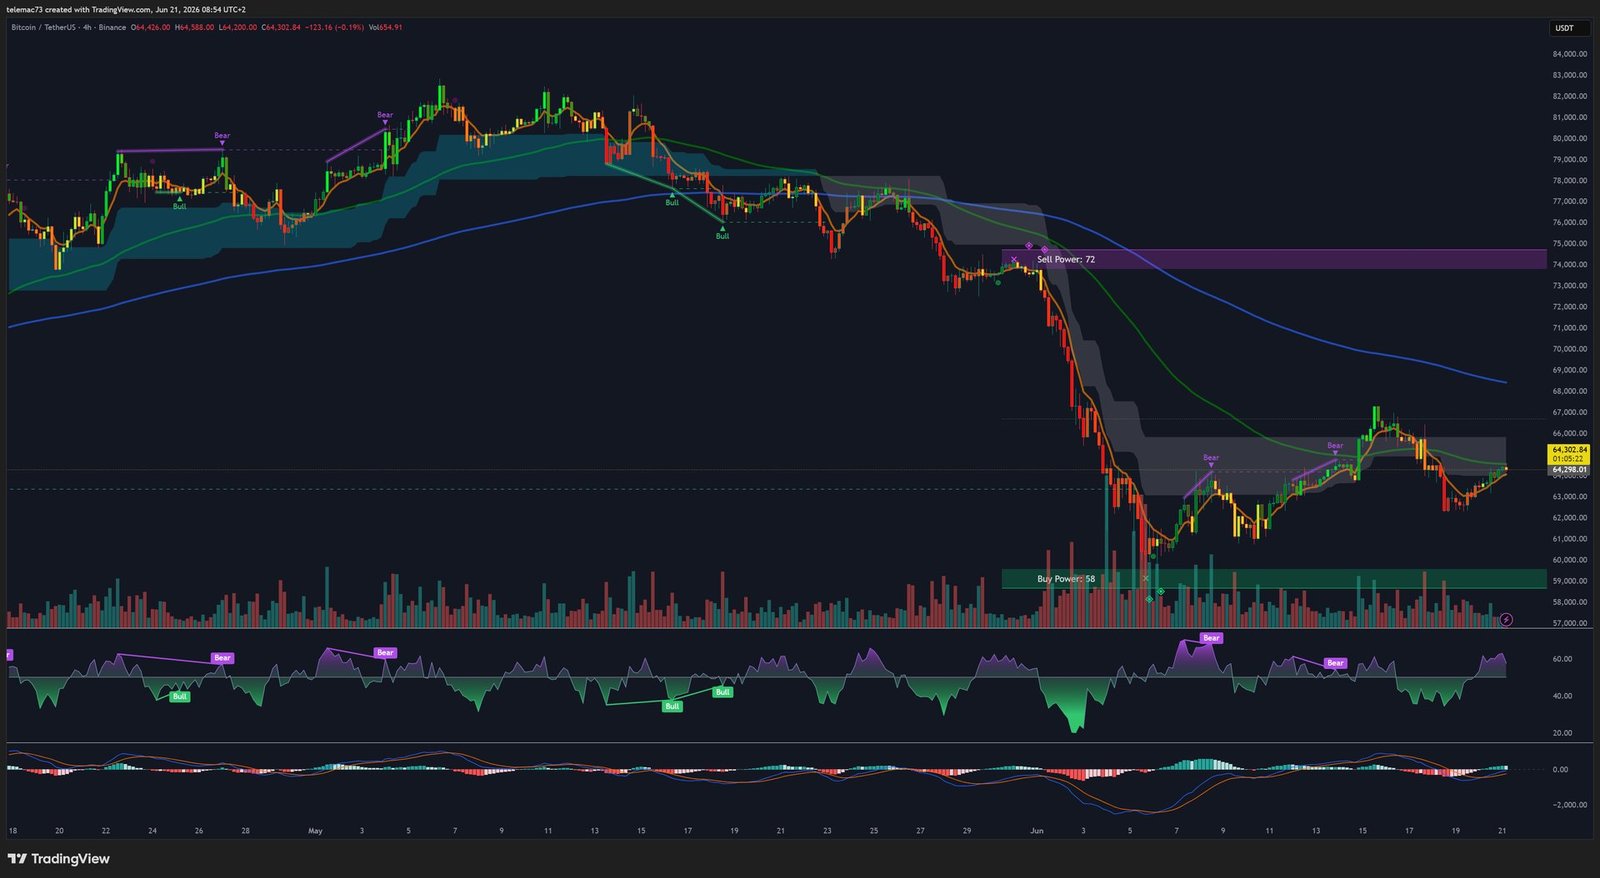
After a string of bear flags during the decline from local highs, the ceasefire-driven rebound toward $66,500 has since given way to a descending channel — a potential bull flag whose validation requires a high-volume breakout to the upside. Simultaneously, a compression triangle is forming between rising lows since $60,000 and a relatively flat ceiling around $64,500-$65,000, reflecting the precarious balance between buyers and sellers ahead of the next directional impulse.
15-minute chart: algorithmic noise and liquidity sweeps
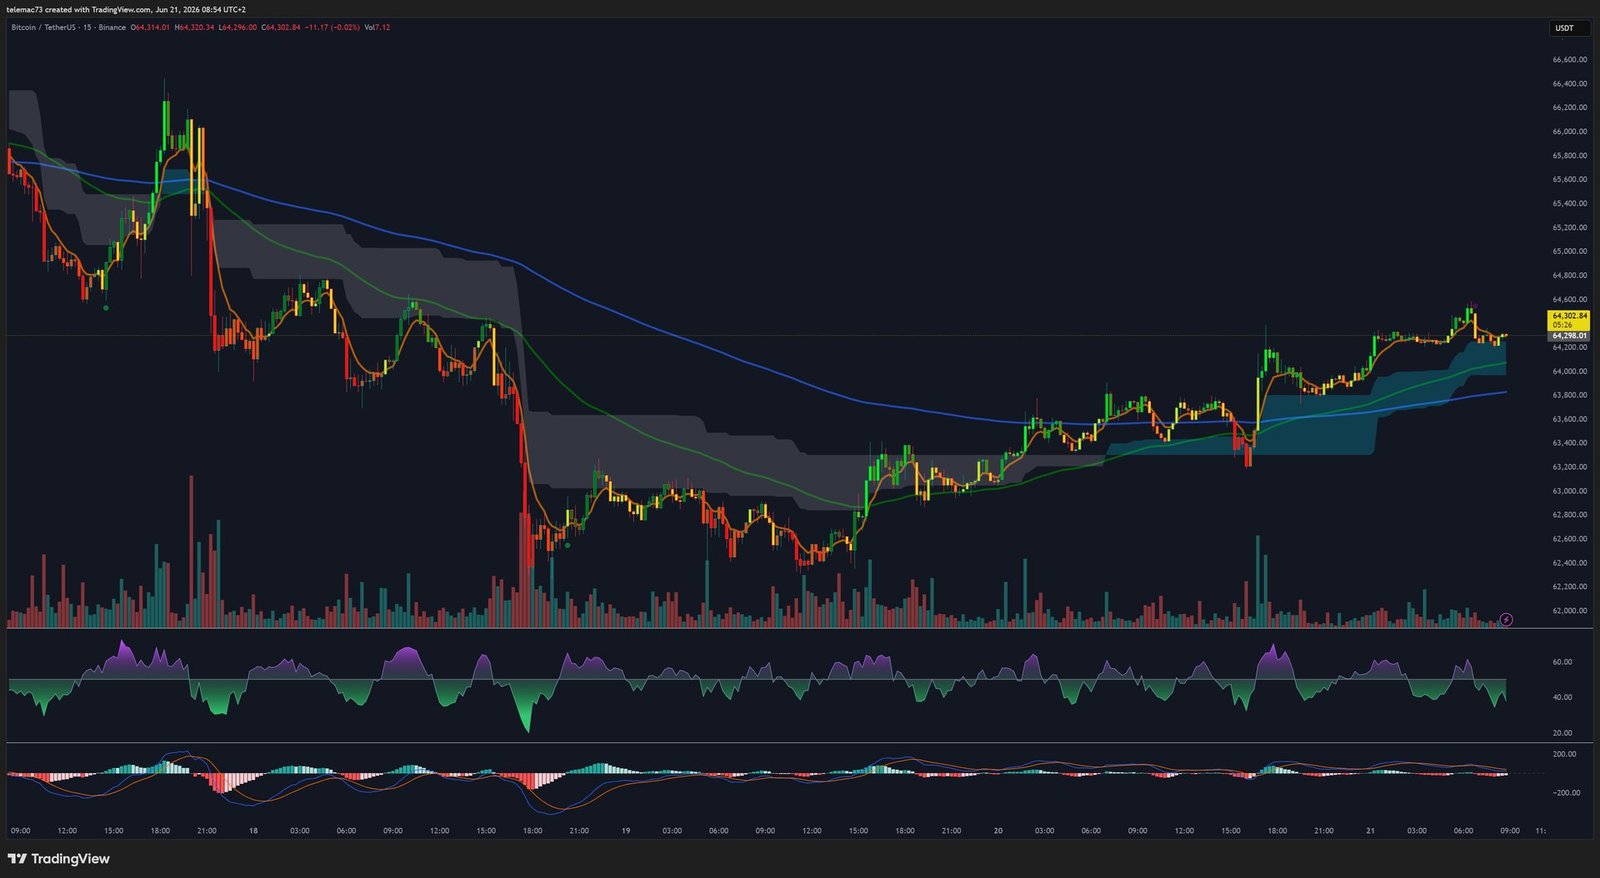
On this microscopic timeframe, dominated by algorithmic scalping and thin order-book depth, liquidity sweeps are frequent: violent wicks above recent highs and below recent lows designed to trigger retail stop-losses. RSI frequently oscillates between overbought (>80) and oversold (<20) with immediate mean reversion, while the MACD whipsaws around zero — confirming the lack of a tradable directional trend on this timeframe.
Key levels to watch
| Level | Estimated price | Significance |
|---|---|---|
| Major resistance | $67,000 – $67,500 | Invalidates the local bearish bias, opens the path to new highs |
| Intermediate resistance | $64,500 – $65,000 | Barrier reinforced by options hedging activity |
| H4 pivot | $63,500 – $63,700 | Intraday demarcation line between buyers and sellers |
| Major support | $60,000 – $61,000 | Floor defended by on-chain accumulation and mining costs |
| Ultimate support | $54,000 – $55,000 | Target if a long liquidation cascade unfolds |
Outlook: between a macro powder keg and institutional fundamentals
Bitcoin at the end of June 2026 resembles a powder keg under high pressure. On one hand, the Fed’s restrictive monetary policy and Middle East geopolitical fragility feed the bearish case: a confirmed break of $60,000 would expose the asset to a cascade toward $54,000. On the other, on-chain flows show whales quietly absorbing the supply released by retail and miners, while the DRIP ETF innovation promises an unprecedented structural demand source, decoupled from the usual speculative cycle.
The resolution of this chart compression, visible on both the daily and H4 timeframes, will play out on the first impulsive break outside the current range. Holding above the $63,500 pivot combined with a confirmed break above $67,000 would open the door to a swift catch-up rally; conversely, losing $60,000 would technically validate the bearish scenario. In this thin-liquidity environment, priority should be given to closing confirmations on higher timeframes, filtering out the noise of intraday liquidity sweeps.
Disclaimer: This article is provided for informational and educational purposes only. It does not constitute investment advice, nor a recommendation to buy or sell. Cryptocurrency markets are highly volatile and carry significant risk of capital loss. Always do your own research (DYOR) before making any investment decision.

