


The Bitcoin (BTC/USDT) market is undergoing a major phase of volatility decompression and structural reorganization as of June 18, 2026. As new Federal Reserve Chairman Kevin Warsh signals an unmistakably hawkish stance, a historic US-Iran peace deal is reshaping the inflationary landscape. This report combines order book microstructure analysis via the TAPESURF Heatmap with a multi-timeframe chart review — daily, 4-hour, and 15-minute — to identify the key directional scenarios for upcoming trading sessions.
1. Macroeconomic Context, On-Chain Dynamics and Institutional Flows
The FOMC’s Hawkish Pivot Under Kevin Warsh
The June 16–17, 2026 Federal Open Market Committee (FOMC) meeting — Kevin Warsh’s first as Fed Chair — delivered an unexpectedly hawkish message. While holding the target rate steady at 3.50%–3.75% met near-unanimous market consensus (99.6%), the updated dot plot caught investors off guard:
- 9 of 19 FOMC members now project at least one rate hike before year-end 2026, with 6 expecting multiple increases.
- 5 members see the terminal rate reaching the restrictive 4.00%–4.25% range.
- Only one member projects a rate cut in 2026, pushing the easing cycle to 2027 or 2028.
Warsh also introduced a critical communication break by eliminating forward guidance entirely, stating that markets must react to real-time economic data rather than implicit central bank commitments. This « return to pure discretion » triggered an immediate 2%–4% drop in Bitcoin, pulling it from above $65,000–$66,000 into a $63,850–$64,400 trading range. Historically, Bitcoin has declined after every FOMC meeting since October 2025.
BTC/USD Post-FOMC Performance (Since October 2025)
| FOMC Meeting | BTC/USD Performance |
|---|---|
| October 2025 | -30.21% |
| December 2025 | -9.99% |
| January 2026 | -32.77% |
| March 2026 | -13.67% |
| April 2026 | -27.72% |
| June 2026 | -2.00% to -4.00% (immediate reaction) |
The US-Iran Peace Deal: A Major Disinflationary Shock
The Fed’s tightening comes as May inflation stood at a year-on-year rate of 4.2%, driven more than 60% by an energy price surge tied to Strait of Hormuz tensions. The announcement of a landmark US-Iran peace agreement — digitally signed on June 14 and set for physical ratification in Switzerland on June 19, 2026 — fundamentally shifts the inflation outlook. The deal guarantees permanent free passage through the Strait of Hormuz in exchange for progressive US sanctions relief and dismantlement of Iran’s nuclear enrichment infrastructure.
The agreement triggered an immediate 4% collapse in Brent crude to $75 per barrel. This powerful disinflationary force should, over the medium term, reduce pressure on the FOMC and dampen rate hike expectations — providing fundamental support for long-duration risk assets like Bitcoin.
On-Chain Dynamics and ETF Flows
- ETF Outflows: US spot Bitcoin ETFs recorded their 5th consecutive week of net outflows, totaling $316M in the week preceding the FOMC — despite a brief $85.8M inflow on June 13, led by BlackRock’s IBIT.
- Long-Term Holder Accumulation: Conversely, Long-Term Holders absorbed more than 125,000 BTC during June, signaling a major accumulation phase characteristic of cycle bottoms.
- MicroStrategy (MSTR): Acquired an additional 1,587 BTC for $100M (June 8–14), bringing total holdings to 846,842 BTC — a strong institutional conviction signal.
2. Market Microstructure: TAPESURF Heatmap Analysis
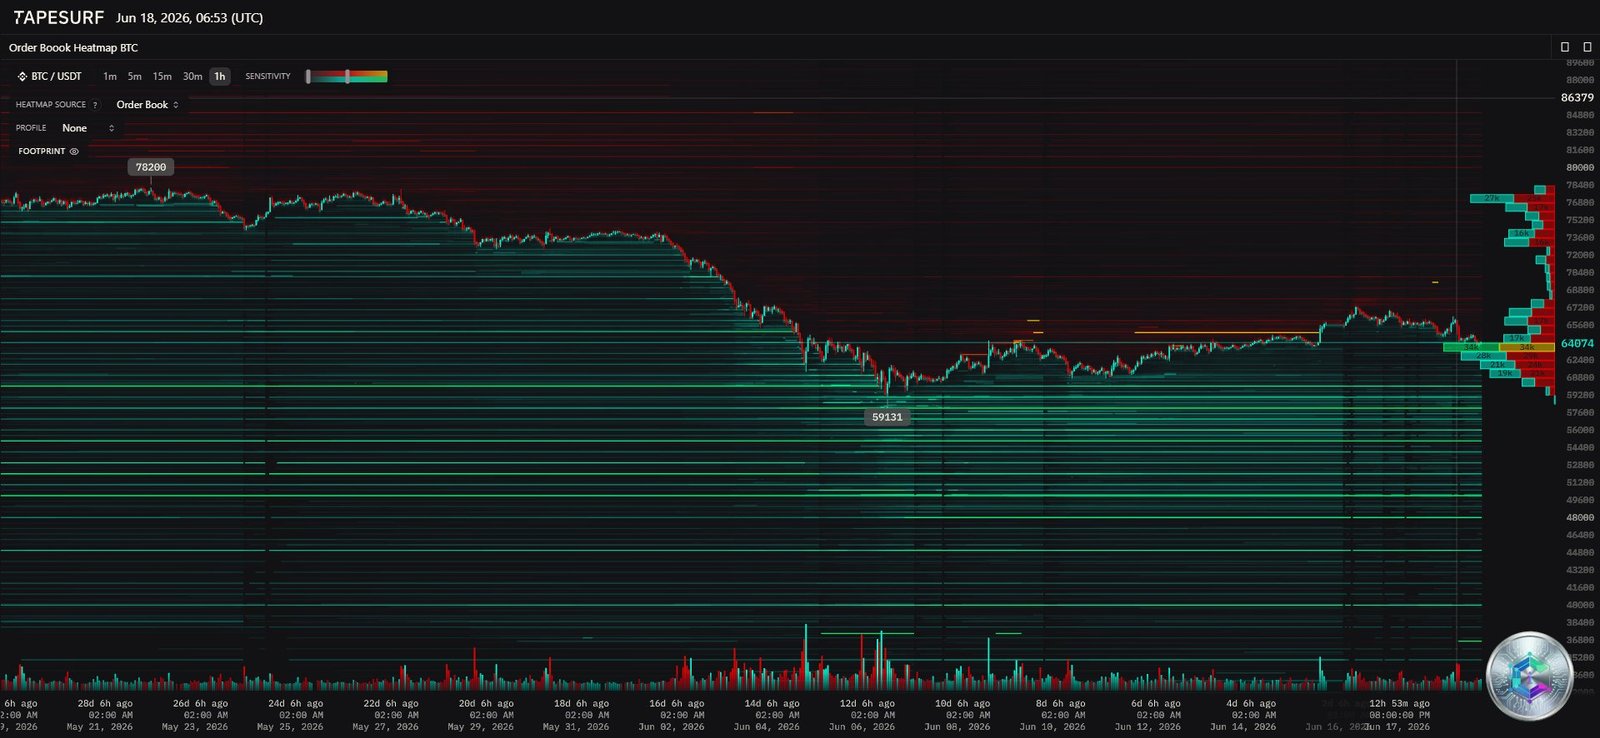
Bid-Side Analysis (Buy Orders)
The order book reveals a massive concentration of buy-side liquidity in the $58,000–$60,000 zone, represented by dense green horizontal bands on the heatmap. The most recent cycle low is anchored at $59,131, a critical support level with extremely high order density. Closer to the current price, intermediate buy blocks are stacked at $62,000 and $61,000, reflecting a measured absorption strategy by market makers. Volume profiling confirms large buy order clusters of 27K, 30K, and 34K BTC positioned just below the current price.
Ask-Side Analysis (Sell Orders)
The supply distribution reveals a major resistance barrier beginning at $66,000, extending densely to $68,000. This red zone confirms that sellers are actively capping any recovery attempts above the post-FOMC pivot. Further out, the heatmap identifies a historically thick sell wall at $78,200, representing the ultimate distribution target in the event of a macro bullish reversal.
3. Multi-Timeframe Technical Analysis
3.1 Daily Chart — The Macro Trend
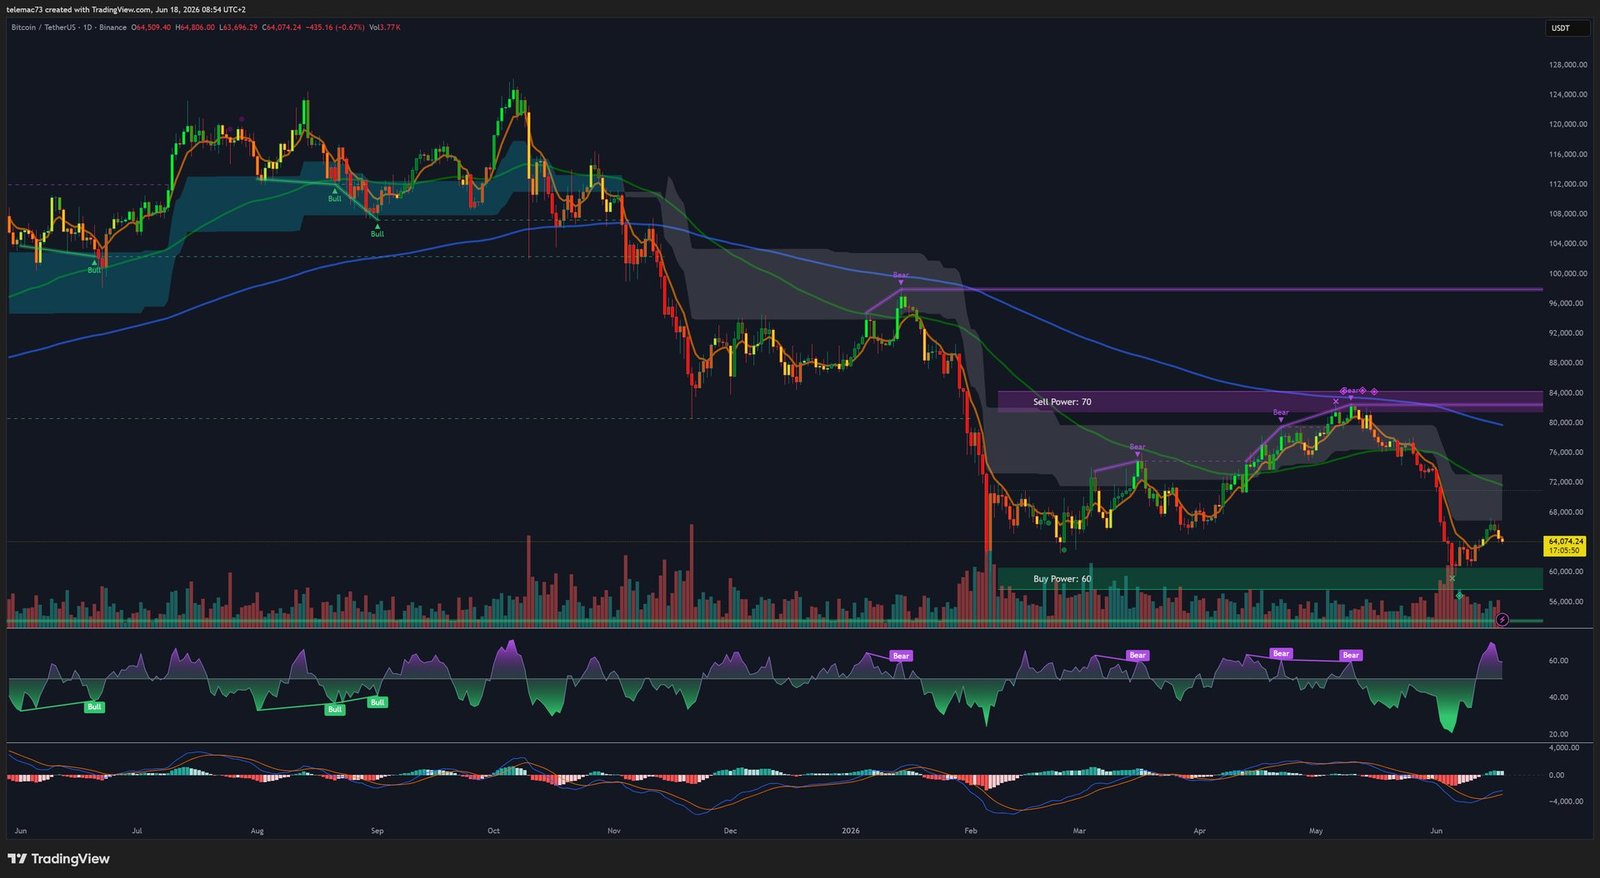
The daily timeframe shows an orderly correction structure following a historic high above $130,000. Key technical features include:
- Active Death Cross: The short-term moving average (green) crossed below the long-term moving average (blue) in late 2025, officially validating the transition from a macro bull market to a structural correction phase.
- « Sell Power: 70 » Zone ($80,000–$84,000): Major macro resistance corresponding to a zone of massive institutional distribution.
- « Buy Power: 50 » Zone ($59,000–$61,000): Long-term macro support level, vigorously defended during recent corrections.
- 14-day RSI at 41.38: Neutral to slightly bearish — no extreme oversold condition, meaning additional downside remains technically possible.
- MACD (12,26,9) at 1,295.03: Neutral configuration, with lines flat near zero, confirming the absence of strong directional momentum.
3.2 4-Hour Chart — The Intermediate Structure
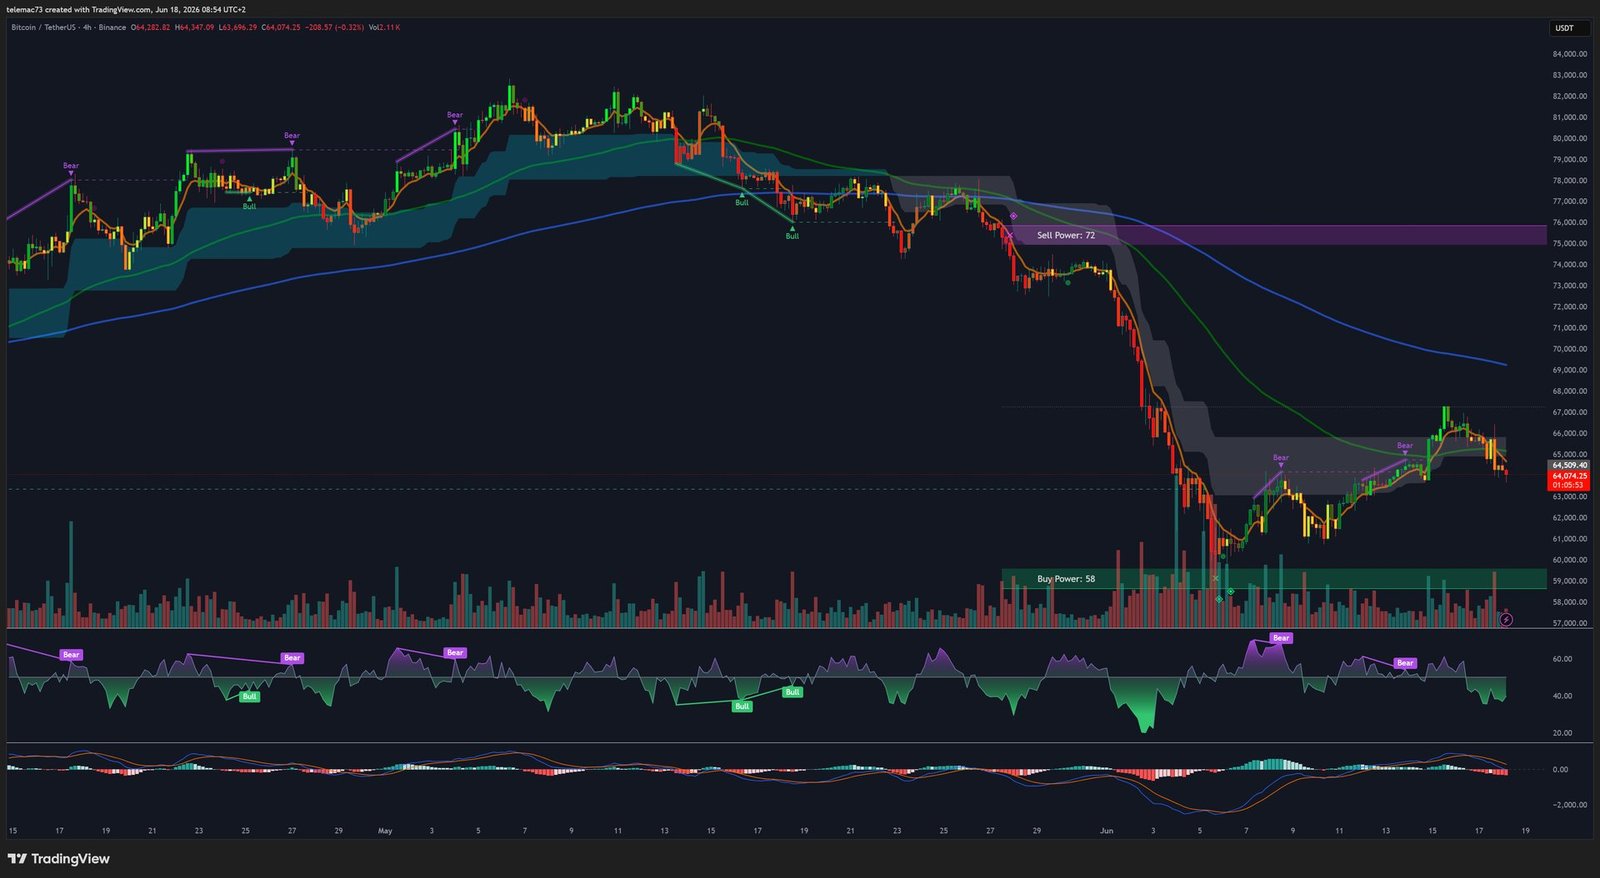
The 4-hour chart reveals clearly defined decompression chart patterns:
- Bear Flag: The impulsive move from $78,000 to $59,131 constitutes the « flagpole » (-24%). The subsequent ascending consolidation between $59,131 and $67,200 forms the flag channel. A confirmed break below $63,800–$64,000 would activate the figure’s theoretical bearish target.
- Rejection at $67,200: The June 15 bullish attempt was precisely rejected by the long-term moving average (blue), which is acting as formidable dynamic resistance.
- 4H RSI at 42: Trending downward, confirming buyers are losing momentum.
- 4H MACD: Bearish Death Cross initiated on June 16 below the zero line, accelerating the post-FOMC decline.
3.3 15-Minute Chart — Intraday Compression
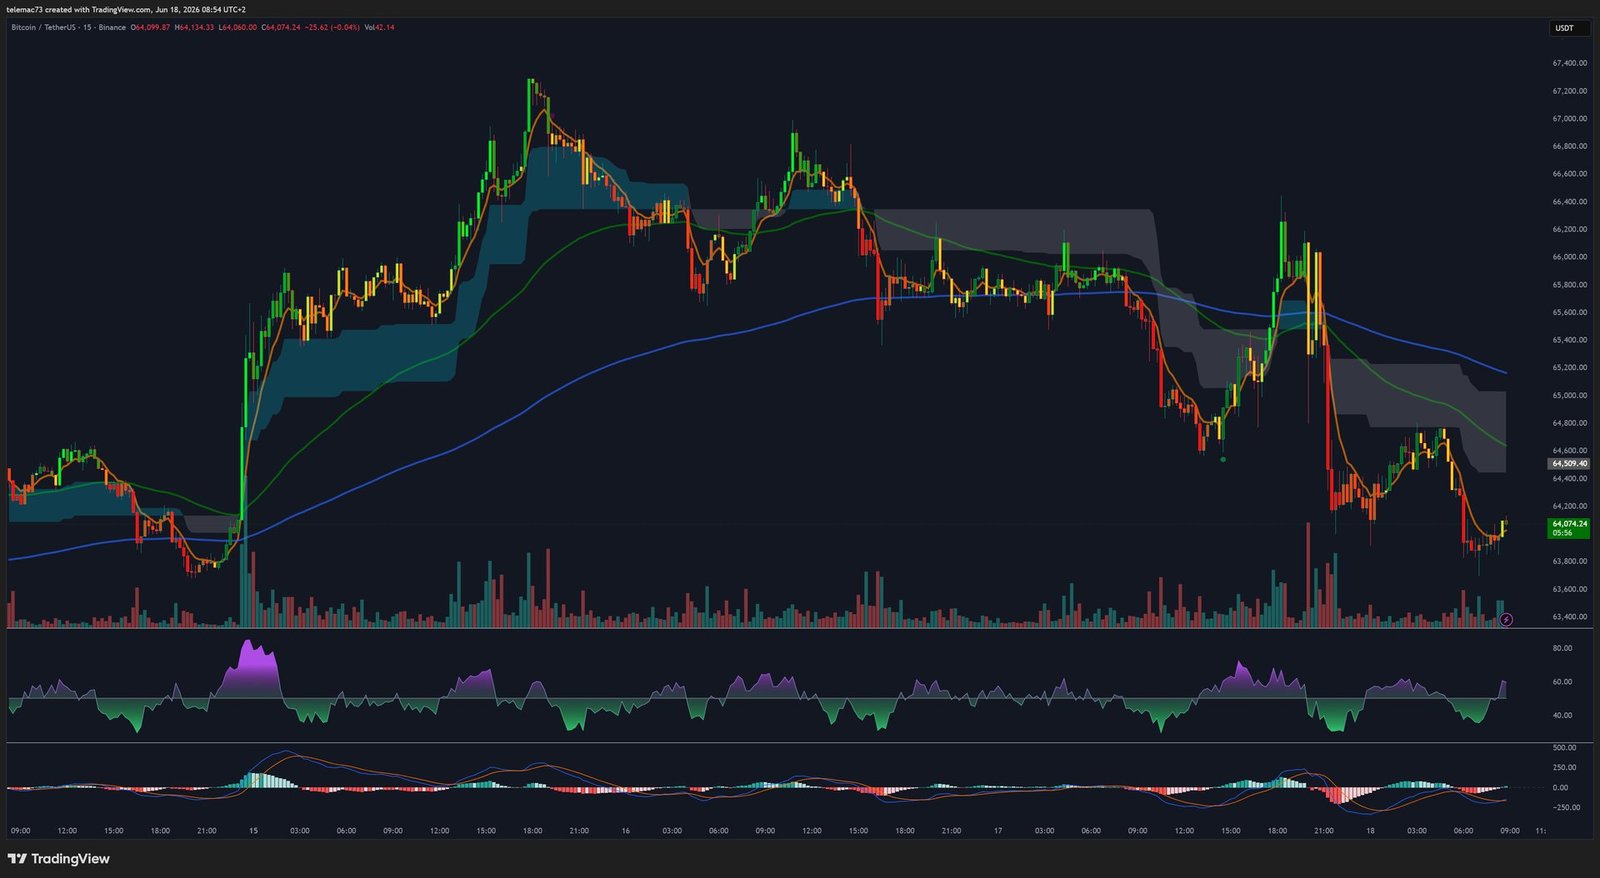
- Symmetrical Compression Triangle: Following the post-FOMC drop below $64,500, Bitcoin stabilized at $63,850 before entering a compression phase. Lower highs and higher lows form a symmetrical triangle whose apex sits at $64,100–$64,200 — a violent volatility expansion is imminent.
- Bearish resistance cloud: Price is trading beneath a resistance cloud (grey/blue shaded area), confirming short-term seller dominance.
- 15M RSI: Reached an extreme oversold reading of 22 during the June 17 sell-off, enabling a temporary technical bounce. MACD lines are extremely compressed near zero, reflecting the market’s wait-and-see stance ahead of the June 19 US-Iran signing.
4. Key Technical Levels Summary
| Level / Indicator | Value | Signal Type | Chart Role |
|---|---|---|---|
| Major Macro Resistance | $80,000–$84,000 | Technical (Daily) | « Sell Power: 70 » — Institutional distribution zone |
| Intermediate Resistance | $75,000–$76,000 | Technical (4H) | « Sell Power: 72 » — Top of previous channel |
| Short-Term Resistance | $66,000–$67,200 | Technical (4H/15M) | 4H long-term MA — Bear Flag upper boundary |
| Intraday Pivot | $64,100–$64,300 | Statistical | Triangle apex — post-FOMC equilibrium point |
| Short-Term Support | $63,800–$63,850 | Chartist (15M) | Triangle lower boundary |
| Intermediate Support | $61,000–$61,500 | Chartist (Daily) | Post-CPI low of June 10 |
| Major Macro Support | $59,000–$60,000 | Technical (Daily) | « Buy Power: 50 » — Long-term accumulation floor |
| Daily RSI | 41.38 | Neutral / Bearish | No extreme oversold — further decline possible |
| Daily MACD | 1,295.03 | Neutral | Loss of directional momentum |
| Daily Death Cross | Active | Macro Bearish | Green MA below blue MA since late 2025 |
| 4H Death Cross | Active | Medium-Term Bearish | Systematic rejection below blue MA at $67,200 |
5. Market Scenarios and Outlook
Bullish Scenario: Relief Rally and Triangle Breakout
For this scenario to materialize, Bitcoin must hold the critical $63,800 support and break upward out of the compression triangle above $64,300. The primary catalyst would be the official physical signing of the US-Iran accord on June 19, 2026, confirming a durable Brent decline below $75 and pushing markets to reassess the Fed’s rate hike trajectory downward.
A confirmed break above $66,000 would invalidate the Bear Flag structure, likely triggering a significant short squeeze toward the intermediate resistance zone at $75,000–$76,000. A return of positive ETF inflows would reinforce this move and open the path toward previous highs.
Bearish Scenario: Bear Flag Execution and Capitulation
Should Kevin Warsh’s restrictive monetary policy maintain ETF outflows and heighten macro uncertainty, a break below the triangle’s lower boundary at $63,800 would trigger the Bear Flag’s technical target. The first support objective sits at $61,000–$61,500, corresponding to the June 10 post-CPI reaction low.
In the event of panic or forced leveraged liquidations, price would test the historical liquidity wall in the $58,000–$60,000 zone (« Buy Power: 50 »). This level, aggressively defended by long-term holders and MicroStrategy’s systematic buying program, represents the ideal capitulation floor from which a new long-term bull cycle could emerge.
⚠️ Disclaimer: This article is written for educational and informational purposes only. It does not constitute investment advice or a recommendation to buy or sell any financial asset. Investing in cryptocurrencies carries significant risks, including the total loss of invested capital. Please consult a licensed financial advisor before making any investment decision.

