
In June 2026, Bitcoin (BTC) is trading around $61,600 — a nearly 50% discount from its all-time high of $126,198 set in October 2025 and a 27% loss year-to-date. The market is navigating a rare confluence of technical and macroeconomic pressure points, and the next directional move could be explosive.
Market Overview: Under Extreme Pressure
The first week of June left its mark: Bitcoin briefly broke the psychological support of $60,000, hitting an intraday low of $61,500 on June 4. This sudden capitulation triggered over $2 billion in forced liquidations across the global ecosystem — $1.8 billion in a single session. Futures markets were hit especially hard, with $800 million in leveraged long positions force-closed within 24 hours.

Macroeconomic Context: The Forces Orchestrating the Decline
The Kevin Warsh Era at the Federal Reserve
The American monetary policy landscape is undergoing a paradigm shift. Kevin Warsh was sworn in as the 17th Federal Reserve Chair on May 22, 2026, succeeding Jerome Powell amid intense political pressure. For markets, his first FOMC meeting scheduled for June 16–17, 2026 is of critical importance.
Implied probabilities from futures markets (CME FedWatch) estimate a 96%+ probability of rates held in the current 3.50%–3.75% range. The irony: facing persistent inflation, Warsh may be forced to consider rate hikes — the exact opposite of what the administration appointing him expected.
The Potential End of the « Dot Plot »: A Market Earthquake
The real anxiety catalyst isn’t the rate decision itself, but the possible elimination of the « Dot Plot » by Warsh at the June meeting. Introduced in 2012, this tool allowed markets to pre-price Fed intentions and smooth volatility. Its abolition would strip quantitative trading algorithms and institutional portfolio managers of a fundamental variable, mechanically increasing the risk premium demanded on volatile assets like Bitcoin. Predictive markets (Kalshi) assign 92% probability that the median rate projection remains above 3.5% if the chart is published.
May CPI and the SpaceX IPO: A Double Liquidity Squeeze
The US May 2026 CPI release represents the immediate volatility catalyst. Market consensus anticipates 4.2% year-over-year inflation, up from 3.8% previously. A higher reading would strengthen the DXY — historically one of the most damaging headwinds for Bitcoin.
Simultaneously, the SpaceX IPO (ticker SPCX) on Nasdaq, targeted for June 12 at a $1.75 trillion valuation with a $75 billion fundraise target (the largest IPO in financial history, surpassing Saudi Aramco), is acting as a colossal liquidity black hole. Institutional funds are liquidating speculative positions — including Bitcoin — to participate in this historic offering.
Institutional Dynamics: What the Major Players Are Doing
The Strategy (MicroStrategy) Event: « Never Sell » Broken
The most significant shockwave of late May 2026: Strategy (formerly MicroStrategy) sold 32 BTC between May 26–31, generating $2.5 million at an average price of $77,135. While representing just 0.004% of its total treasury, this transaction shattered Michael Saylor’s « never sell » doctrine and erased $160 billion in crypto market cap.
The funds were specifically directed at financing distributions owed to STRC preferred stockholders. To repair reputational damage, Strategy quickly bought back 1,550 additional BTC between June 1–7 at an average of $65,332, bringing its total to 845,256 BTC — while sitting on a paper loss exceeding $10 billion at current prices.
Spot Bitcoin ETF Hemorrhage
US Spot Bitcoin ETFs recorded a historic streak of 13 consecutive days of net outflows, totaling between $2.8 and $3.5 billion in redemptions. This dynamic confirms the correction is driven more by the absence of sustained buying flow than by a structural ecosystem collapse. On-chain data shows a demand deficit of approximately 650,000 BTC in virtual order books.
The Hyperliquid (HYPE) Divergence: Rotating Toward Yield
While Bitcoin bled, HYPE surged 160% year-to-date to an ATH of $75.52 on June 1. This decoupling illustrates institutional maturation: fund managers now prefer real cash-flow-generating assets over static stores of value in a high-opportunity-cost capital environment. New ETFs backed by HYPE from Grayscale and 21Shares attracted $160 million in inflows.
Microstructure Analysis: The Order Book Heatmap
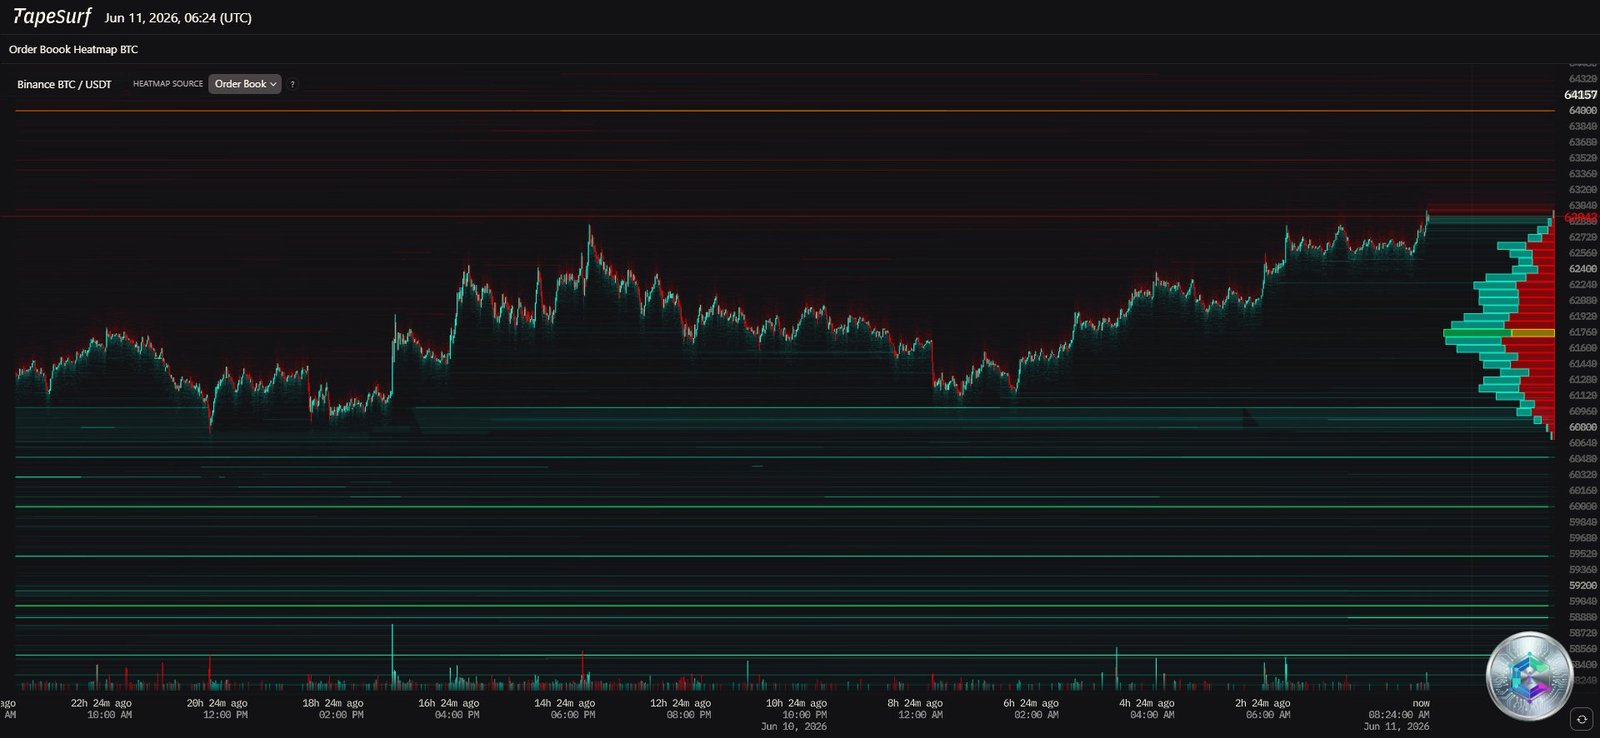
The heatmap reveals an asymmetric and highly polarized liquidity landscape:
- Sell Wall $64,000–$65,000: Former buyers now « underwater » waiting for breakeven to exit. This passive supply accumulation acts as an airtight lid suppressing any bullish rally attempt.
- Buy Magnet $59,000–$60,000: Dense liquidity clusters that mechanically attract price. Market-making algorithms have a mathematical incentive to trigger a « liquidity sweep » of this zone to accumulate at optimal prices with minimal slippage.
- Spoofing detected: Substantial sell order blocks appear sporadically at $62,500 and $63,000, then disappear before execution — classic « order flow toxicity » typical of pre-FOMC environments.
Multi-Timeframe Chart Analysis
Daily Chart (1D): The Death Cross Confirmed
Daily analysis reveals severe structural deterioration. The Death Cross — bearish crossover of the SMA50 below the SMA200 — is confirmed, triggering systematic de-allocation strategies at quantitative funds (CTAs). The SMA200 now hovers around $70,000, transformed from dynamic support into crushing gravitational resistance.
Key daily levels:
- Critical support: $60,000 — The last algorithmic line of defense. A confirmed daily close below this threshold would open a technical abyss toward $52,000.
- Macro pivot: $62,000 — The equilibrium axis where buying and selling forces are currently balanced.
- Major resistance: $65,000 — Former support now an impenetrable ceiling, reinforced by the heatmap’s sell wall.
The daily RSI has recovered from extreme oversold territory (<30) reached during the capitulation, but is only forming a modest bullish divergence. In pronounced bear market regimes, RSI can remain anchored in oversold conditions for extended periods.
4-Hour Chart (4H): Bear Flag & Compression Triangle
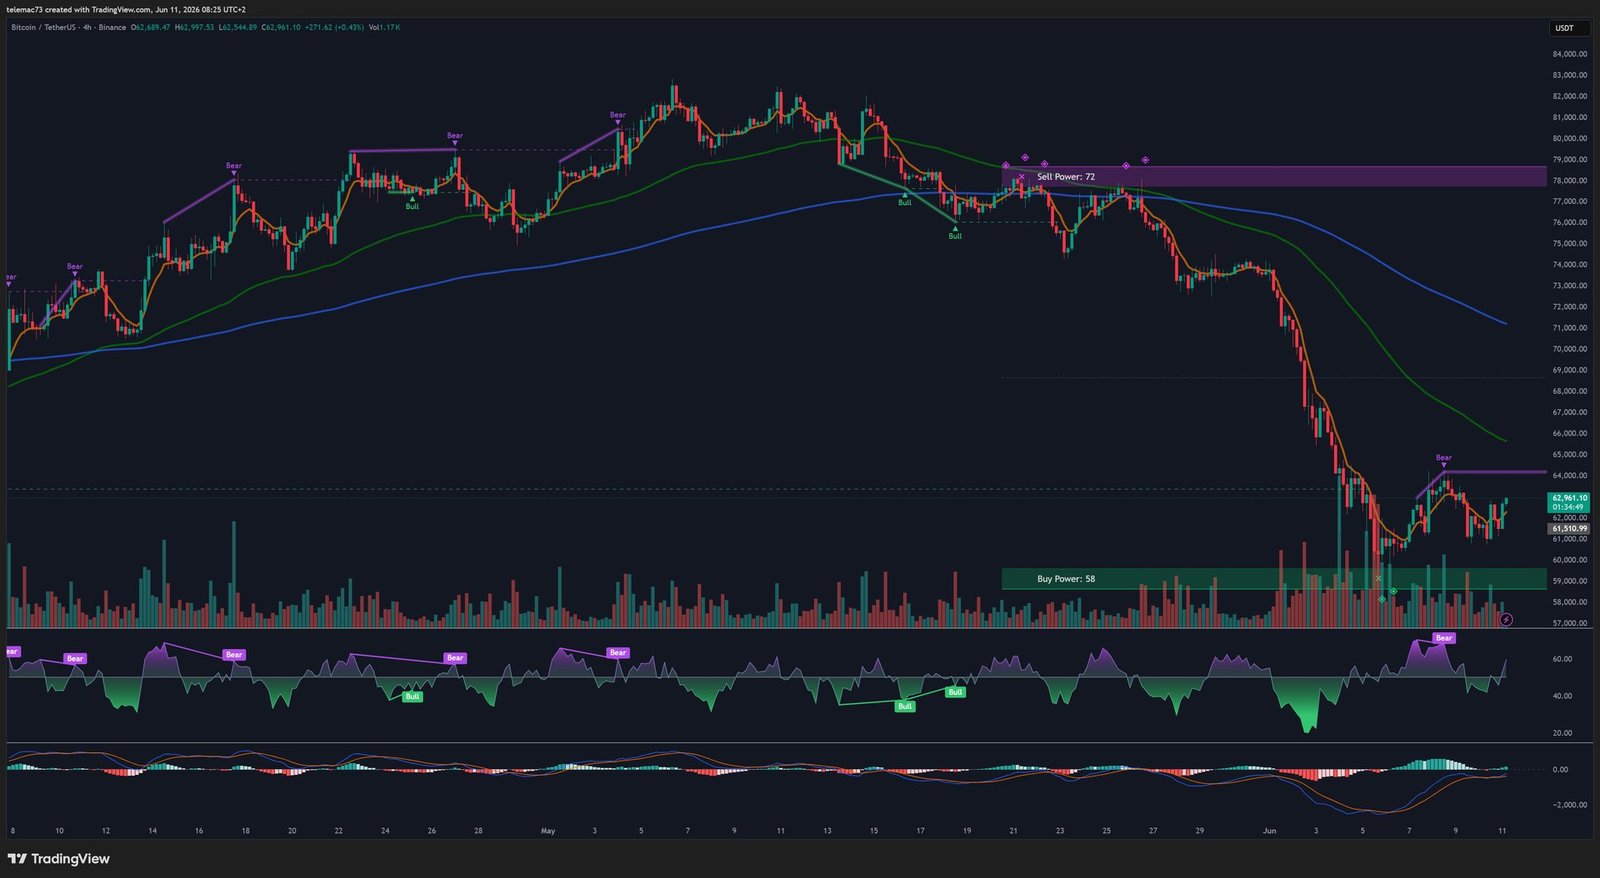
The 4-hour analysis reveals a classic Bear Flag formation. The « flagpole » was forged by the initial ~20% collapse, while the « flag » shows a slight rise on anemic volume — mechanical short covering, not genuine accumulation.
Inside this flag, trendlines are converging into a Symmetric Compression Triangle whose apex approaches inexorably. The 4H MACD is attempting a Golden Cross below the zero line — a counter-trend signal to approach with extreme caution, as it frequently acts as a bull trap in bear markets. A bullish resolution targets $62,800; a bearish breakdown validates continuation toward $60,000 and then $52,000–$55,000.
15-Minute Chart (15m): Noise and Waiting
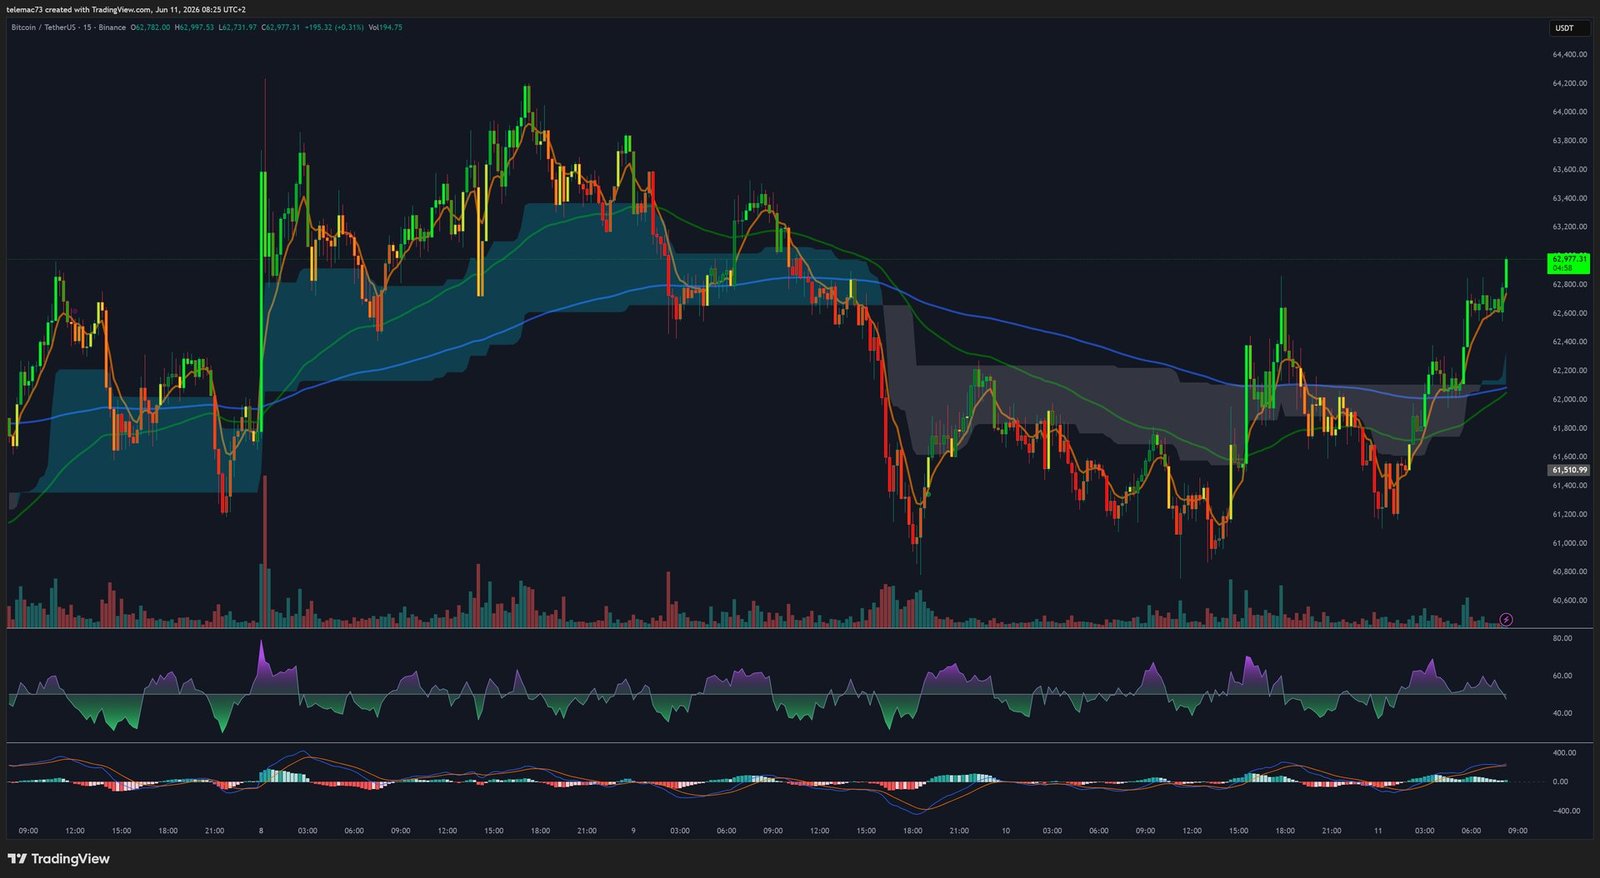
The 15-minute chart reflects a market in psychological stasis around $61,600. Candles display long wicks with narrow bodies (dojis and spinning tops), symbolizing paralytic indecision. The EMA 9 and EMA 21 cross frantically, generating a destructive « whipsaw » effect that erodes capital through successive losing signals and transaction costs.
Intraday scalping levels: Resistance $62,100 · Pivot $61,600 · Support $61,300. The RSI oscillates uselessly between 40 and 60, confirming the complete absence of immediate directional momentum.
Multi-Timeframe Technical Summary
| Timeframe | Regime | Key Levels | Pattern / Signal |
|---|---|---|---|
| Daily (1D) | Secular Bearish | Support $60,000 / Resistance $65,000 | Death Cross (SMA50 < SMA200) · RSI < 30 |
| 4 Hours (4H) | Consolidation | Support $61,000 / Resistance $62,800 | Bear Flag / Symmetric Triangle · MACD Golden Cross attempt |
| 15 Minutes (15m) | Noise / Erratic | Support $61,300 / Pivot $61,600 / Resistance $62,100 | Directionless range · Neutral RSI |
Derivatives and Structured Products: The YBIT ETF
In an environment where capital appreciation appears compromised in the short term, activity around the YieldMax Bitcoin Option Income Strategy ETF (YBIT) illustrates the prevailing paradigm. With a 41% dividend yield generated not from BTC price appreciation but from a covered call writing strategy, the ETF capitalizes on elevated implied volatility. Market makers of these products must dynamically hedge by selling the underlying asset, adding further pressure on spot prices.
Probabilistic Scenarios: The Market’s Verdict
Scenario 1 — Capitulation (Probability ~80%)
A CPI above 4.2% combined with hawkish FOMC rhetoric and Dot Plot elimination would trigger a bearish resolution of the 4H triangle. The $60,000 breakdown would activate a liquidation cascade, precipitating the price toward the historical accumulation zone at $52,000–$55,000. At this level, miner profitability would be severely threatened, risking additional miner capitulation and forced selling of treasury reserves.
Scenario 2 — Structural Short Squeeze (Contrarian Case)
A CPI surprising to the downside (≤ 3.8%) and Warsh communication preserving some rate trajectory predictability could trigger a violent return of liquidity to risk assets. Technically, a 4H MACD Golden Cross would validate a bullish breakout of the triangle. The chain activation of stop-loss orders from shorts trapped between $64,000 and $65,000 would propel price violently above this resistance, with the SMA200 at $70,000 as the next major target — invalidating the short-term bearish structure.
Conclusion
Bitcoin in June 2026 is an asset whose directional fate is no longer guided by intrinsic adoption dynamics, but is entirely subject to colossal exogenous forces: a doctrinal transition at the Fed, stubborn inflation, and fierce competition for liquidity. Whether the daily close holds or breaks $60,000 will inevitably dictate the market regime for the second half of 2026.
The rational market operator must approach this confluence zone with strict risk management orthodoxy — waiting for clear directional confirmations rather than hazarding an anticipatory move in an environment of such dense macroeconomic opacity.
⚠️ Disclaimer: This article is written for educational and informational purposes only. It does not constitute investment advice or a recommendation to buy or sell any digital assets. Cryptocurrency investments carry significant risk of capital loss. Do your own research and consult a licensed financial advisor before making any investment decisions.