
Bitcoin (BTC) is oscillating around $77,500 amid significant macroeconomic uncertainty. This multi-timeframe quantitative analysis examines market structure through daily, 4-hour, and 15-minute data, enriched by an order book microstructure reading. Two forward-looking scenarios are formulated for the coming trading sessions.
🌐 Macroeconomic Environment: An Asset Under Structural Pressure
Bitcoin’s valuation dynamics are unfolding within a macroeconomic transition phase characterized by volatility compression and heightened sensitivity to institutional capital flows. The traditional framework built around the four-year halving cycle is facing major disruptions: unlike previous cycles where the post-halving phase brought continuous parabolic gains, 2025 saw an early peak near $126,000 followed by a severe correction in Q1 2026.
This structural shift is driven by the growing influence of spot ETF flows and monetary policy. Moody’s downgrade of US sovereign debt from Aaa to Aa1 triggered a surge in long-term bond yields — with the 30-year Treasury reaching its highest level since July 2007 — mechanically reducing the appeal of non-yielding assets like Bitcoin. The Federal Reserve continues its restrictive stance amid persistent inflation and slowing economic growth.
These pressures materialized in $982 million in Bitcoin ETF outflows in a single week, interrupting the short-term bullish momentum. However, long-term structural catalysts are emerging: the American Reserve Modernization Act (ARMA) aims to build a national strategic reserve of up to 1 million BTC over five years, while SpaceX’s S-1 filing for its IPO disclosed a treasury of 18,712 BTC (~$1.45B), an institutional anchor that limits the risk of widespread capitulation.
| Macroeconomic Indicator | Current Value | Impact on Bitcoin |
|---|---|---|
| Fed Funds Rate | 4.25% – 4.50% | High cost of capital, valuation multiple compression |
| Weekly BTC ETF Outflows | $982M | Direct selling pressure on the spot market |
| SpaceX Treasury | 18,712 BTC (~$1.45B) | Validates Bitcoin as a corporate store of value |
| ARMA Acquisition Target | 200,000 BTC / year | Potential institutional demand shock under federal mandate |
📊 Multi-Timeframe Technical Analysis
Daily Timeframe: Post-Correction Consolidation
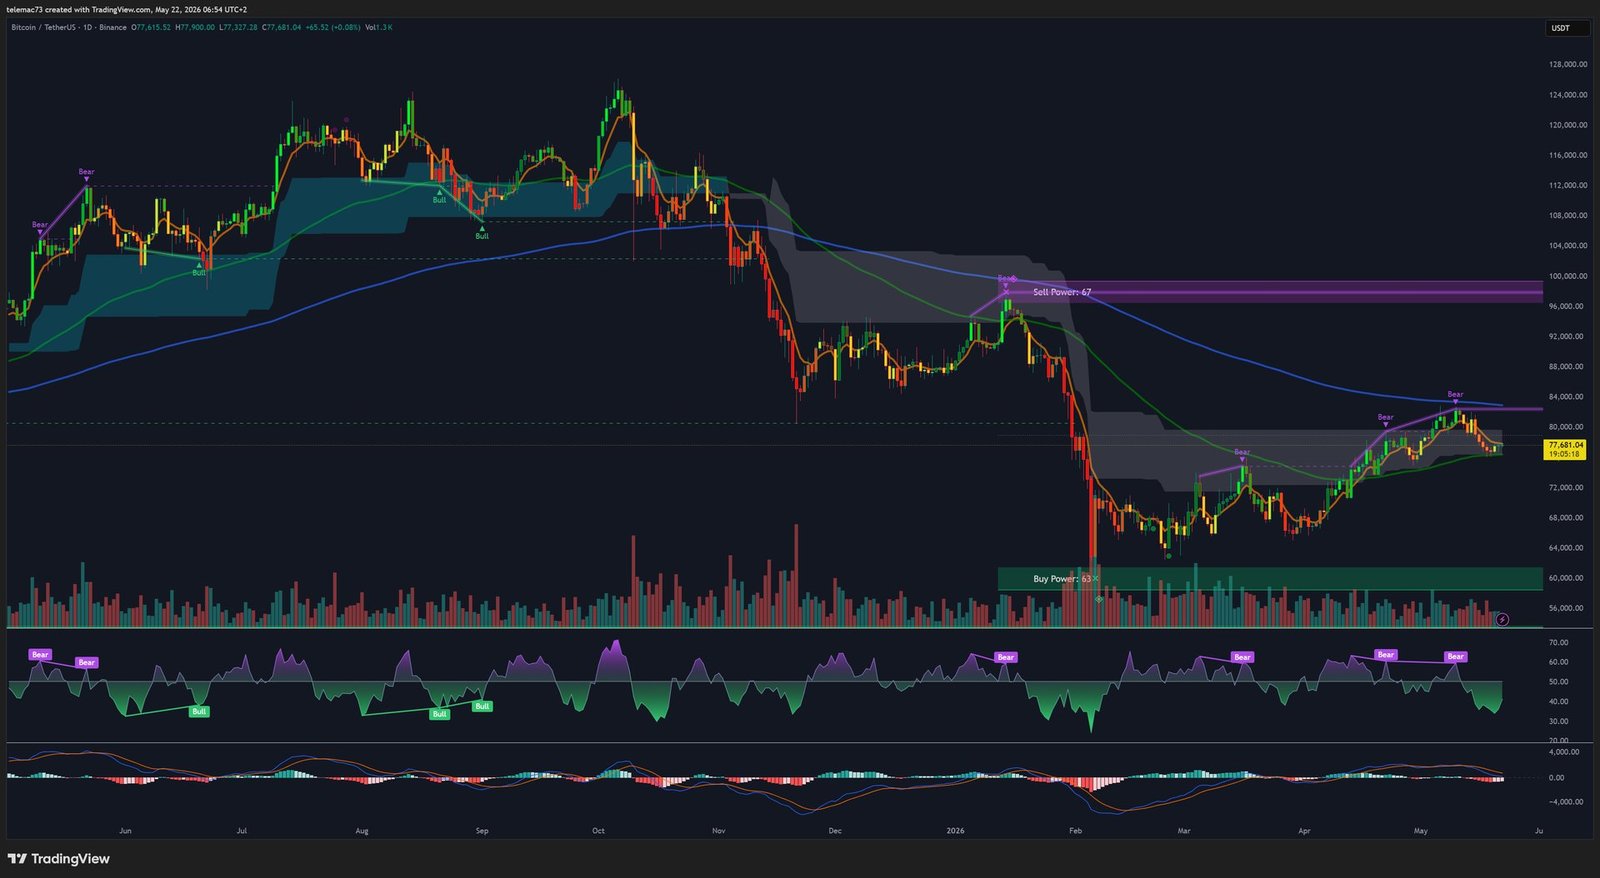
On the daily chart, the market is clearly in a major consolidation phase following the February 2026 correction. After finding solid support at the key level of $60,000, the market has entered a phase of gradual recovery. The long-term moving average (blue curve) is currently acting as a major dynamic resistance around the $82,000–$84,000 zone. Price is trading below this reference line, confirming the underlying trend remains technically corrective until a daily close above $83,000 is achieved.
Momentum indicators reinforce this weakness. The RSI (Relative Strength Index) reads 44.59, reflecting the absence of directional momentum and a slightly bearish bias below the key 50 pivot level. The MACD shows a flat histogram with signal lines converging below zero, characteristic of a trendless accumulation or distribution phase.
4-Hour Timeframe: Bear Flag Under Close Watch
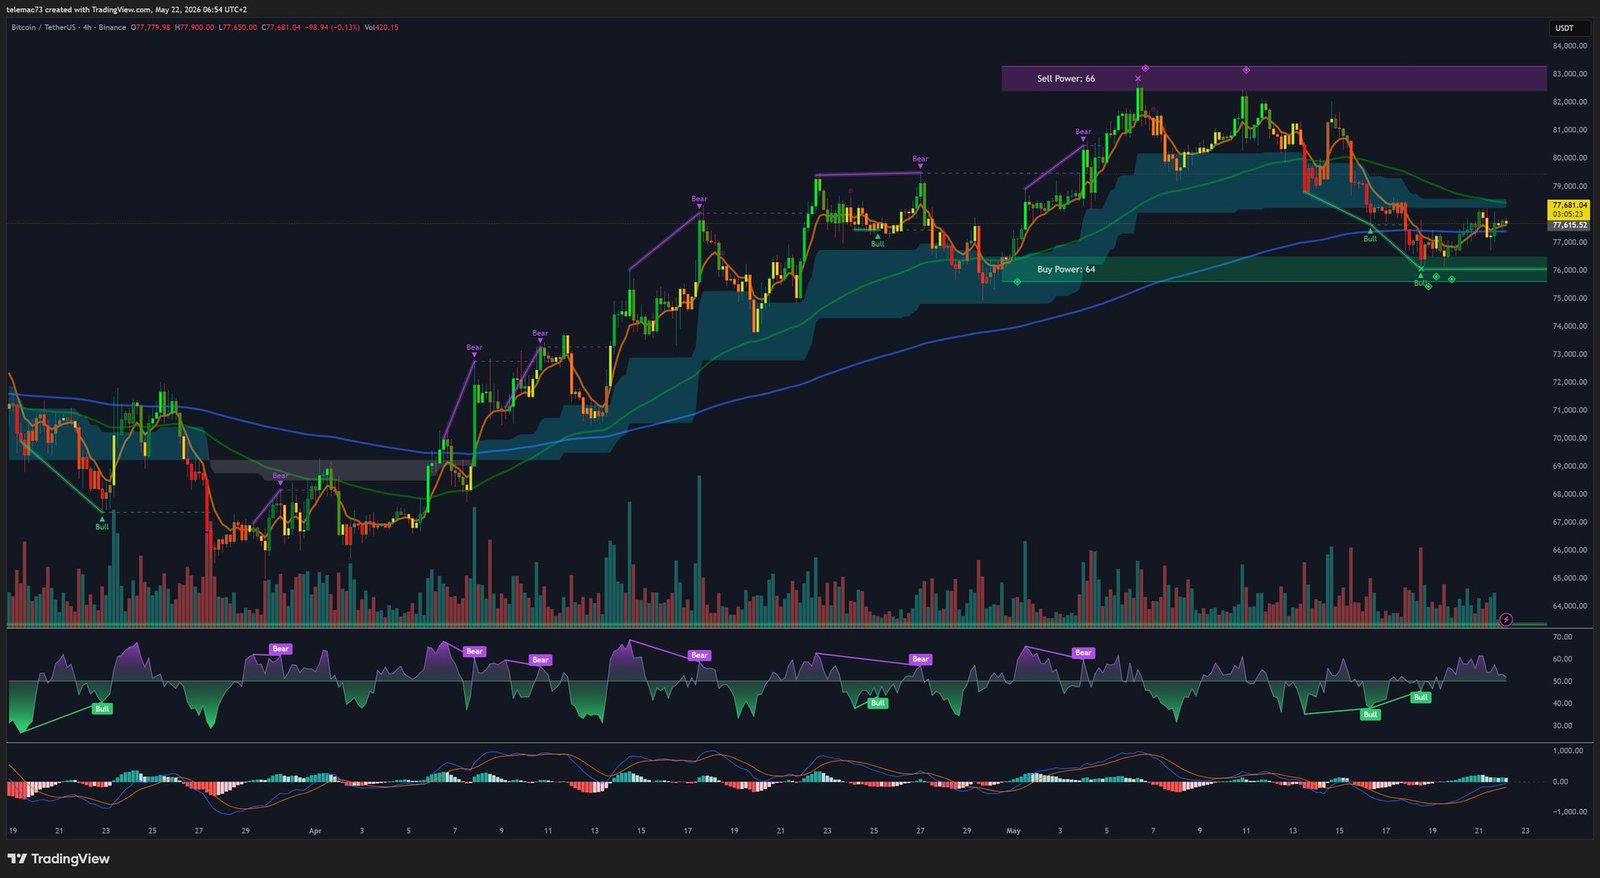
The 4-hour chart provides a precise view of the intermediate structure. Following a failed double top in the $82,000–$83,000 resistance zone, price underwent a sharp pullback toward the $75,000 support. A clear bullish RSI divergence is identifiable: while price printed a lower low below $75,000, the RSI simultaneously formed a higher low — a signal that correctly anticipated the current technical bounce toward $77,481.
However, the overall structure resembles a low-angle ascending channel following a rapid bearish impulse — a classic bear flag pattern. The fast moving average has settled below the slow moving average, forming a Death Cross on this timeframe. This configuration warrants caution: a breakdown below the flag’s lower boundary at $76,800 could trigger a significant new corrective wave.
15-Minute Timeframe: Symmetrical Triangle and Imminent Breakout
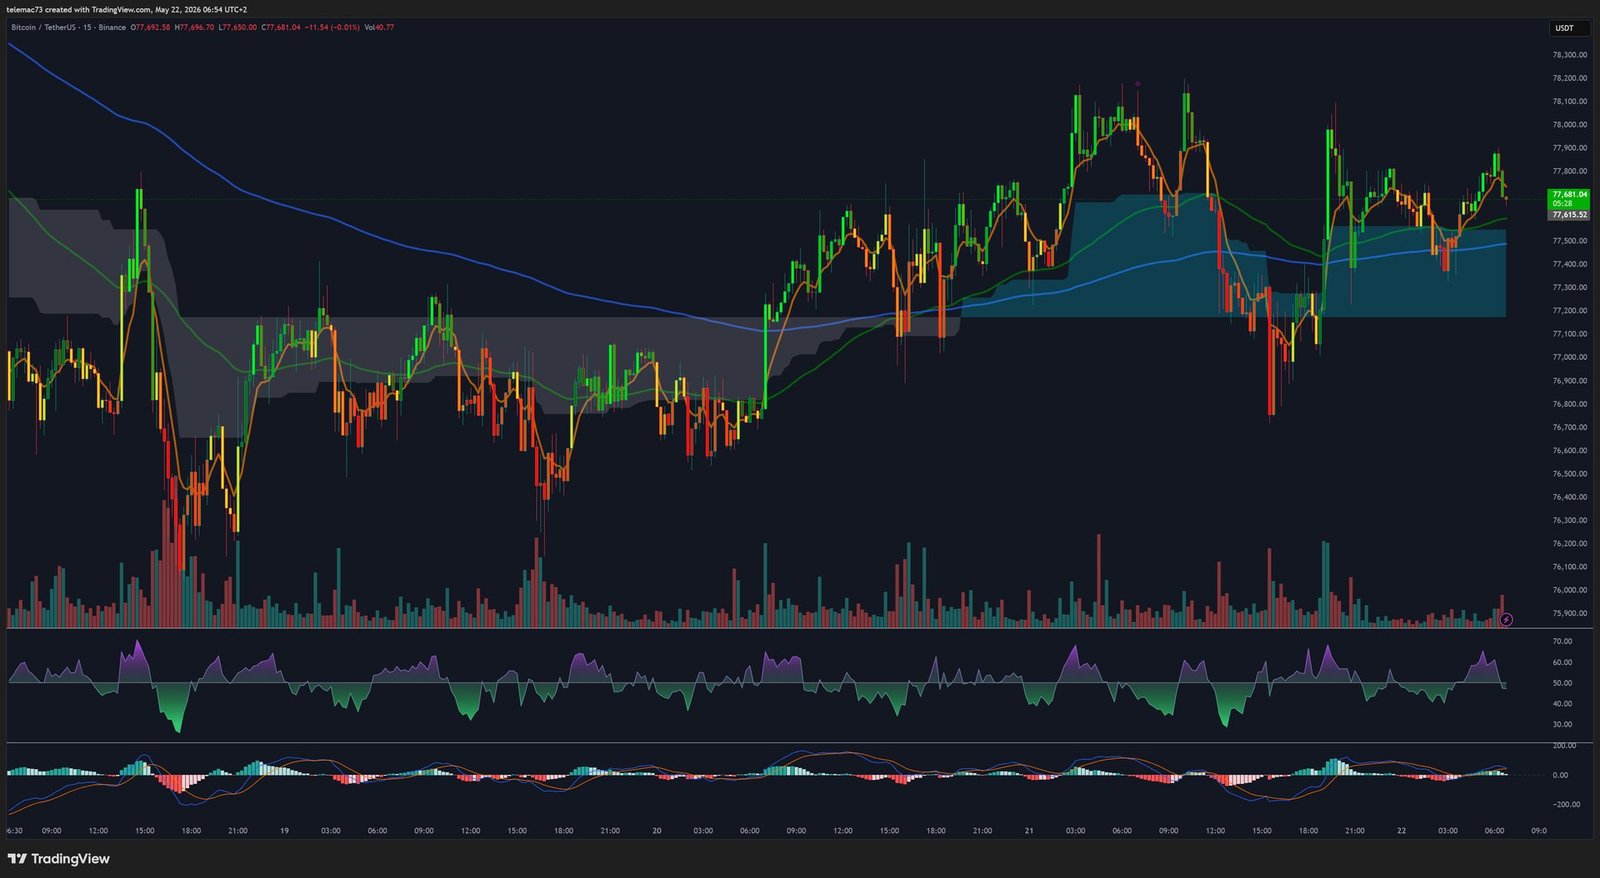
On the very short-term timeframe, the 15-minute chart shows price stabilizing above the reference moving average, which is now acting as immediate dynamic support at $77,300. Price is oscillating within a symmetrical compression triangle defined by a descending trendline connecting local highs and an ascending support line, with the short-term pivot at $77,481.
The tightening Bollinger Bands and neutral RSI and MACD readings near their midlines signal an imminent breakout from this compression zone. The direction of the break will set the tone for the remainder of the trading session and potentially the sessions to follow.
🔥 Microstructure: Order Book Heatmap Analysis
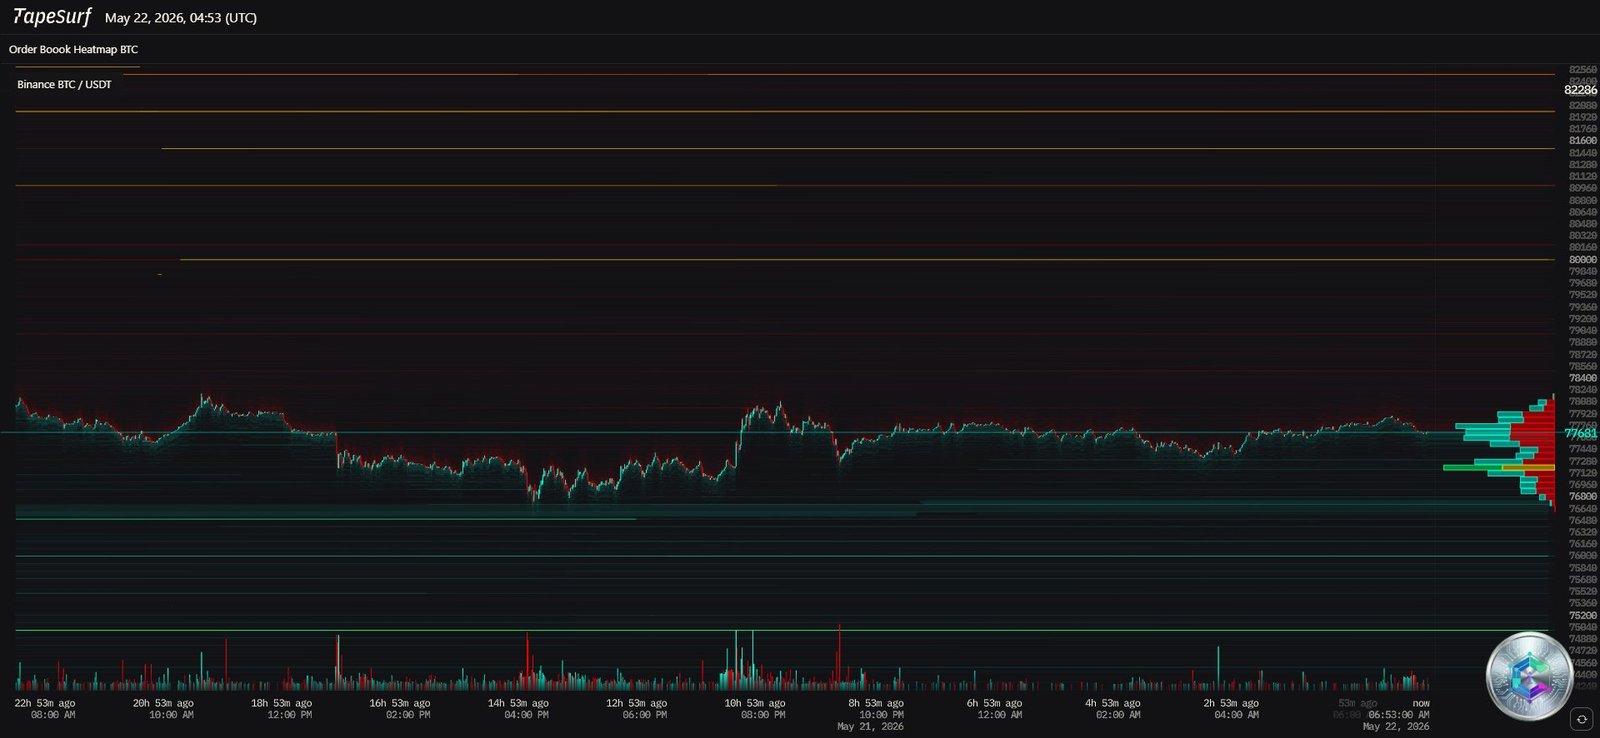
The integration of the Order Book Heatmap reveals the areas of interest for major market participants and provides a granular understanding of market microstructure. Above current price, the $80,000–$82,236 zone displays a high density of sell orders (sell walls). The precise level of $82,236 represents the major order book ceiling, aligning exactly with the rejection zone identified on longer-term charts.
On the downside, buy order blocks (bids) are stacked at successive levels of $76,000, $75,000, and $74,000. The $75,000 level concentrates the most significant near-term liquidity. Spot Cumulative Volume Delta (CVD) analysis reveals that recent upward moves were driven by moderate participation from large institutional accounts (orders > $1M), suggesting the current bounce toward $77,481 lacks structural « smart money » support. This imbalance increases the probability of a liquidity sweep below $76,000 before any sustained directional move materializes.
🎯 Key Levels and Forward-Looking Scenarios
| Technical Level | Price (USD) | Role | Rationale |
|---|---|---|---|
| Macro Resistance | $82,236–$83,000 | Major Sell Zone | 4H double top / Dense sell wall on Heatmap |
| Dynamic Pivot | $79,500–$80,000 | Psychological Barrier | 4H Death Cross zone / Bear flag invalidation threshold |
| Micro-trend Support | $77,300 | Short-Term Support | 15-minute reference moving average |
| Key Support | $75,000–$75,500 | Major Buy Zone | Buy Power 64 / Bullish RSI divergence / Bid cluster |
| Capitulation Support | $72,000 | Horizontal Support | Base of the medium-term consolidation structure |
📉 Primary Scenario: Liquidity Sweep Followed by Re-accumulation
Given neutral-to-bearish medium-term momentum and persistent macroeconomic uncertainty, the market faces a high risk of a bearish resolution of the 4H flag. This corrective move would target a break below $76,500 to hunt latent liquidity accumulated between $75,000 and $75,500, flushing out excessive leverage from late retail buyers.
The price reaction at the $75,000 zone will be decisive. Effective absorption of sell orders — validated by a CVD reversal and a swift reclaim of $76,500 — would lay the groundwork for a Q2 end-of-quarter rally toward $80,000, then $82,236.
📈 Alternative Scenario: Bullish Breakout from Compression
Should flows tied to the SpaceX IPO and pro-Bitcoin legislation (ARMA) overpower macroeconomic headwinds, Bitcoin could break the 15-minute compression triangle to the upside. A clean, confirmed 4H close above $78,500 would invalidate the bear flag structure.
This technical invalidation would trigger a forced short squeeze below the $80,000 psychological threshold, propelling price toward a direct test of the major distribution zone at $82,000–$83,000. A weekly close above this level would technically open the path to a full resumption of the macro bullish trend.
⚠️ Disclaimer: This article is written for strictly educational and informational purposes only. It does not constitute investment advice or a recommendation to buy or sell cryptocurrencies or any other financial asset. Cryptocurrency markets are highly volatile and carry significant risk of capital loss. Any investment decision should be made after consulting a qualified financial advisor and in accordance with your personal risk profile.