
On May 6, 2026, Bitcoin trades around $81,266, breaking through the critical psychological threshold of $80,000 to reach a three-month high. This performance reflects a rare convergence of powerful technical signals, structural institutional demand, and a tense macroeconomic backdrop. A complete deep-dive into a potentially historic market configuration.
Market Dynamics: An Institutional Rally Under Pressure
Bitcoin’s dominance has risen to 58.67% of total crypto market capitalization, reflecting a flight-to-quality dynamic toward the leading asset. Paradoxically, the Fear & Greed Index hovers between 45 and 49 — in « fear » territory — signaling that this rally is not driven by retail euphoria, but by structural demand from major institutional players.
Net inflows into spot Bitcoin ETFs have reached approximately $2.7 billion over the past three weeks, pushing total assets under management beyond the symbolic $100 billion milestone. This massive institutionalization creates a structural support floor that methodically absorbs sporadic selling pressure and fundamentally reshapes market liquidity dynamics.
Macroeconomic Context: Inflation, Energy, and Geopolitics
Bitcoin’s price action cannot be analyzed in isolation from the macroeconomic environment of May 2026. US inflation has shown signs of re-acceleration, reaching an annualized rate of 3.3% — the highest level since May 2024. This dynamic is largely attributable to Middle East geopolitical tensions, which have triggered a surge in energy prices: +12.5% in global energy costs, with specific increases of 18.9% for gasoline and 44.2% for heating oil.
This energy-driven inflation has a dual effect on Bitcoin. On one hand, it reinforces the narrative of the asset as « digital gold » — a hedge against monetary erosion. On the other, it complicates the Federal Reserve’s task, with uncertainty over rate trajectories keeping 10-year Treasury yields at 4.35%. Despite this competitive pressure, Bitcoin’s resilience in the face of a strong dollar demonstrates growing maturity within institutional portfolios.
| Macroeconomic Indicator | Observed Value | Risk Impact |
|---|---|---|
| US Inflation (CPI YoY) | 3.3% | ⚠️ High / Inflationary |
| US GDP Growth (Q1) | 2.0% | 🟡 Moderate / Neutral |
| Oil Price (Forecast) | $110 – $150 | 🔴 Critical / High Volatility |
| 10-Year Treasury Yield | 4.35% | 🟠 Competitive / Bearish for Risk |
| BTC Market Dominance | 58.67% | 🟢 Concentrated / Bullish |
Institutional Flows: ETFs and the Strategy Inc. Pivot
A historical turning point emerged in early May 2026 with Strategy Inc. (MSTR)‘s Q1 earnings report. Michael Saylor’s company, holding 818,334 BTC, reported a net loss of $12.54 billion — primarily driven by $14.46 billion in digital asset impairments — and mentioned for the first time ever the possibility of selling a portion of its holdings to fund dividends. The end of the « never sell » dogma signals a transition toward a « Bitcoin Development Company » model, where the asset is actively deployed to generate shareholder value.
On the ETF front, BlackRock’s IBIT continues to dominate with approximately 62% market share, recording +$284.39M in net inflows in April. Fidelity’s FBTC follows with +$213.36M. These figures confirm that institutional investors are using the current consolidation to accumulate positions ahead of a potential breakout to new highs.
| Entity / Product | Net Flows (April/May 2026) | Total Position (Est.) |
|---|---|---|
| BlackRock (IBIT) | +$284.39M | ~812,000 BTC |
| Fidelity (FBTC) | +$213.36M | N/A |
| Strategy Inc. (MSTR) | +$11.68B raised (YTD) | 818,334 BTC |
| Morgan Stanley (MSBT) | +$95.00M (Launch) | N/A |
| Total ETF Volume | +$2.70B (3 weeks) | >$100B AUM |
Multi-Timeframe Technical Analysis
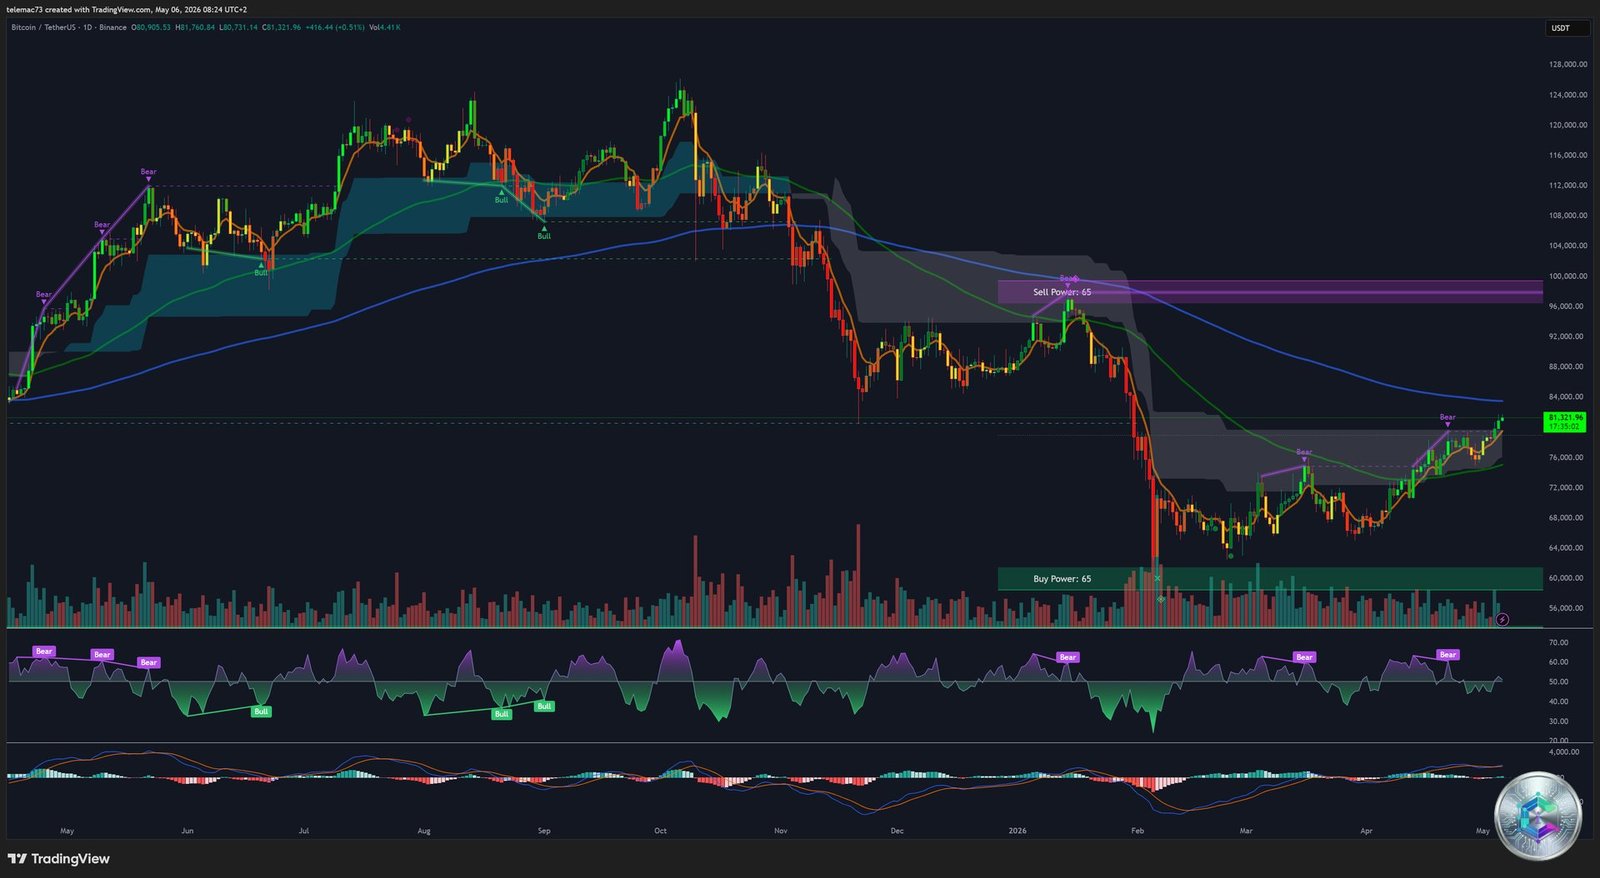
📅 Daily Chart (1D): The Golden Cross Signal
On the daily timeframe, Bitcoin is finalizing a Golden Cross formation: the 50-day moving average (MA50, ~$80,196) is on the verge of crossing above the 200-day moving average (MA200, ~$77,889). Historically, this signal has preceded parabolic bull runs — notably in October 2023 and October 2024 — with gains ranging from 72% to 148%.
The 14-day RSI reads 65: in a zone of ascending strength but not yet extreme overbought territory, leaving room for an extension toward $85,000. The MACD (12,26) at +409, positioned above its signal line with a moderately expanding histogram, confirms that buyers maintain control of the trend.
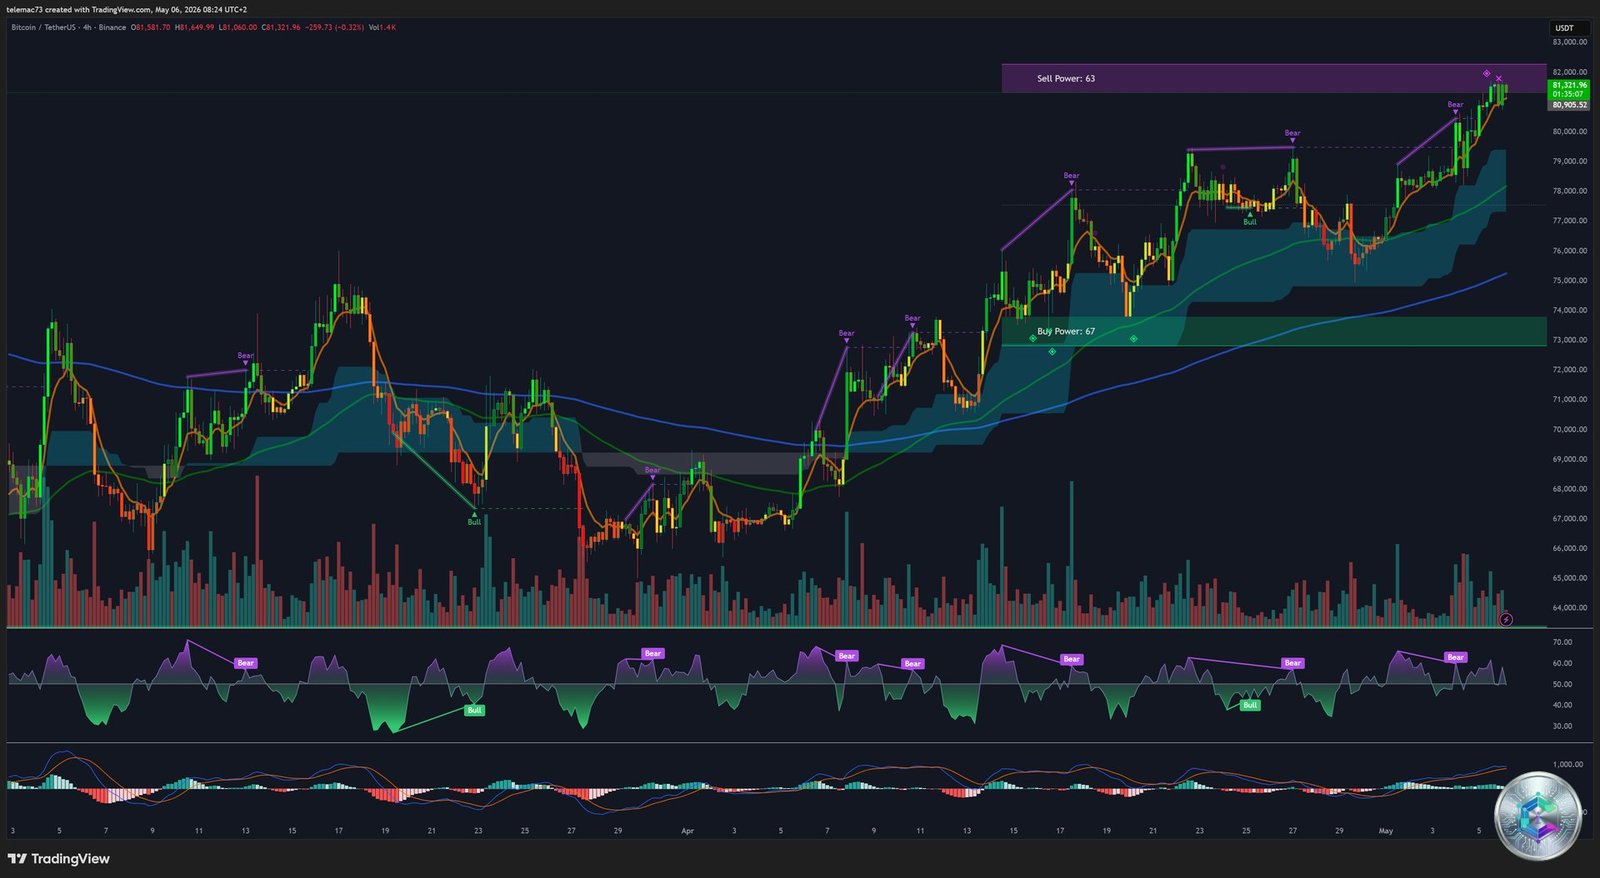
⏱️ 4-Hour Chart (4H): Bull Flag Compression
On the 4-hour timeframe, Bitcoin is forming a classic Bull Flag pattern between $79,500 and $81,200. This compression pattern indicates energy accumulation after the initial rally. A bullish breakout confirmed by a close above $81,325 would project a target toward the golden Fibonacci ratio (0.618) at $83,522 — which coincides with the unfilled CME futures gap.
Bitcoin has recently reclaimed the Bull Market Support Band (zone $77,000–$80,000) after six months in a weakness zone, marking a major technical regime change. Immediate supports identified: $79,600, followed by the $78,900 pivot level.
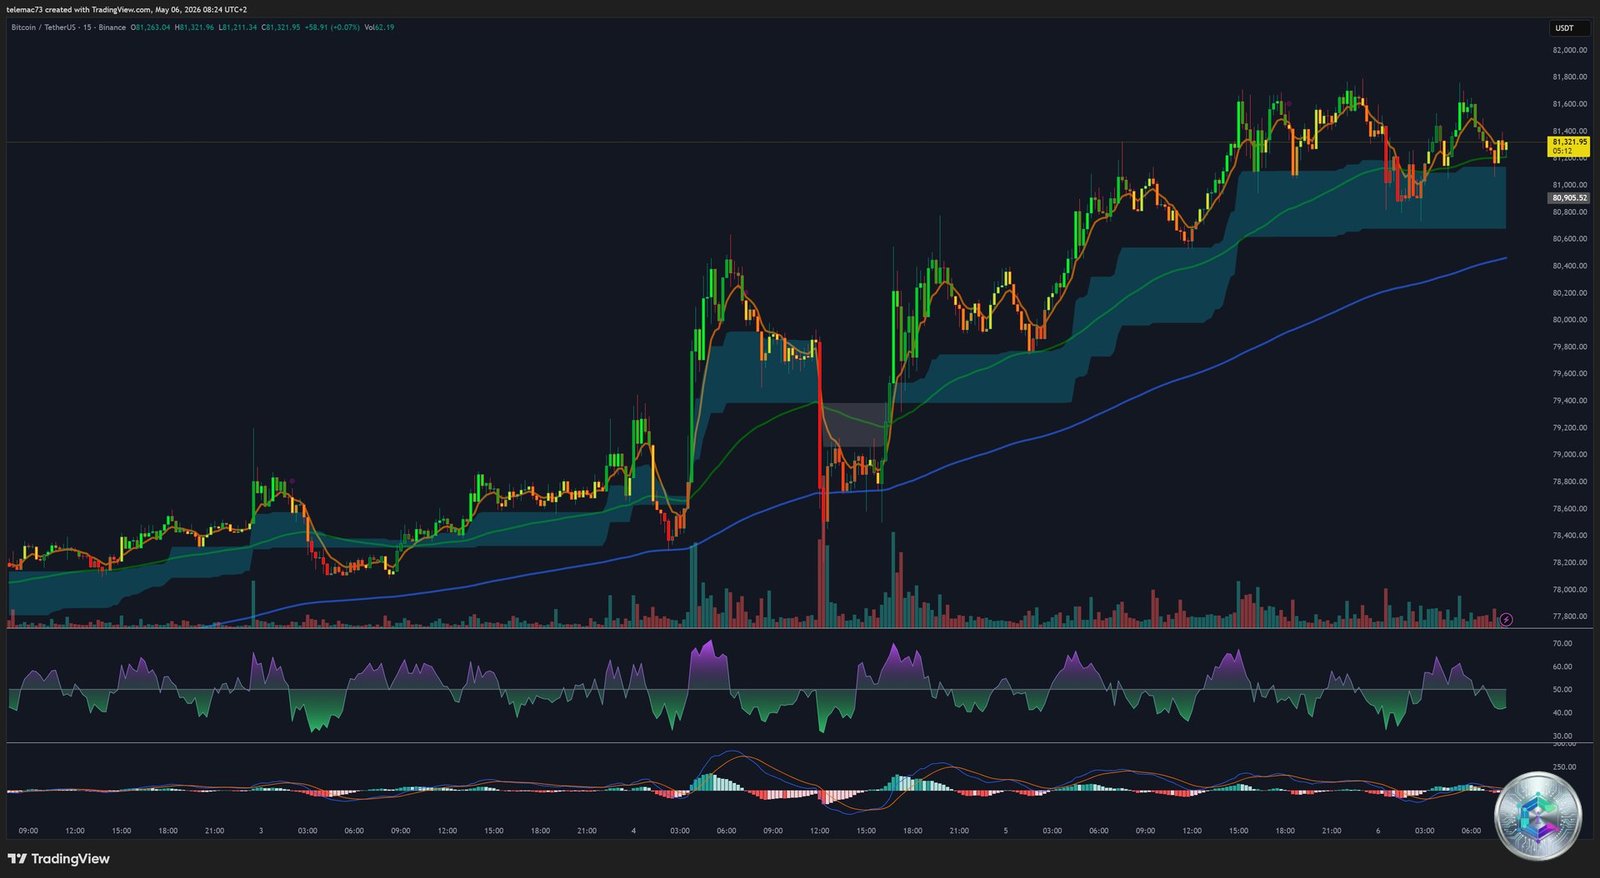
⚡ 15-Minute Chart (15M): Intra-Day Micro-Structure
On the 15-minute timeframe, micro-structure reveals an aggressive defense of the $80,500 zone by buyers, with significant sell orders materializing near $81,500. The intra-day Fibonacci pivot sits at $81,022.3 — the key barometer for immediate sessions. The Stochastic RSI alternates rapidly between overbought and oversold zones, typical of a high-volatility consolidation phase.
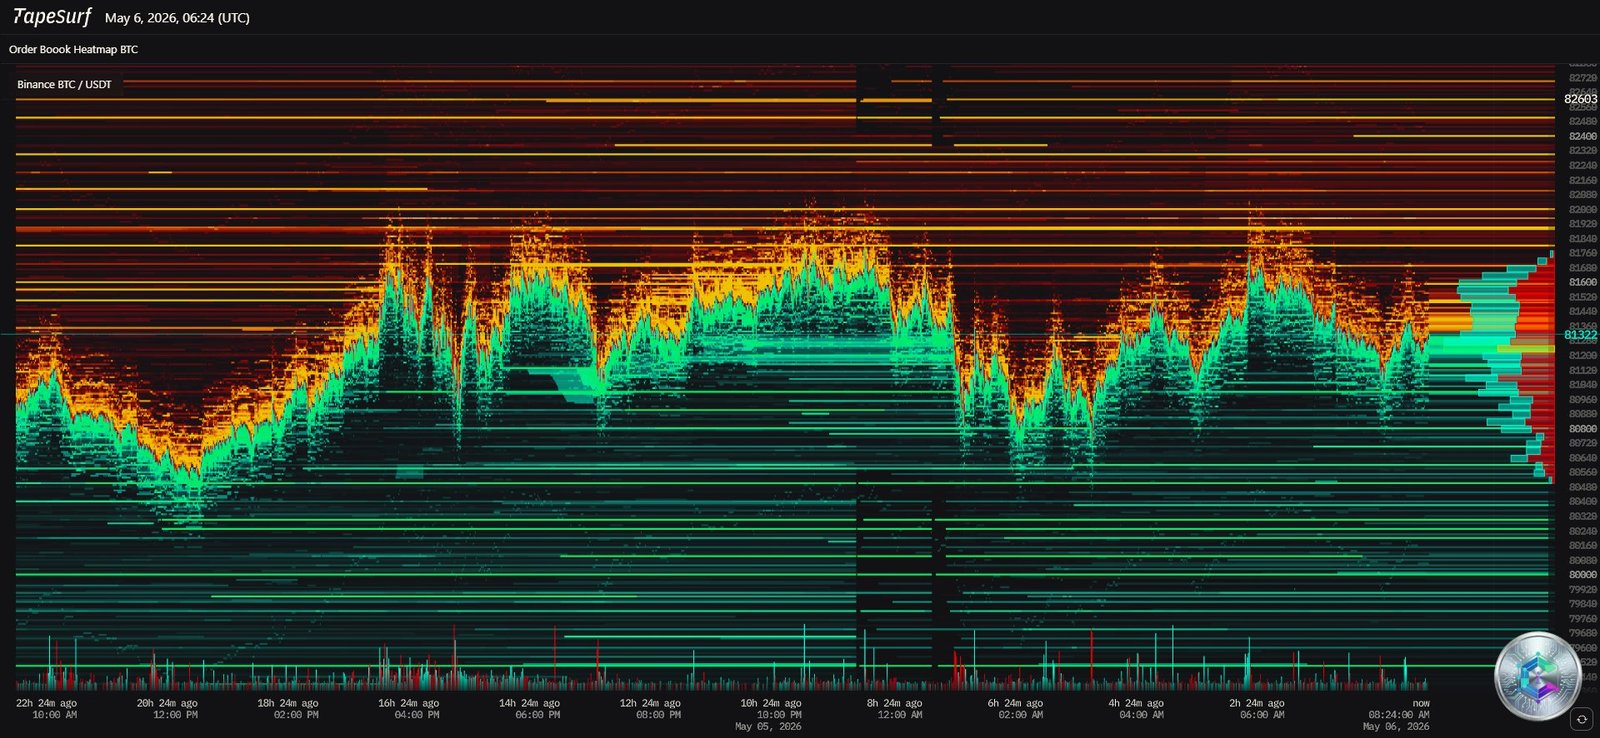
Liquidity Heatmap: Price Attraction Zones
Analysis of the liquidity heatmap (TapeSurf) reveals a massive concentration of sell orders between $82,500 and $83,000 — a zone where many participants are waiting to take profits or open short positions. A rapid move toward $82,000 could trigger a cascading short squeeze, propelling price toward the next resistance at $85,000.
On the downside, a significant liquidity pocket is identified between $74,000 and $75,000 — a potential dump zone where institutional buyers would likely place massive buy orders in the event of a sharp correction. The order book shows a predominance of bids in the $79,000–$80,000 zone, confirming a solid institutional support floor.
Market Sentiment and On-Chain Metrics
Despite bullish price action, on-chain metrics reveal a notable divergence: network activity has fallen to two-year lows, with only approximately 531,000 daily active addresses and 203,000 new wallets created per day. This divergence indicates that volume is dominated by whale transfers and institutional settlements, not by the retail base.
Historically, phases where price is bullish but sentiment remains fearful are conducive to bullish continuations, as they signal an absence of peak euphoria. The catalyst for the next wave could be a break above $85,000 — a level likely to attract mainstream media attention and bring active addresses back above the critical one-million-per-day threshold.
Key Technical Levels Reference Table
| Technical Level | Value (USD) | Significance |
|---|---|---|
| 🔴 Major Resistance | $85,000 | Cyclical high / Extreme resistance |
| 🟠 Fib 0.618 Extension | $83,522 | Golden ratio target / CME Gap fill |
| 🟡 Intra-day Resistance | $81,325 | Bull flag upper boundary |
| ⚪ Daily Pivot | $81,022 | Fibonacci equilibrium level |
| 🟢 Immediate Support | $79,600 | Consolidation lower boundary |
| 🟢 Fib 0.5 Support | $79,025 | Major psychological support |
| 🔵 MA200 | $77,889 | Long-term trend floor |
Professional Trading Setup
| Parameter | Price Zone (USD) | Rationale |
|---|---|---|
| 🟢 Entry Zone (Long) | $79,200 – $80,400 | Retest of Fibonacci 0.5 pivot |
| 🔴 Stop Loss | $76,800 | Break of MA200 + BMAB band |
| 🎯 Target 1 | $83,522 | CME gap fill / Fib 0.618 |
| 🎯 Target 2 | $86,000 | Historical liquidation zone |
| 🎯 Target 3 | $91,117 | Major Fibonacci extension |
Key Catalyst Events This Week
The week of May 5–7, 2026 is headlined by Consensus Miami 2026, dubbed the « Super Bowl of Blockchain. » Topics such as the Internet of Capital Markets, Agentic Commerce (AI + DeFi), and Real World Asset (RWA) tokenization could redefine the perceived utility of Bitcoin beyond a simple store of value. Major institutional adoption announcements could trigger violent price swings.
Additionally, the US response to Iran’s peace proposal remains a critical geopolitical variable: an escalation would push oil beyond $120, which could initially weigh on Bitcoin (correlation with risk assets) before it reasserts its safe-haven status.
Strategic Conclusion
The convergence of an imminent Golden Cross, structural ETF demand, an inflationary macro environment, and a 4-hour Bull Flag places Bitcoin in an exceptionally strong relative position. The $81,022 pivot will serve as the barometer for upcoming sessions: sustained trading above this level will favor a rapid test of $83,500, and potentially $85,000 before week’s end.
Caution is nonetheless warranted given the weakness in on-chain activity and the Strategy Inc. strategic shift, which could introduce new BTC supply to the market. Preferred entries are on retests of the $79,000–$80,000 support range, with a protective stop below the moving average cluster at $77,000. Should market psychology shift from « fear » to « neutral » or « greed, » all conditions will be in place for a run toward the $90,000–$92,000 zone — completing the final major technical targets of this renaissance cycle.
⚠️ Disclaimer: This article is written for educational and informational purposes only. It does not constitute investment advice, a recommendation to buy or sell, or financial advice of any kind. Cryptocurrency markets are highly volatile and carry significant risk of capital loss. Always do your own research (DYOR) and consult a qualified financial advisor before making any investment decision.