
A New Market Paradigm
In early May 2026, the Bitcoin (BTC) ecosystem is undergoing a structural transformation of historic magnitude. The breach of the psychological $80,000 threshold — with consolidation around $80,900 — is not a mere statistical anomaly or speculative volatility spike. It is the culmination of a rare confluence between global macroeconomic forces, major geopolitical realignments, and a profound imbalance between an algorithmically constrained supply and voracious institutional demand. This analysis delivers an exhaustive dissection of the current configuration, merging high-level fundamental analysis with granular multi-timeframe technical study.
Macroeconomic Architecture: Inflation, the Fed & the Liquidity Paradox
The U.S. Inflationary Environment
Data released by the Bureau of Labor Statistics for March 2026 reveals a notable resurgence of inflationary pressures. The U.S. CPI jumped to 3.3% year-over-year — its highest since May 2024, after stagnating at 2.4% in January and February — primarily driven by a sharp 12.5% surge in energy costs (including +18.9% for gasoline and an extraordinary +44.2% for home heating oil). Core CPI, excluding volatile food and energy components, settled at 2.6%, betraying persistent underlying pressure in services and shelter. On a monthly basis, the 0.9% headline gain represents the strongest single-month advance since June 2022.
This tenacious inflationary dynamic forces the Federal Reserve to maintain a « higher for longer » monetary policy stance, exerting pressure on the cost of capital. The expiration of Jerome Powell’s mandate in May 2026 introduces a political transition risk and systemic uncertainty regarding future liquidity management. In this environment of potential stagflation, scarcity assets like Bitcoin benefit from strategic portfolio reallocation away from fiat currency erosion.
Bitcoin: Between Growth Asset and Digital Safe Haven
While Bitcoin has historically exhibited positive correlation with technology indices like the Nasdaq, May 2026 marks a significant departure. During recent volatility shocks, a subset of institutional investors treated Bitcoin not as a high-beta risk asset, but as a digital safe haven. This hybrid behavior — outperforming equities during expansion and resisting systemic shocks — confers Bitcoin an asymmetric return profile particularly attractive for institutional portfolio construction.
Geopolitics: The Strait of Hormuz Crisis & Bitcoin vs. Gold Divergence
May 2026 spectacularly illustrates how Bitcoin has become a full-fledged geopolitical asset. The launch of « Project Freedom » — a U.S. military initiative to escort commercial vessels through the Strait of Hormuz amid persistent tensions with Iran — triggered a brutal shock across commodity markets (Brent crude near $119, WTI crossing $105). This escalation fed a geopolitical risk premium directly absorbed by Bitcoin.
The most revealing divergence of this sequence: gold fell approximately 13–14% over the geopolitical episode, while Bitcoin appreciated by more than 20%. This structural decoupling is explained by elevated real rates penalizing yield-less gold, and by Bitcoin’s inherently stateless and censorship-resistant nature — a preferred asset for capital seeking insulation from sanction risks, sovereign asset freezes, and SWIFT system disruptions.
When partial de-escalation occurred (Iran’s 14-point peace proposal transmitted to international mediators in Pakistan), Bitcoin held its gains and consolidated firmly above $80,000. This resilience demonstrates that geopolitics served as an accelerant, while the underlying structural driver remains institutional supply absorption.
Institutional Flows & ETFs: The Structural Supply Squeeze
The Dominance of U.S. Spot Bitcoin ETFs
The most powerful internal driver of this price action lies in a deep, mathematically documented asymmetry between supply and institutional demand. April 2026 closed with $1.97 billion in net inflows into U.S. spot Bitcoin ETFs. In early May, nine consecutive days of net inflows totaled approximately $2.7 billion. On May 1st alone, $629.8 million entered ETFs, with $284.4 million coming from a single leading fund.
BlackRock’s iShares Bitcoin Trust (IBIT) has established itself as the undisputed titan of the sector with 809,870 BTC under management, representing ~62% of total U.S. ETF assets and ~7% of total circulating supply. Total net assets across all U.S. spot Bitcoin ETFs have crossed the historic $100 billion milestone, with cumulative net inflows of over $58 billion since launch — the most successful financial product launches of the decade.
The 500% Anomaly: A Mathematical Supply Shock
The Bitcoin network produces approximately 450 BTC per day post-halving (April 2024). Yet institutional absorption (ETFs + corporate treasuries) represents more than 500% of this daily production. Over the last five days of April alone, ETFs absorbed ~19,000 BTC — far beyond any mining capacity. Whale wallets simultaneously accumulated 61,000 BTC over 30 days, including $500 million absorbed precisely in the $75,000–$78,000 zone in the 48 hours preceding the $80,000 breakout. This imbalance mechanically creates a scarcity of secondary market liquidity, propelling prices higher.
Strategy (MSTR): The Corporate Amplifier
Strategy remains the world’s largest public corporate Bitcoin holder with 818,334 BTC acquired at a total cost of $61.81 billion (average purchase price ~$75,537/BTC). Its financial engineering has evolved dramatically: the firm now leverages the issuance of perpetual preferred shares « Stretch » (STRC, 11.5% dividend) to raise $1 billion and acquire 13,927 BTC, avoiding dilution of common shareholders. Since January 2026, Strategy has deployed over $3 billion to acquire ~77,000 BTC — approximately ten times the net inflows of all combined spot ETFs over the same period.
| Institutional Indicator | Value (May 5, 2026) | Impact on Price Structure |
|---|---|---|
| Total U.S. Spot ETF AUM | > $100 Billion | Institutional price floor, downside volatility stabilization |
| ETF Net Inflows (April) | $1.97 Billion | Sustained buying pressure neutralizing profit-taking |
| Absorption vs. Mining Emission | > 500% | Mathematical squeeze — secondary market supply scarcity |
| Strategy (MSTR) Holdings | 818,334 BTC | Drastic reduction of exchange free float |
| Whale Purchases (30 days) | ~$500 Million | Massive on-chain support between $75K and $78K |
Chart Analysis — Daily (1D): The Historic Breakout
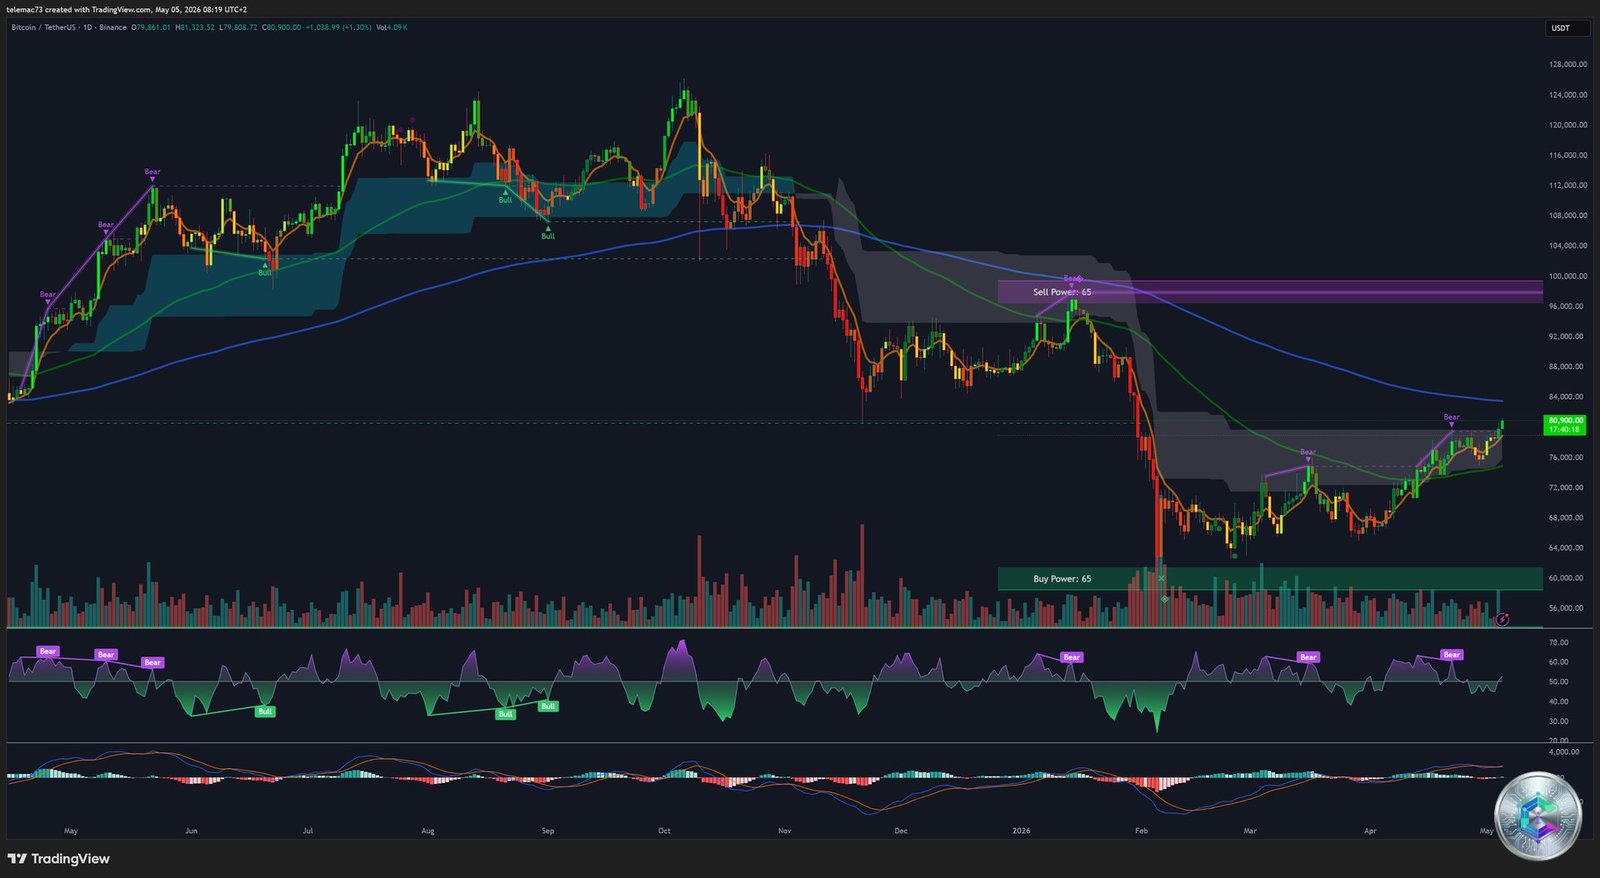
The daily chart tells a clear story. A prolonged triangular consolidation phase — characterized by a series of lower highs and firmly defended support around $60,000 — has exploded to the upside. The breakout candle not only pierced the descending trend line of this compression structure, but also obliterated the psychological $80,000 resistance on a +12% volume surge, validating the legitimacy of the move. The resistance flip phenomenon is underway: former resistance is transforming into a new structural support base.
The Golden Cross: A Decisive Macro Signal
The most significant technical event in this configuration is the confirmation of a Golden Cross — the bullish crossover of the 50-day SMA above the 200-day SMA. This signal represents a macroeconomic polarity inversion: the market exits a bearish mean-reversion regime and enters a bullish trend-following regime. Historically, such crossovers with this level of momentum precede parabolic appreciation sequences spanning multiple quarters.
The oscillators confirm the directional force. The daily MACD displays expanding green histogram bars above zero, with no detectable bearish divergence. The daily RSI climbs aggressively above 60, approaching overbought territory (70) — but in a market driven by a structural supply shock, the RSI can remain « embedded » at these extreme levels for weeks, reflecting chronic bullish momentum rather than an imminent sell signal.
4-Hour Dynamics: The Algorithmic Staircase Ascent
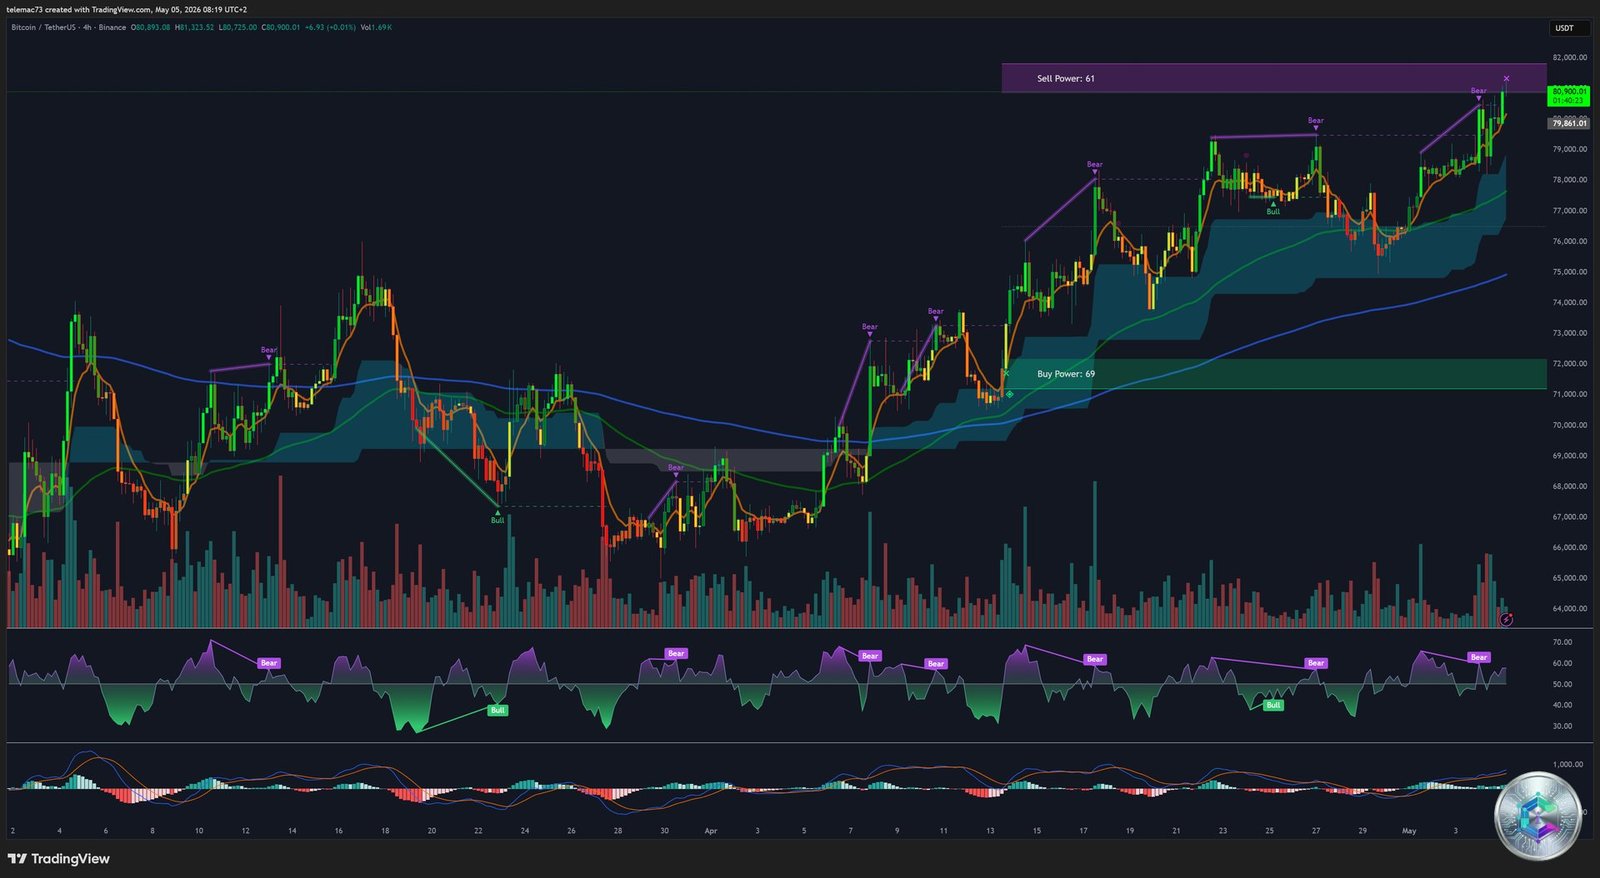
The 4-hour chart is a textbook perfect uptrend. From the $70,000 zone, price action has followed an algorithmic staircase progression: each major impulse wave is followed by a brief consolidation (bull flag or descending continuation wedge) on declining volume, purging excessive leverage accumulated by retail speculators before the next impulse leg begins. The 20-period EMA acts as an inviolable dynamic support, with every touch generating lower wicks that reveal aggressive buy-the-dip algorithm absorption.
The Short Squeeze Mechanics
The remarkable verticality of certain 4H candles is explained by the derivatives market dynamics. The breakout through resistance levels between $75,000 and $80,000 triggered a violent short squeeze: over $160 million in Bitcoin short positions (and $300–450 million across the broader crypto market) were liquidated within 24 hours. These forced buy-back orders, hitting a spot order book already stripped thin by institutional accumulation, created upside liquidity gaps and a parabolic price acceleration. This mechanism warns, however, that the recent rally is partially fueled by forced closures of perpetual contracts, adding tactical fragility at very short timeframes.
15-Minute Microstructure: Tactical Warning Signals
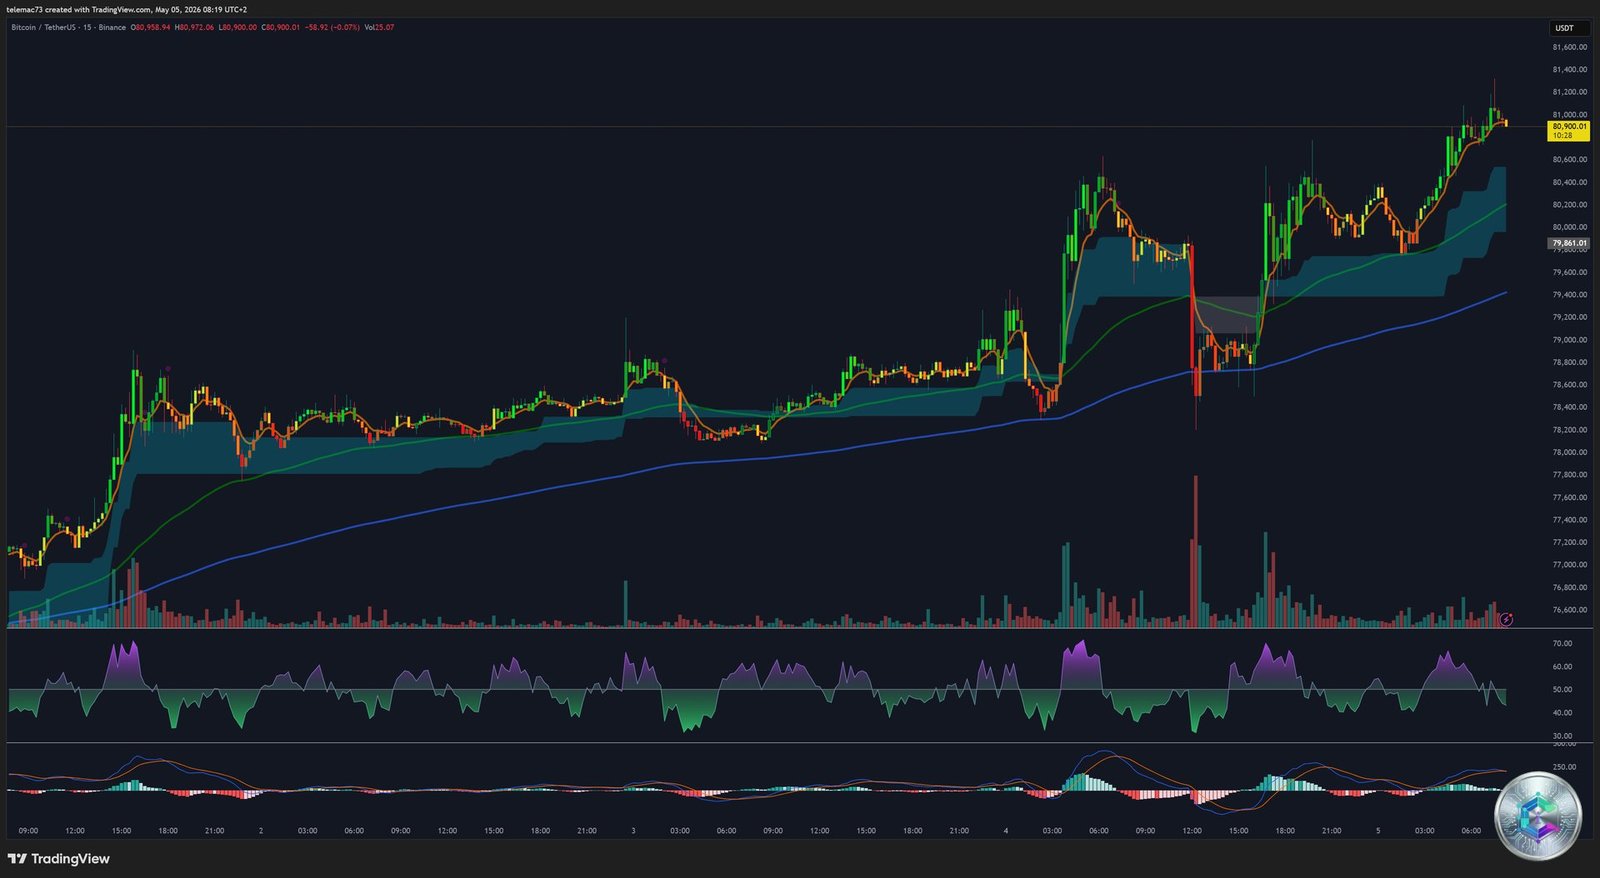
Diving into the 15-minute microstructure reveals the anatomy of the parabolic surge. After dense accumulation between $78,500 and $79,500 — marked by bearish head-fakes quickly bought back — the market executed an explosive breakout toward $80,900. This timeframe now reveals early signs of local exhaustion:
- RSI Bearish Divergence: The oscillator reached paroxysmal values (near or above 80), but as price printed marginal new highs, RSI failed to match with equivalent new highs. Buying velocity is decelerating even as price continues upward.
- Local MACD Death Cross: The histogram flips negative and the fast MACD line crosses below the signal line. This signal absolutely does not invalidate the macro uptrend, but suggests a short-term micro-correction is likely — a retrace toward $80,000–$80,300 to flush highly-leveraged late longs opened at the top of the move.
Liquidity Mapping: The Order Book Heatmap
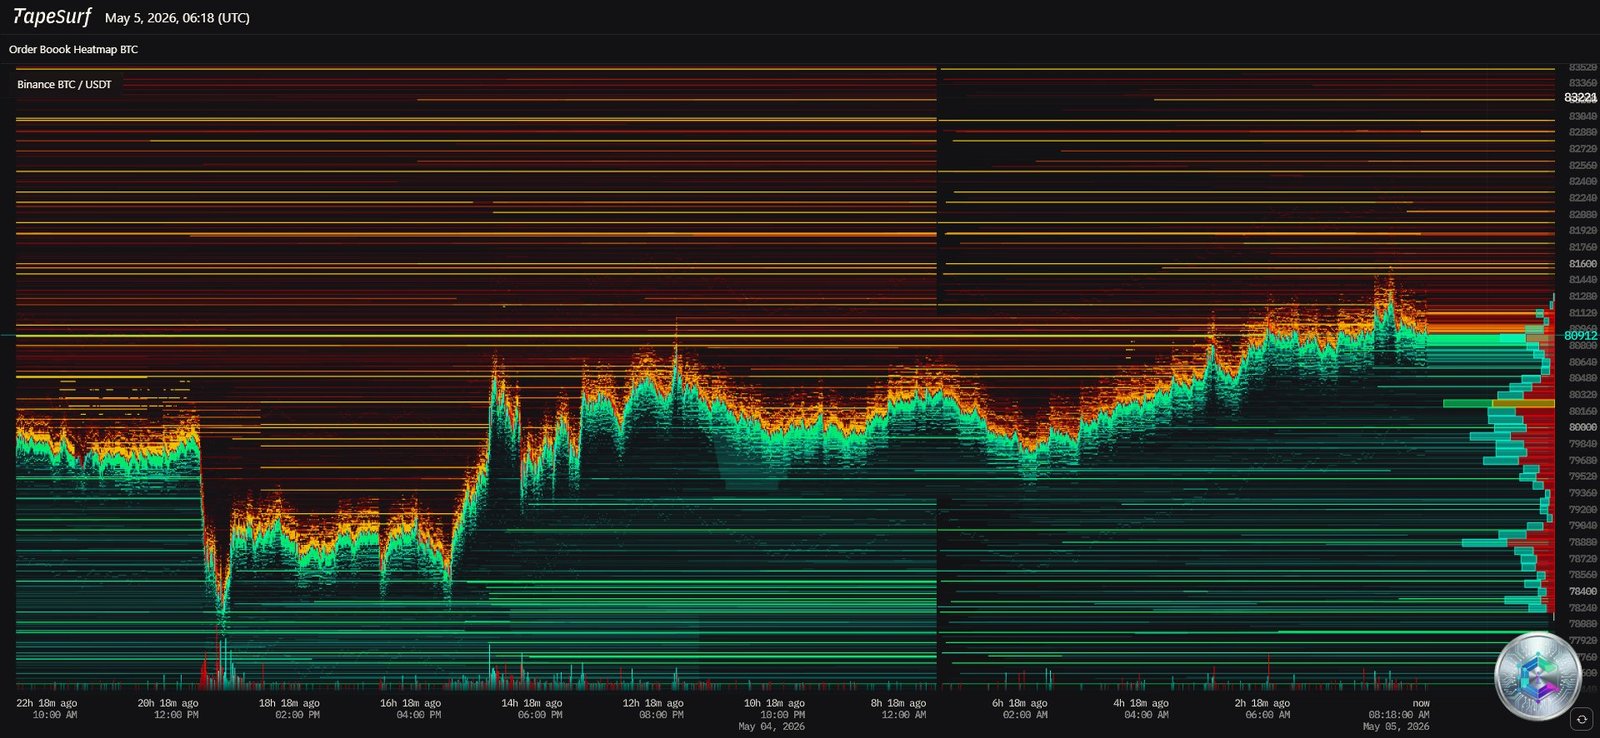
Price action does not occur in a vacuum — it is attracted by liquidity pockets. The thermographic analysis of the Binance BTC/USDT order book maps with precision the attraction zones and resistance walls that price must navigate. Colored bands represent the density of limit orders deposited by market participants.
The Northern Sell Walls
Above $80,900, a dense accumulation of yellow and red lines signals massive sell walls. The $81,500–$82,500 zone constitutes a first-order kinetic resistance, where market-making algorithms position their liquidity anticipating profit-taking by actors who accumulated below $70,000. Further out, the $85,000–$86,000 zone represents a « magnet zone » — price will be inexorably drawn toward this order concentration to satisfy incoming market buy flows, but its absorption will require continued aggressive spot ETF inflows.
The Southern Safety Nets
Below current price, the heatmap reveals colossal institutional conviction. Around $80,000, bid limit order density has been dynamically reloaded, corroborating the chartist resistance flip hypothesis. The $75,000–$78,000 zone represents an on-chain fortress: $500 million in absorption liquidity injected by whales in this exact zone is perfectly visible in the depth of green blocks on the heatmap.
| Level | Price Zone (USD) | Analytical Foundation |
|---|---|---|
| Fibonacci Extension Target | ~$86,000 | Historical magnet zone; daily compression figure projection |
| Major Resistance (Sell Wall) | ~$82,000 | Dense heatmap order concentration; 4H channel ceiling |
| Current Price Zone | ~$80,900 | Post-short squeeze consolidation; 15m RSI divergence |
| Psychological Pivot / Support | ~$80,000 | Confirmed resistance flip; daily dynamic EMAs |
| Strong Demand Support | ~$78,000 | On-chain $500M absorption; green heatmap liquidity wall |
| Macro-Structural Floor | ~$75,000 | April consolidation base; convergence of daily 50-EMA |
Predictive Synthesis & 2026 Outlook
Short Term: $95,000–$96,000 Target by End of June
The medium-term probabilistic architecture is overwhelming. The disparity between the 450 BTC/day produced and institutional drainage representing 500% of that capacity creates a mathematical squeeze. Capriole Investments’ rigorous cycle studies empirically demonstrate that historically, when this level of smart money absorption is reached and sustained, Bitcoin delivers an asymmetric average return of +24% in the following calendar month. Applied to the current breakout zone (~$80,000), this projects a highly probable price target of $95,000–$96,000 by end of June 2026 — a target that justifies maintaining long exposure and implementing buy-the-dip strategies around the $78,000 liquidity zone.
Macro-Cyclical: $140,000 in Q4 2026, $250,000 by 2027?
At the cycle scale, the April 2024 halving is expected to produce its maximum price impact between 16 and 18 months post-event — placing the potential macro top window between late 2025 and Q3 2026. April’s extended consolidation is analyzed by prominent traders as a Wyckoff accumulation phase, a base designed to propel Bitcoin into the terminal phase of a super-cycle. Combined with the imminent tokenization of real-world assets (RWA) on blockchain and potential central bank liquidity injections should the U.S. economy stall, long-term forecasting models target between $140,000 in Q4 2026 and a potential cycle peak of $250,000 by 2027.
The Altcoin Ripple Effect
Bitcoin’s breach of $80,000 triggers a global repricing of the entire asset class. While Bitcoin dominance remains firmly anchored above 60% — reflecting institutional capital concentration in the ecosystem’s lowest-risk store of value — the « risk-on » sentiment initiates a capital rotation toward peripheral liquidity. Ethereum (ETH) surpasses $2,380, Solana (SOL) trends toward $85, XRP at $1.41 and Dogecoin record substantial proportional gains, benefiting from the wealth effect and renewed confidence in the broader crypto ecosystem.
Conclusion
Bitcoin above $80,000 in May 2026 is the precise translation of a new market equilibrium. The alignment of fundamental analysis (massive ETF flows, institutional absorption of 500% of mined supply) and technical analysis (daily Golden Cross, volume-validated breakout, major resistances cleared) indicates that the path of least resistance remains aggressively oriented to the upside. Next structural targets: $82,000, then $86,000, with a cycle target of $95,000–$96,000 by end of June. Key supports to monitor in case of retracement: $80,000 (psychological), $78,000 (on-chain), and $75,000 (macro-structural).
⚠️ Disclaimer: This article is written for educational and informational purposes only. It does not constitute investment advice or a recommendation to buy or sell any financial asset. Cryptocurrency markets are extremely volatile and carry significant risk of capital loss. Always conduct your own research (DYOR) and consult a qualified financial professional before making any investment decisions.