
As April 2026 draws to a close, Bitcoin (BTC) stands at a decisive crossroads. After the worst first quarter in its history — three consecutive months in the red, a cumulative loss of 23% since January — the digital asset is trading around $75,500, far below its all-time high of $126,000 reached in October 2025. This comprehensive analysis report, dated April 30, 2026, dissects the macroeconomic, institutional, and technical forces that will shape Bitcoin’s next major directional move.
1. Macroeconomic Landscape: A Historic Paradigm Shift
The Kevin Warsh Revolution at the Fed
The most structurally significant macroeconomic event of the 2026 cycle is, without question, the nomination of Kevin Warsh as Chairman of the Federal Reserve, replacing Jerome Powell ahead of schedule. Initially perceived as a monetary « hawk » — a fierce advocate for fiscal discipline during his previous tenure as Fed Governor (2006–2011) — Warsh delivered a bombshell disclosure: his financial filing submitted to the Office of Government Ethics in April 2026 reveals a net worth estimated between $131 million and $209 million, with more than $100 million exposed to the crypto ecosystem.
Warsh’s portfolio reflects deep systemic conviction rather than casual speculation: stakes in Bitwise Asset Management (since 2018), Solana, dYdX, Aave, Arbitrum, Optimism, Polymarket, and even Bitcoin Lightning Network startups such as Flashnet. For the first time in history, a leading Fed candidate holds intimate understanding of and direct financial interest in blockchain infrastructure. Senate confirmation hearings initiated in late April 2026 are being scrutinized by the entire global financial community — the prospect of a clear regulatory framework for digital assets has never felt more tangible.
Warsh publicly regards Bitcoin as a « canary in the coal mine » for inflation: a legitimate macroeconomic indicator, not a speculative anomaly. This stance represents a first-order structural catalyst for long-term institutional adoption.
Interest Rates, Geopolitics, and Persistent Inflation
The FOMC held its benchmark rate unchanged at 3.50%–3.75% for the third consecutive meeting, with Chairman Powell dismissing any imminent hike while seeking a neutral policy stance. On the geopolitical front, US–Iran tensions over the nuclear program continue to roil energy markets, while El Niño conditions threaten global agricultural supply chains. These exogenous supply shocks reinforce the narrative of Bitcoin as a store of value and inflation hedge — a thesis regaining credibility after Q1’s capitulation.
| Macro Indicator | Status (April 2026) | BTC Impact |
|---|---|---|
| Fed Funds Rate | 3.50%–3.75% (unchanged) | Neutral to Bullish |
| Warsh Nomination | Senate hearings underway | Strongly Bullish (LT) |
| Middle East Geopolitics | Elevated Iran/US tensions | Increased volatility |
| Commodities | Supply constraints (oil, agri.) | Bullish (inflation hedge) |
2. Institutional Dynamics: Smart Money Is Accumulating
While retail investors capitulate in the face of stagnant prices, institutions are orchestrating a methodical, large-scale accumulation. The ~20% rebound from February 2026 lows was not driven by speculative euphoria, but by one dominant actor: Strategy (formerly MicroStrategy) injected a staggering $7.2 billion over just eight weeks to purchase BTC, creating a massive positive demand shock in the market.
Meanwhile, US spot Bitcoin ETFs recorded net inflows of $2.43 billion in April alone — during a period when prices declined from $79,000 to $76,000. This classic divergence between rising capital flows and falling prices is the clearest signature of a market where « smart money » buys the dips, systematically absorbing supply from liquidated leveraged traders. In parallel, Blockchain.com launched « Blockchain Wealth, » an institutional wealth management service backed by its BTC holdings, and Block (NYSE: XYZ) deployed a publicly auditable Proof of Reserves system — two powerful signals of deepening market infrastructure maturity.
3. Liquidation Heatmap Analysis: Mapping the Danger Zones
Liquidation Heatmaps provide a predictive X-ray of the order book. They identify clusters of dormant liquidations — zones that algorithms naturally seek to reach in order to execute large institutional orders without excessive slippage.
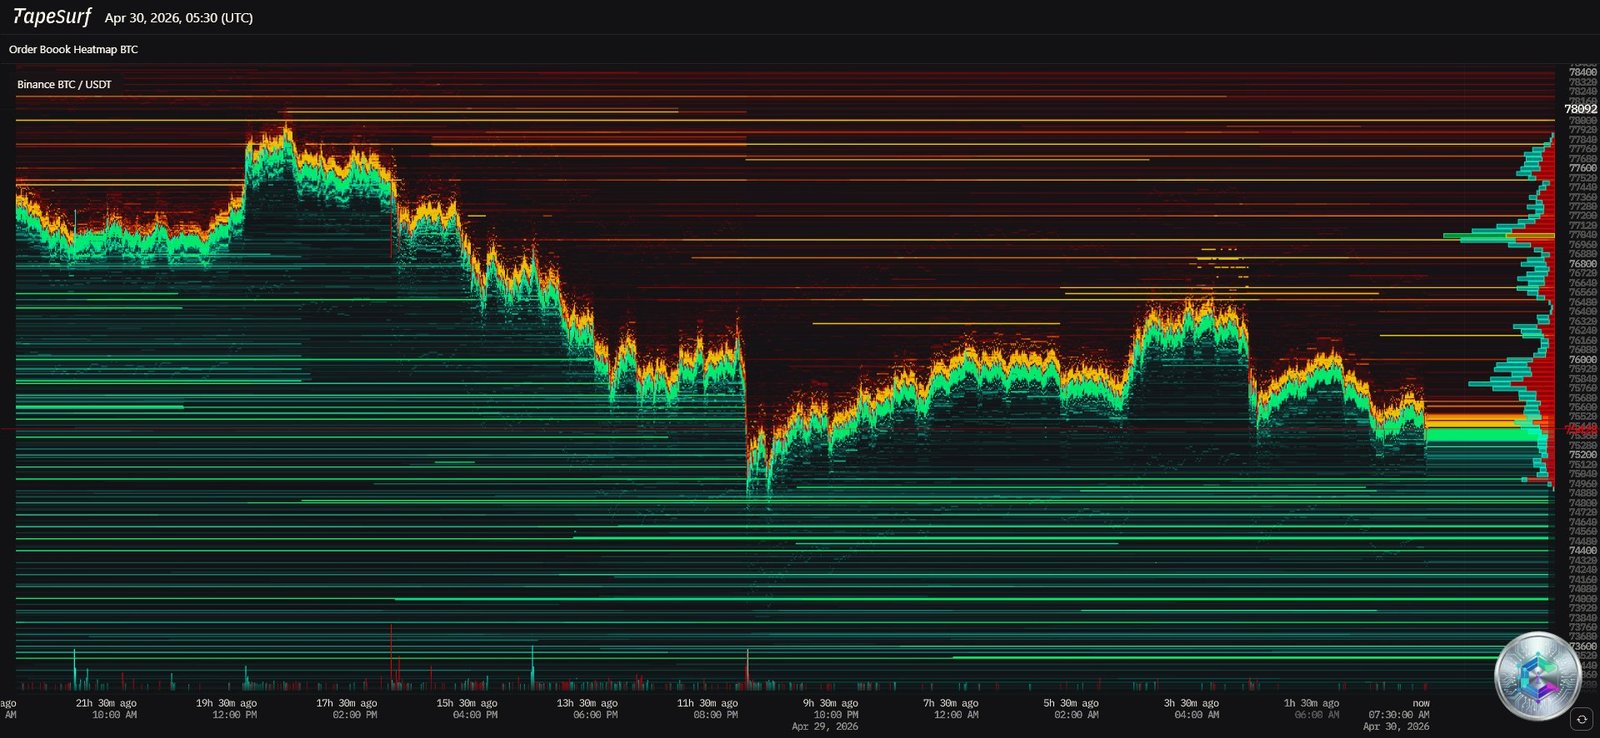
The TapeSurf heatmap as of April 30, 2026 reveals a vice-like architecture around current prices:
- Liquidity Ceiling ($77,000–$79,000): Dense orange-to-red horizontal lines representing massive sell walls and liquidation thresholds for over-leveraged long positions. Even larger clusters persist higher, with over $700 million in positions at risk of being squeezed above $88,400, and colossal documented liquidation walls around $94,000–$96,000.
- Liquidity Floor ($74,000–$75,000): A dense bed of green lines representing a structural safety net of limit buy orders. If this wall breaks, the order book dries up rapidly toward $72,000, a level where institutional buyers have historically demonstrated strong willingness to absorb supply.
The market is currently compressed in a liquidity vise between $75,000 and $77,700. Market-making algorithms navigate precisely between these two walls, extracting value from intra-channel volatility while priming the market for an explosive directional break.
4. Multi-Timeframe Technical Analysis
Daily Chart (1D): The War of the Moving Averages
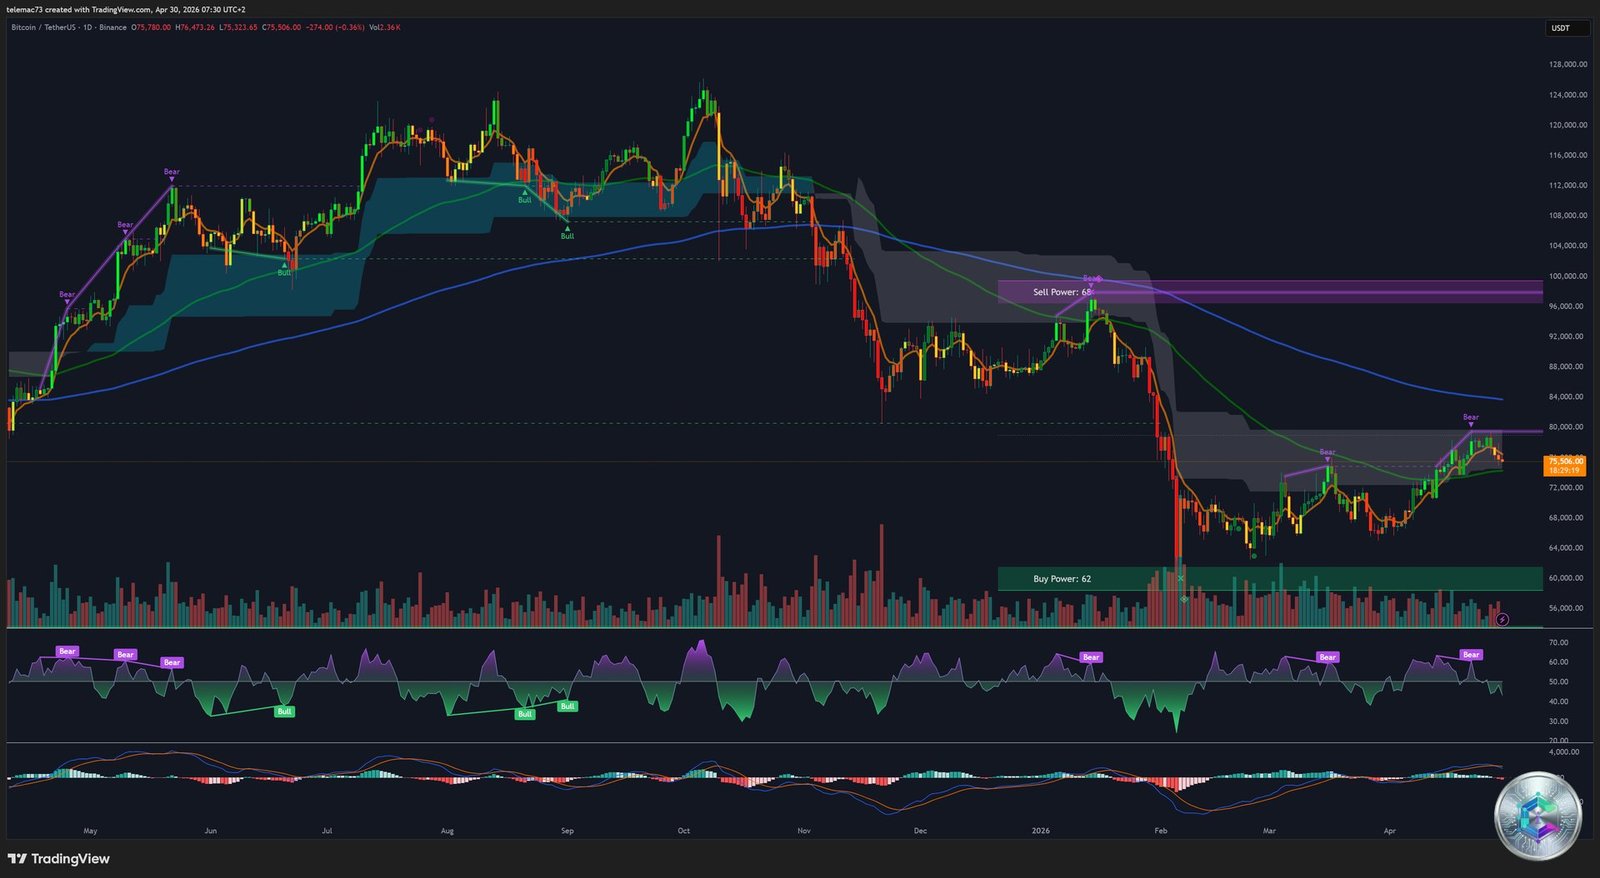
On the daily chart, Bitcoin currently trades around $75,500, sitting beneath the looming 200-Day Moving Average at $82,700 — the mathematical line of demarcation separating a corrective downtrend from a validated bullish reversal. Until this level is reclaimed, the macro structure remains technically bearish.
The order blocks identified on the daily chart define the extreme boundaries of the trading range: a massive Buy Power zone around $60,000–$63,000 represents deep institutional long-term support, while an imposing Sell Power block between $96,000 and $100,000 constitutes an effectively impenetrable resistance wall in the short term. The daily MACD remains in bearish territory (slightly brightening red histogram), and the daily RSI navigates below the 50 neutral level, confirming the structural edge held by sellers on this timeframe.
4-Hour Chart (4H): Bull Flag or Bear Flag?
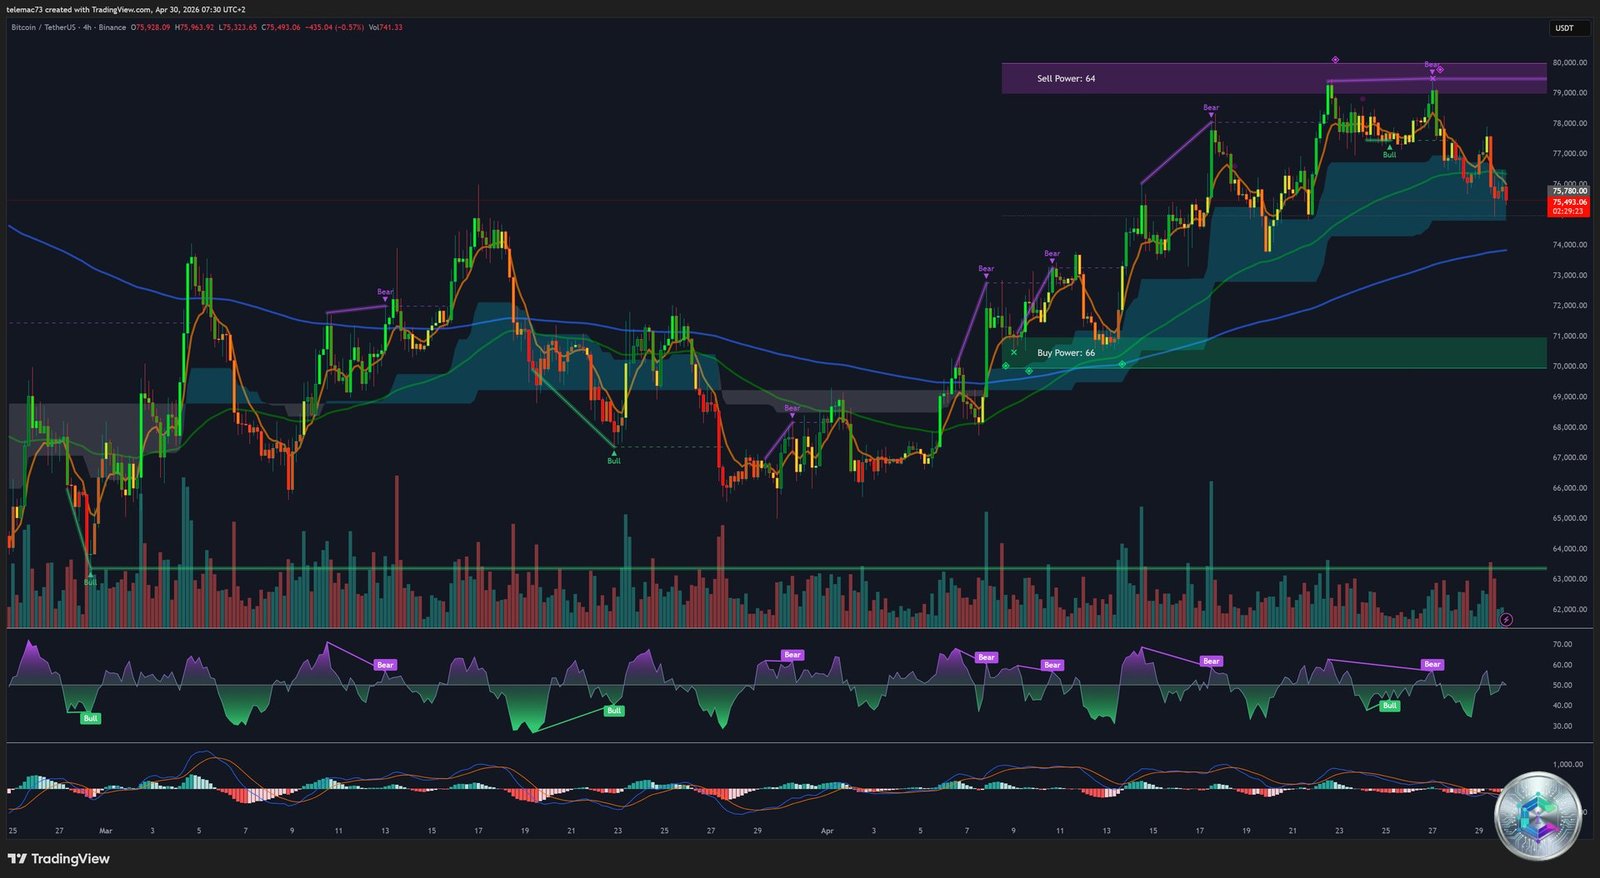
The 4H chart is the arena of the most heated analytical debate. Following a sharp rejection from $79,000, price oscillates within an ascending wedge bounded by $74,000 and $77,700. Two competing theses stand:
- 🐂 Bullish Thesis (Bull Flag): The consolidation is interpreted as a continuation pause following the impulse rebound from Q1 lows. Maintaining above the 4H 50-MA supports a favorable near-term bias, with a breakout target toward $85,000 and potentially $94,000.
- 🐻 Bearish Thesis (Bear Flag / Ascending Wedge): In classical technical analysis, an ascending wedge within a broader downtrend is an exhaustion pattern with high probability of a bearish breakdown. The 4H MACD displays a fresh Death Cross with a deeply negative histogram — an acceleration of selling momentum. The 4H RSI is pointing toward the 40 zone, confirming the rejection dynamics from the $79,000 ceiling.
| Timeframe | Indicator | Signal | Bias |
|---|---|---|---|
| Daily (1D) | 200-Day MA | Price < $82,700 | ⬇️ Macro bearish |
| Daily (1D) | MACD | Negative territory (improving) | ↔️ Neutral |
| 4H | Price structure | Ascending wedge / Bear flag | ⬇️ Bearish breakdown likely |
| 4H | MACD | Fresh Death Cross | ⬇️ Selling momentum |
| 15m | RSI | Repeated oversold readings (<30) | ↗️ Tactical bounce possible |
| 15m | Pivot | Local resistance at $76,500 | ↔️ Key intraday bias level |
15-Minute Chart (15m): Deep in the Chop Zone
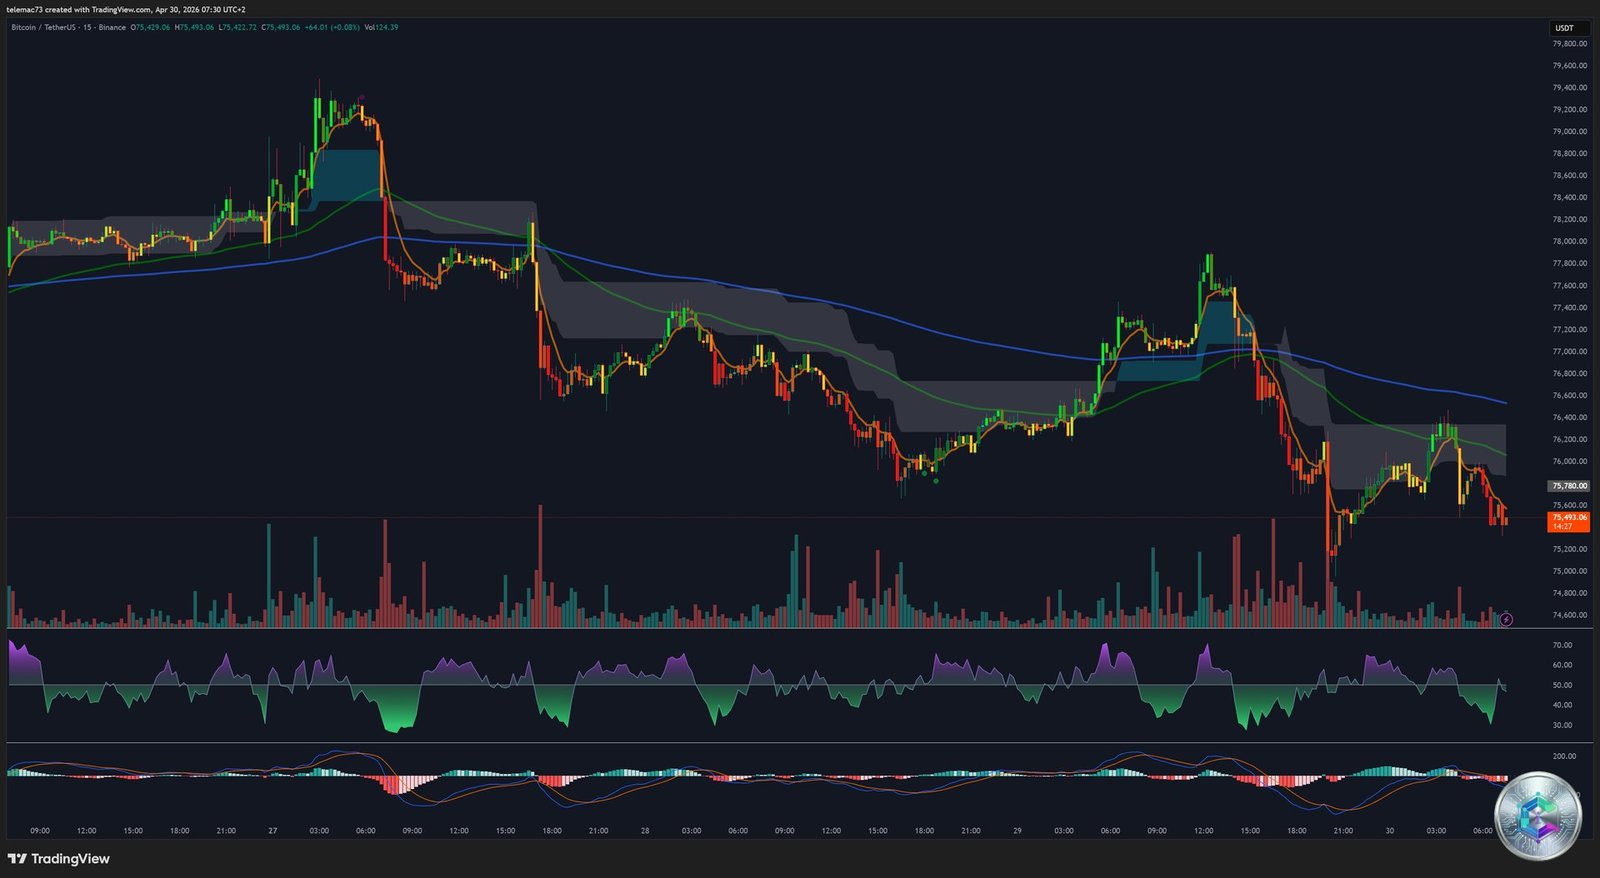
The 15m chart exposes the ferocity of intraday battles. Following the sharp drop from $79,000, price is oscillating erratically in a « chop zone » around $75,500. In the intraday context, the critical level is $76,500: as long as price remains below this pivot, the very short-term bias stays bearish. Below current price, the absolute support sits at $75,000 — a break of this floor would expose Bitcoin to a rapid decline toward $72,000.
The 15m RSI has repeatedly plunged below 30 (extreme oversold territory), signaling repetitive algorithmic selling exhaustion. These episodes have generated sharp but unsustained technical bounces. More notably, the 15m MACD — after deeply negative readings — is showing signs of compression and line convergence. An emerging tactical Golden Cross below the zero line could catalyze a short-term relief rally back toward the $76,500 pivot for a decisive retest.
5. Historical Cyclicality: April’s Place in Bitcoin’s Story
Historically, April has been Bitcoin’s premier « green month »: since 2013, the asset has closed positively in 9 out of 13 instances, averaging +11%, with a streak of +30% average gains between 2016 and 2020. But the exceptions are instructive: -17% in April 2022 (aggressive Fed rate hikes) and -15% in April 2024 (geopolitical escalation).
April 2026 fits squarely in this lineage of macroeconomic disruption, with neutral-to-slightly-bearish volatility. The weight of the worst Q1 in Bitcoin’s history (3 consecutive red months, -23%) bears heavily on market psychology. Furthermore, with the next Halving not expected until 2028, there is no near-term cyclical tailwind to counteract macro headwinds. The market is navigating on feel, without an immediate narrative catalyst, awaiting a resolution of its tightly compressed structure.
6. Strategic Synthesis: An Explosive Stasis
Bitcoin at end of April 2026 is a market in explosive stasis: robust long-term fundamentals masked by acute short-to-medium term technical vulnerability. The resolution of the compressed range ($75,000–$77,700) will be violent in either direction:
- Bullish Scenario ✅: Successful institutional defense of $75,000 → devastating short squeeze → breakout above $77,700 → target $82,700 (200-Day MA), then $94,000–$96,000 (Sell Power block).
- Bearish Scenario ❌: Capitulation break below $75,000 → cascading long liquidations → $72,000, then $61,000 (deep institutional Buy Power). Completion of the Q1 2026 cyclical purge ahead of a potential bullish renaissance.
The institutional conviction — exemplified by $2.4 billion in ETF inflows during April’s price decline — and the regulatory horizon unlocked by Kevin Warsh provide solid structural foundations for the next cycle. But in the short term, patience is paramount: the market must first exhaust its excesses before resuming a structurally upward trajectory.
⚠️ Disclaimer: This article is published for informational and educational purposes only. It does not constitute investment advice, nor a recommendation to buy or sell cryptocurrencies or any other financial asset. Cryptocurrency markets are highly volatile and carry significant risk of capital loss. Always conduct your own research (DYOR) and consult a qualified financial advisor before making any investment decision.