
As of April 29, 2026, Bitcoin is navigating one of those high-friction zones that seasoned traders dread: a technical crossroads where a single candle could define the trend for the entire quarter. At ~$76,000 – $77,650, the asset drifts in no man’s land between determined institutional buyers and a seller-side resistance wall of rarely-seen density. This analysis dissects every available signal — macro headwinds, capital flows, order book microstructure, and multi-timeframe charting — to map the most probable scenarios ahead.
1. Macroeconomic Context: The Headwinds
The total crypto market cap stands at $2.64 trillion, displaying remarkable structural resilience despite a hostile environment. Bitcoin maintains a dominant position with market dominance between 57.97% and 58.01% — a clear flight-to-quality signal within the asset class itself. The Fear & Greed Index sits at a concerning 26, firmly in « Fear » territory, while 24h volumes stagnate around $79–80 billion, reflecting a pronounced drain of speculative capital.
The current price represents a ~30% retracement from the all-time high of $126,200 reached in October 2025. Three macro forces are dictating this consolidation phase:
- Geopolitics: The stalled US-Iran ceasefire negotiations maintain constant upward pressure on crude oil (Brent). The Strait of Hormuz has been restricted to fewer than 10 vessels per day — just 8% of pre-war transit levels — feeding persistent inflationary fears that suppress risk appetite globally.
- Monetary Policy: The threat of Fed Chair Jerome Powell’s dismissal and Kevin Warsh’s confirmation hearings have created paralyzing institutional uncertainty. Galaxy Digital’s Michael Novogratz has publicly stated he doesn’t expect Bitcoin to cross $100K in 2026 without monetary easing, noting BTC must first « chop through » the $80,000–$85,000 resistance zone.
- Regulatory Friction: The CFTC’s offensive against prediction markets and ongoing DeFi pressure have had a measurable retail impact — Robinhood’s (HOOD) stock fell 8% after reporting a 47% drop in crypto trading revenues.
2. Institutional Capital Flows
MicroStrategy: Leverage Engineering and Systemic Risk
MicroStrategy now holds 818,334 BTC, financing acquisitions through preferred share issuances (STRC) at an 11.5% dividend — an aggressive premium over traditional junk bonds. In just eight weeks, the firm absorbed $7.2 billion in Bitcoin, a move Bitwise’s CIO Matt Hougan identifies as the primary driver of the 20% BTC recovery from February lows.
The liability ratio (total debt + preferred shares vs. BTC holdings) stands at 33% — $21B in liabilities against $63B in BTC assets. The estimated systemic risk threshold is ~50%, still a distance away, yet the latent « death spiral » risk (a prolonged bear market forcing BTC liquidation to service debt) remains a structural overhang on the entire market.
Spot Bitcoin ETFs: Between Euphoria and Profit-Taking
Between April 13–23, US Bitcoin spot ETFs recorded 9 consecutive sessions of net inflows totaling $2.1 billion. BlackRock’s IBIT captured up to 91% of weekly flows, surpassing 806,700 BTC under management (3.8% of total circulating supply). April’s total inflows reached $2.43 billion, far exceeding the $1.32 billion recorded the previous month.
The reversal was sharp: on April 27, ETFs suffered $263 million in net outflows in a single session — the largest single-day hemorrhage since mid-April. Fidelity’s FBTC led with $150M in outflows, followed by Grayscale ($47M) and ARK 21Shares ($43M). Notably, BlackRock IBIT and Morgan Stanley MSBT reported stable or zero flows, highlighting the structural divide between tactical speculative capital and long-horizon institutional money.
3. Market Microstructure: Decoding the Order Book Heatmap
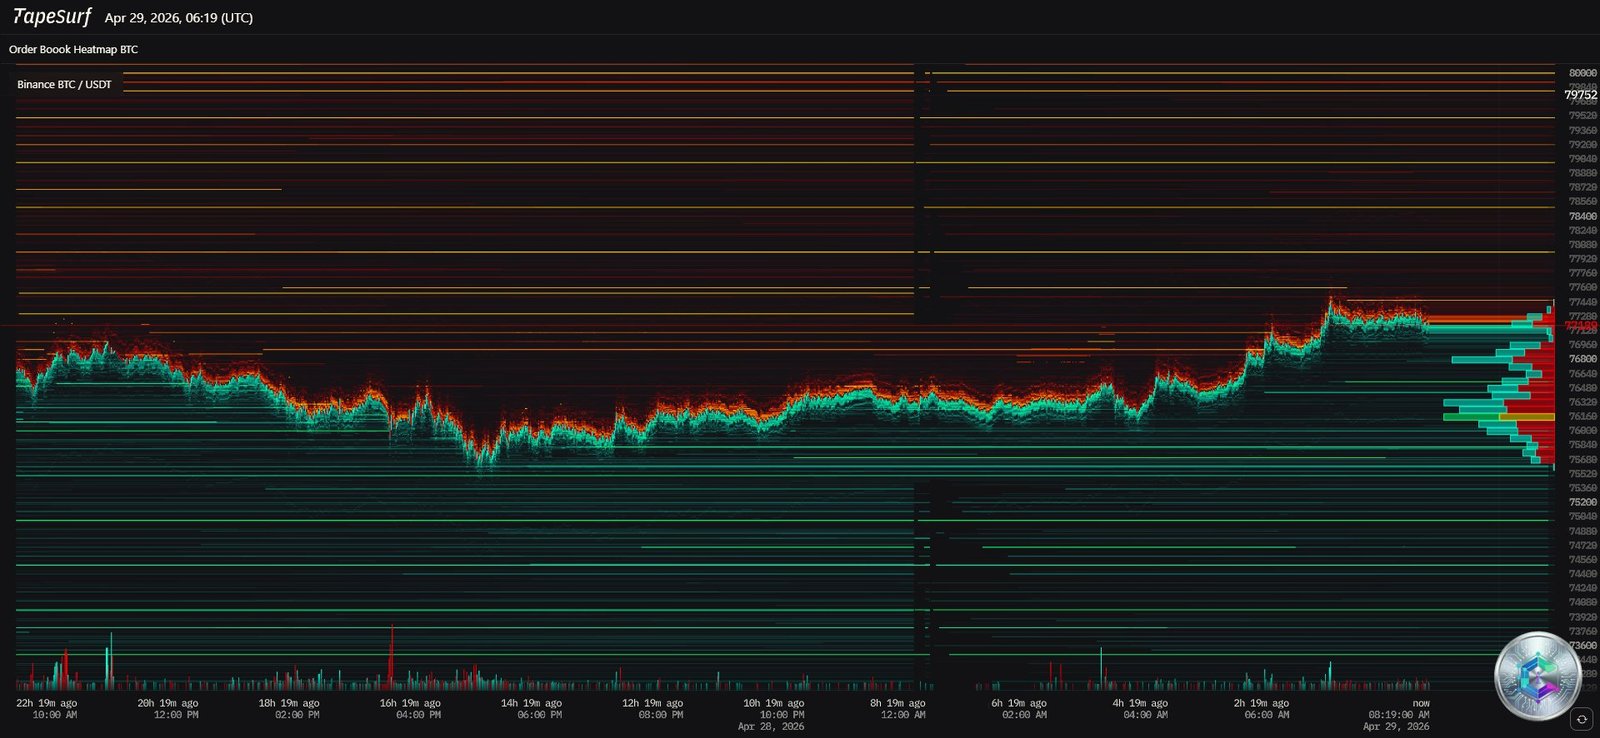
The order book heatmap leaves little room for interpretation: above the current price ($76,000–$77,000), an extremely dense layer of bright red to deep orange horizontal strata thickens significantly between $77,500 and $80,000. This « brick wall » of sell-side liquidity instantly absorbs each upward push, turning this zone into a near-impenetrable glass ceiling absent a major exogenous catalyst.
Below current price, Binance perpetual liquidation data reveals massive clusters of over-leveraged long positions concentrated around $71,800 — retail traders positioned at 50x–100x leverage, betting on an $80,000 breakout. A break of the first support layer near $74,000 could trigger a cascading long squeeze, algorithmically vacuuming price toward this liquidity abyss.
4. Multi-Timeframe Chart Analysis
Daily Chart: Macro Distribution Phase
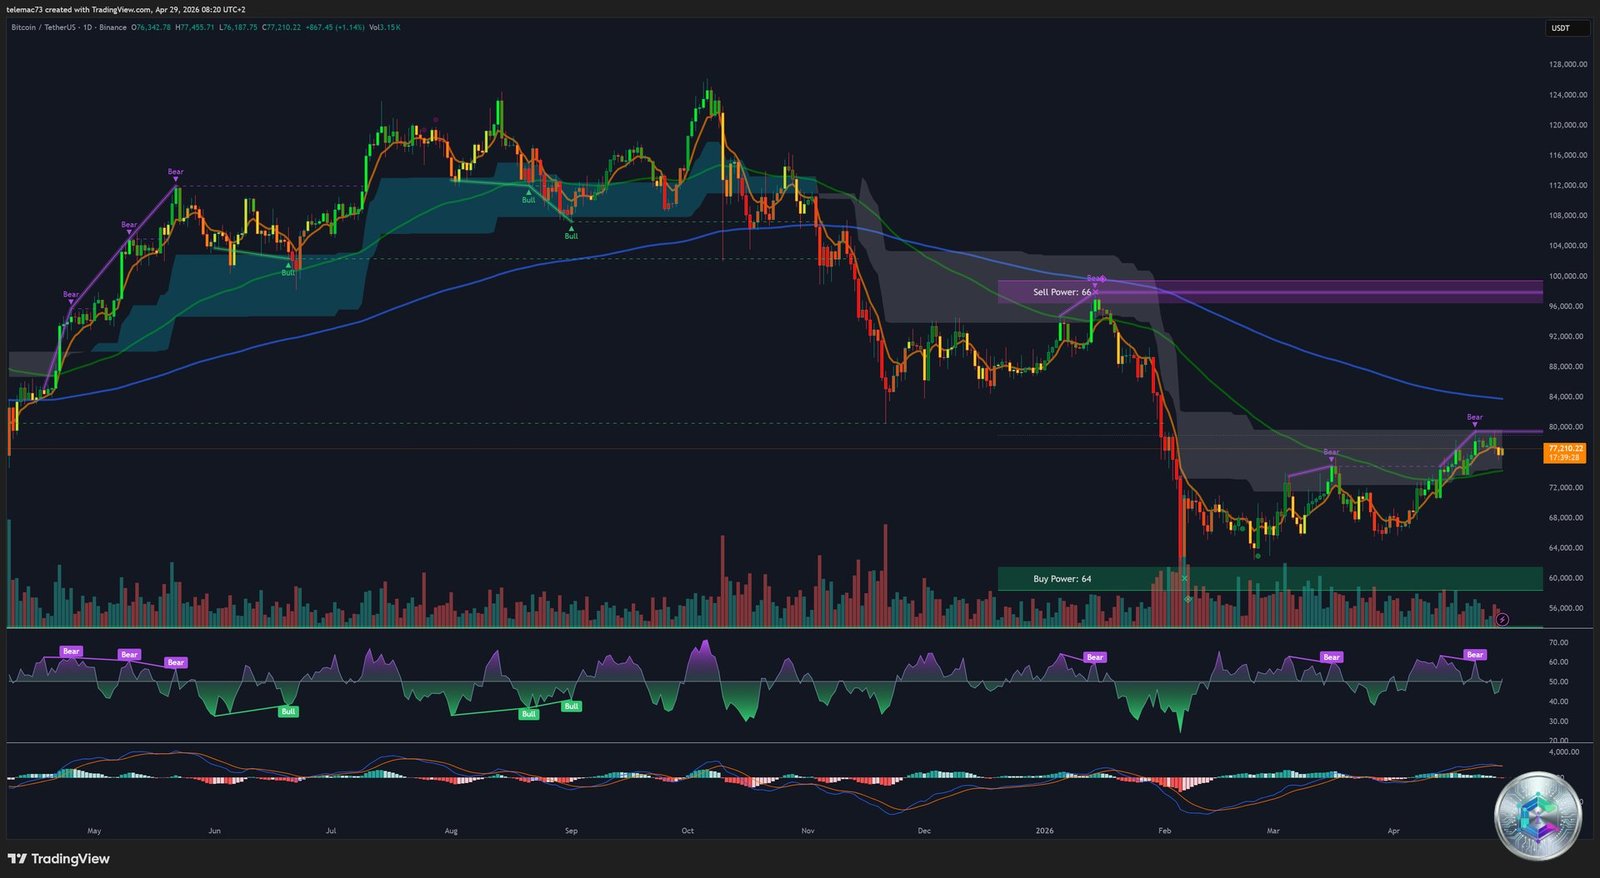
The daily chart paints a sobering picture. Price drifts in technical no man’s land between an institutional sell block ($90,000–$100,000, « Sell Power 66 ») and a defensive accumulation zone ($60,000–$65,000, « Buy Power 64 »). The Death Cross is confirmed: SMA 50 (77,144) has crossed below SMA 200 (77,409), validating a major structural bearish signal.
The daily MACD registers a deeply negative value of -240.7, while the RSI (14) idles at 45.88 — below the neutral 50 line — signaling complete directional inertia. The market is frozen, awaiting an external catalyst to break the deadlock.
4-Hour Chart: The Rising Wedge Bull Trap
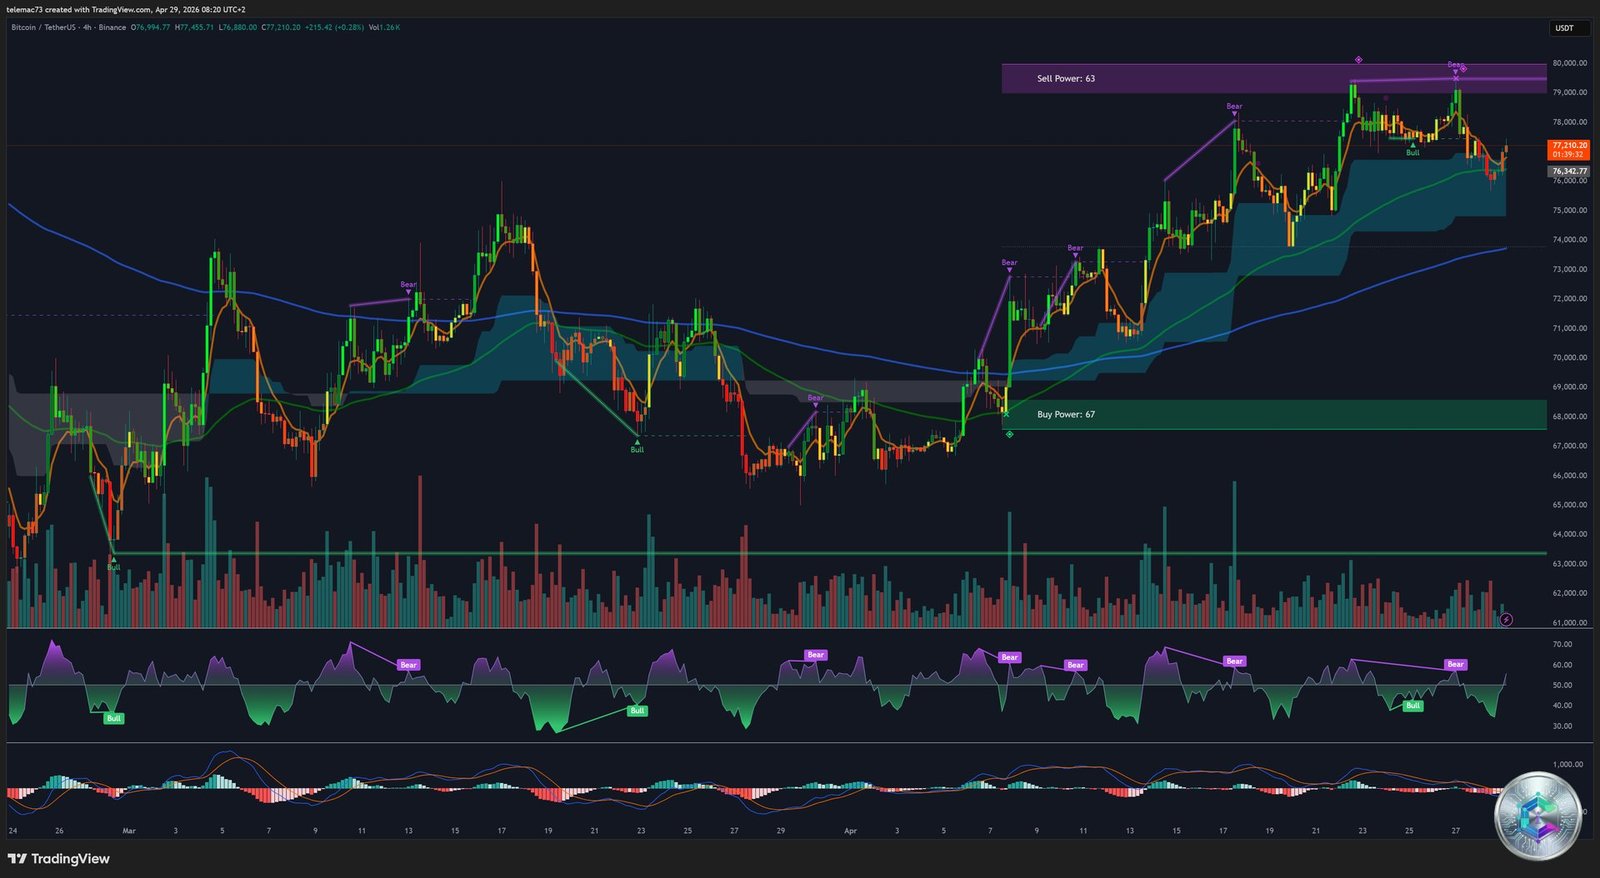
The H4 timeframe reveals a textbook bear trap setup: a rising wedge (Ascending Wedge) that doubles as an academic Bear Flag in the context of the macro downtrend. Local highs are repeatedly capped at $77,700 (marked by a « Sell Power 63 » band), while each successive upward impulse weakens progressively.
Classic charting statistics assign rising wedges a breakdown probability exceeding 60%. Both StochRSI and MACD on H4 signal momentum exhaustion. A confirmed break of the ascending support trendline would initially target $74,000, opening the door to the critical liquidity void at $71,800.
15-Minute Chart: Stop Hunts and HFT Noise
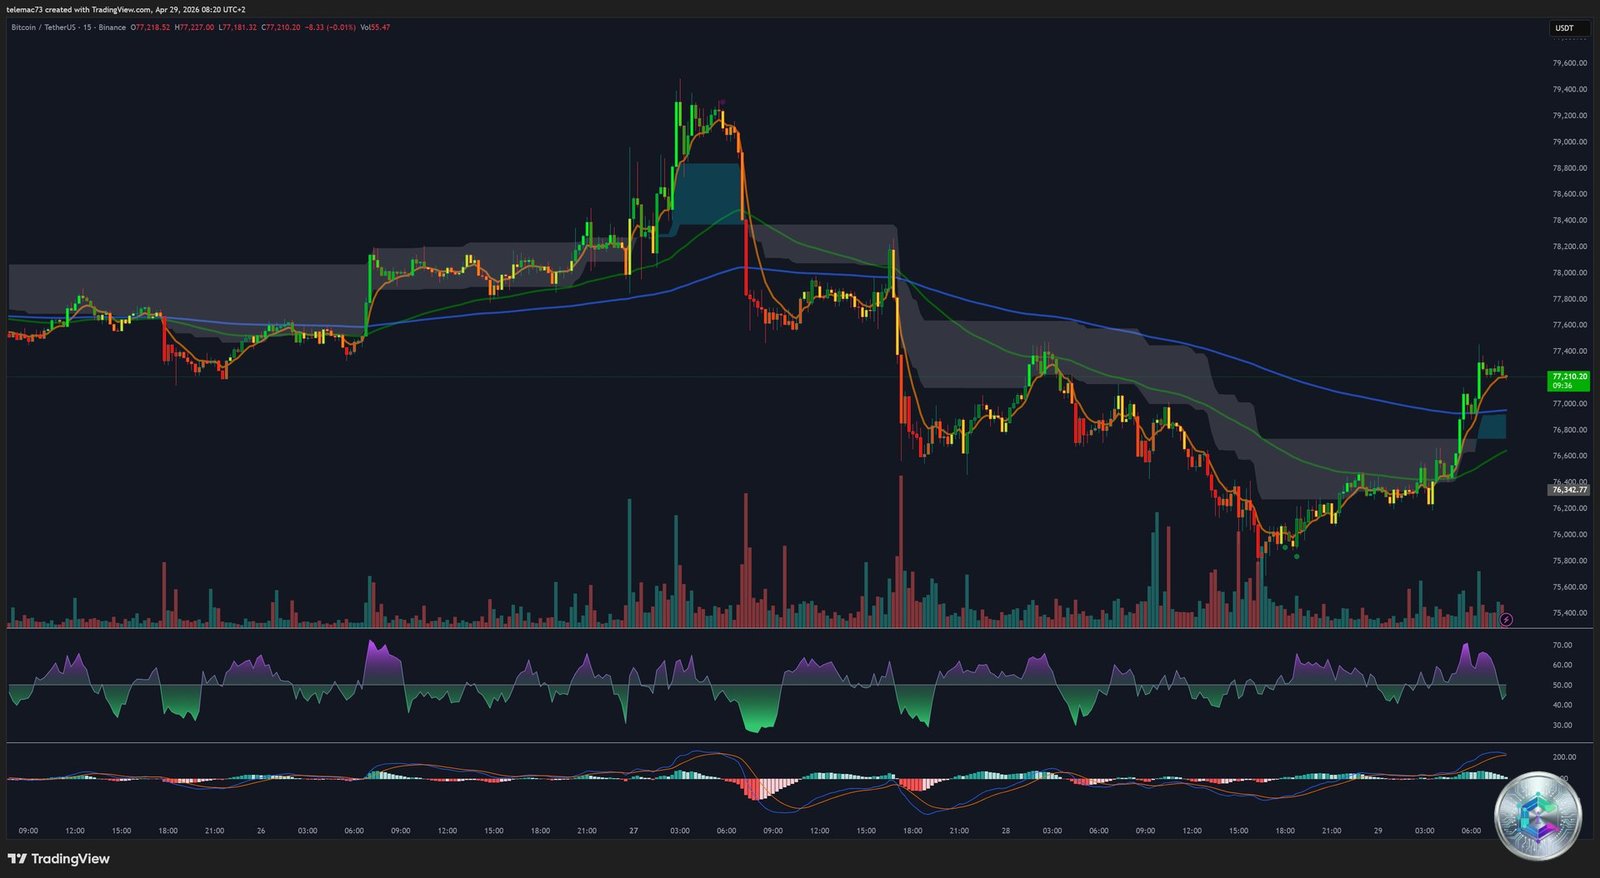
On M15, HFT algorithms dominate: the choppy, saw-tooth price structure around the $76,000–$77,200 corridor is characteristic of a pure stop-hunting environment. The MACD histogram shows slight improvement (lighter red bars), suggesting a brief mean-reversion bounce (dead cat bounce) may be forming. RSI brushes oversold territory (below 30), mechanically triggering algorithmic mean-reversion buy programs.
Yet the inability to print convincing Higher Highs above $77,210 confirms the asymmetry: every single bounce is sold into for liquidity.
5. Quantitative Indicator Summary
| Indicator | Value (Daily) | Signal |
|---|---|---|
| SMA 50 | $77,144 | 🔴 Sell |
| SMA 200 | $77,409 | 🔴 Sell (Death Cross) |
| RSI (14) | 45.89 | ⚪ Neutral |
| MACD (12,26) | -240.7 | 🔴 Sell |
| Stochastic (9,6) | 99.79 | 🟡 Overbought ST |
| Williams %R | -0.27 | 🟡 Overbought ST |
| Bull/Bear Power | -36.48 | 🔴 Sell |
| ATR (14) | 264.32 | ⚠️ Compressed Volatility |
The algorithmic scorecard is unambiguous: 5 shallow buy signals versus 7 heavy structural sell signals. The ATR compression may be the most explosive signal of all — historically, artificially suppressed volatility precedes kinetic expansions of extreme directional violence.
6. Resolution Scenarios
Scenario 1 — Bullish Breakout (Minority Probability)
To invalidate both the H4 rising wedge and the daily Death Cross, the market needs a decisive, volume-backed breakout above $77,700, followed by a clean daily close through the heatmap’s red wall up to $80,000. Such a move would require an extraordinary exogenous catalyst: an emergency Fed rate cut, a tsunami of ETF inflows reversing the April 27 outflow, or a nation-state accumulation revelation. If achieved, Fibonacci extension targets climb to $84,000, then $85,000–$87,000, with a hypothetical test of $92,000. The $100K level remains a mathematical aberration without quantitative easing.
Scenario 2 — Structural Breakdown (Asymmetric Majority Probability)
The current configuration heavily favors a bearish resolution, algorithmically executed in stages:
- Loss of $75,000 → automatic stop-loss cascade from late breakout buyers
- Break below $74,000 → market makers pull bids, free-fall acceleration begins
- Cascade liquidation of over-leveraged longs → long squeeze targeting $71,800
- Extreme macro capitulation (Hormuz blockade + tech equity crash) → extension toward $65,000, potentially $59,100
Strategic Conclusion
Bitcoin at the threshold of May 2026 operates in a state of extreme structural friction. Institutional support anchors (MicroStrategy, BlackRock IBIT) provide a theoretical price floor, but they are structurally insufficient in the near term to overcome the gravitational pull of a globally restrictive macroeconomic regime.
The convergence of bearish MACD divergences on the daily, the confirmed Death Cross, and the rising wedge on H4 all point toward a corrective resolution. The market urgently needs to flush excess leverage through a violent return to the $70,000–$71,800 liquidity pools before a healthy new expansion phase becomes viable.
The key level to watch: A sustained daily close above $80,000 backed by organic institutional volume remains the sole condition that could technically invalidate this macro-structural bearish thesis.
⚠️ Disclaimer: This article is written for educational and informational purposes only. It does not constitute investment advice or a recommendation to buy or sell any digital asset. Cryptocurrency markets are highly volatile and carry significant risk. Always conduct your own research (DYOR) and consult a qualified financial advisor before making any investment decision.