
Introduction: A Market Caught Between Fear and Strategic Accumulation
As of April 26, 2026, Bitcoin (BTC) is navigating a critical, multi-dimensional consolidation phase. The market is a battleground for antagonistic forces of rare intensity: on one side, unprecedented institutional adoption fuelled by massive liquidity injections; on the other, persistent geopolitical friction and a global risk-aversion sentiment generating erratic volatility on lower timeframes. BTC is trading in a tight range oscillating around $77,369 to $77,500.
The global crypto market capitalisation holds at a robust level of $2.67 to $2.68 trillion, with daily trading volume oscillating between $48 and $51 billion — signalling sustained liquidity but hesitant directional conviction from retail operators. Bitcoin dominance is firmly established around 58.12%, confirming its status as the primary reserve asset of the ecosystem.
Yet despite a valuation near recent local highs, the Fear & Greed Index displays a notably low score of 33, signalling a predominant state of « Fear » among retail investors. This stark divergence between structurally bullish price action on higher timeframes and a bearish psychological sentiment reveals the classic wall of worry: institutional capital — the « Smart Money » — continues accumulating aggressively and methodically, while retail remains paralysed by uncertainty.
Fundamental Catalysts and Geopolitical Shocks
Middle East Tensions and Bitcoin’s Resilience
The geopolitical environment is acting as the primary short-term volatility driver. The unexpected cancellation of a high-level US diplomatic mission to Iran — involving Steve Witkoff and Jared Kushner — momentarily sent Bitcoin down 0.31% to $77,369. In a market that abhors uncertainty above all else, this announcement rekindled fears of Middle East escalation, pushing operators to liquidate risk assets in favour of US dollar liquidity.
The market’s response was swift. The announcement of an indefinite extension of the Iran ceasefire acted as a powerful bullish catalyst, propelling BTC up +3.7% to a 10-week high of $79,010 — its strongest levels since early February. This sequence demonstrates that while Bitcoin is often called « digital gold, » it continues to behave, during acute panic moments, in a manner highly correlated with traditional risk assets.
Bitcoin Recognised as Critical Geopolitical Infrastructure
Admiral Samuel Paparo, head of the US Indo-Pacific Command, recently testified before the Senate, describing Bitcoin as a « computing tool with incredible potential for zero-trust, peer-to-peer value transfer », suggesting applications extending beyond economics to support instruments of national power. This recognition from the highest echelons of American military leadership, in direct response to Chinese Communist Party research classifying BTC as a strategic asset, fundamentally alters the long-term investment thesis: Bitcoin is no longer a mere speculative asset — it is critical geopolitical infrastructure.
Additionally, at a private event bringing together culture and finance personalities, Donald Trump vigorously defended pro-crypto legislation, declaring that « cryptocurrency is the future of finance and America must lead it, » further institutionalising the asset class in the United States.
Systemic Liquidity: Stablecoins and Spot ETF Flows
One of the most powerful macro-financial signals of April 2026 is the explosive expansion of Tether (USDT) supply. Over just two weeks in mid-April, USDT supply recorded a staggering growth of approximately $5 billion, bringing total circulation to just under $150 billion — the fastest growth rate since early 2025.
This massive expansion indicates that a colossal amount of « dry powder » capital is currently parked on exchanges, awaiting a resolution of macroeconomic uncertainties or confirmation of a major technical breakout. Historically, previous major USDT supply expansions have preceded parabolic Bitcoin rallies — as seen during the run toward $100,000 in late 2024.
In confluence, inflows into Bitcoin Spot ETFs maintain an exceptionally robust trajectory: nearly $996.4 million in net inflows in the single week preceding this analysis. The combination of stablecoin expansion and institutional buying via ETFs creates a structurally unshakeable demand floor, explaining why BTC retracements during geopolitical panic remain shallow — compared to 70-80% crashes during previous cycles.
Institutional Adoption: European Banks and MicroStrategy Go All In
Capitalising on favourable regulatory guidance issued by the ECB in March 2026, banking giants Deutsche Bank and BNP Paribas have officially deployed institutional-grade trading and custody services for Bitcoin and Ethereum. This integration by globally systemically important banks (G-SIBs) provides the compliance infrastructure needed to attract sovereign pension funds and the most conservative asset managers into the market, justifying projections of a Bitcoin rally toward $150,000 by year-end.
At the corporate treasury level, MicroStrategy announced the acquisition of an additional 4,871 BTC in early April, bringing its war chest to an astronomical 766,970 BTC — approximately 3.8% of the total circulating supply. Subsequent reports revealed an even more colossal purchase of 34,164 BTC for $2.54 billion, their largest acquisition since 2024. Removing these phenomenal volumes from public exchange order books creates a permanent supply shock, amplifying the asymmetry between scarce supply and exponentially growing institutional demand.
On-Chain Metrics: The Whale vs. Retail Divide
Data extracted directly from the blockchain reveals a striking dichotomy. Addresses holding between 10 and 10,000 BTC collectively accumulated nearly 40,967 additional BTC during the first two weeks of April 2026, representing a capital injection estimated at approximately $3.17 billion. This cohort corresponds to the very definition of « Smart Money »: hedge funds, quantitative trading desks, ETF custodians, and corporate treasuries.
At the opposite extreme, wallets associated with retail investors — defined as holding less than 0.1 BTC — accumulated only 46 BTC over the same period, equating to a meagre $3.56 million. This colossal disparity illustrates an asymmetric risk distribution. According to Richard Wyckoff’s accumulation theory, a phase where large entities silently absorb massive volumes while retail remains paralysed by fear constitutes the structural definition of a re-accumulation phase inevitably preceding a parabolic price expansion.
A crucial signal: perpetual futures funding rates have recently shifted into deeply negative territory. Short sellers are paying a premium to longs to maintain their positions — revealing a derivatives market saturated with bearish positions. This configuration is the mathematical recipe for a Short Squeeze: if spot institutional buying pushes price above key resistance levels, risk management algorithms will automatically trigger forced buybacks of these short positions, injecting explosive buying liquidity capable of propelling Bitcoin toward analytical targets around $125,000.
Microstructure Analysis: Order Book Heatmap
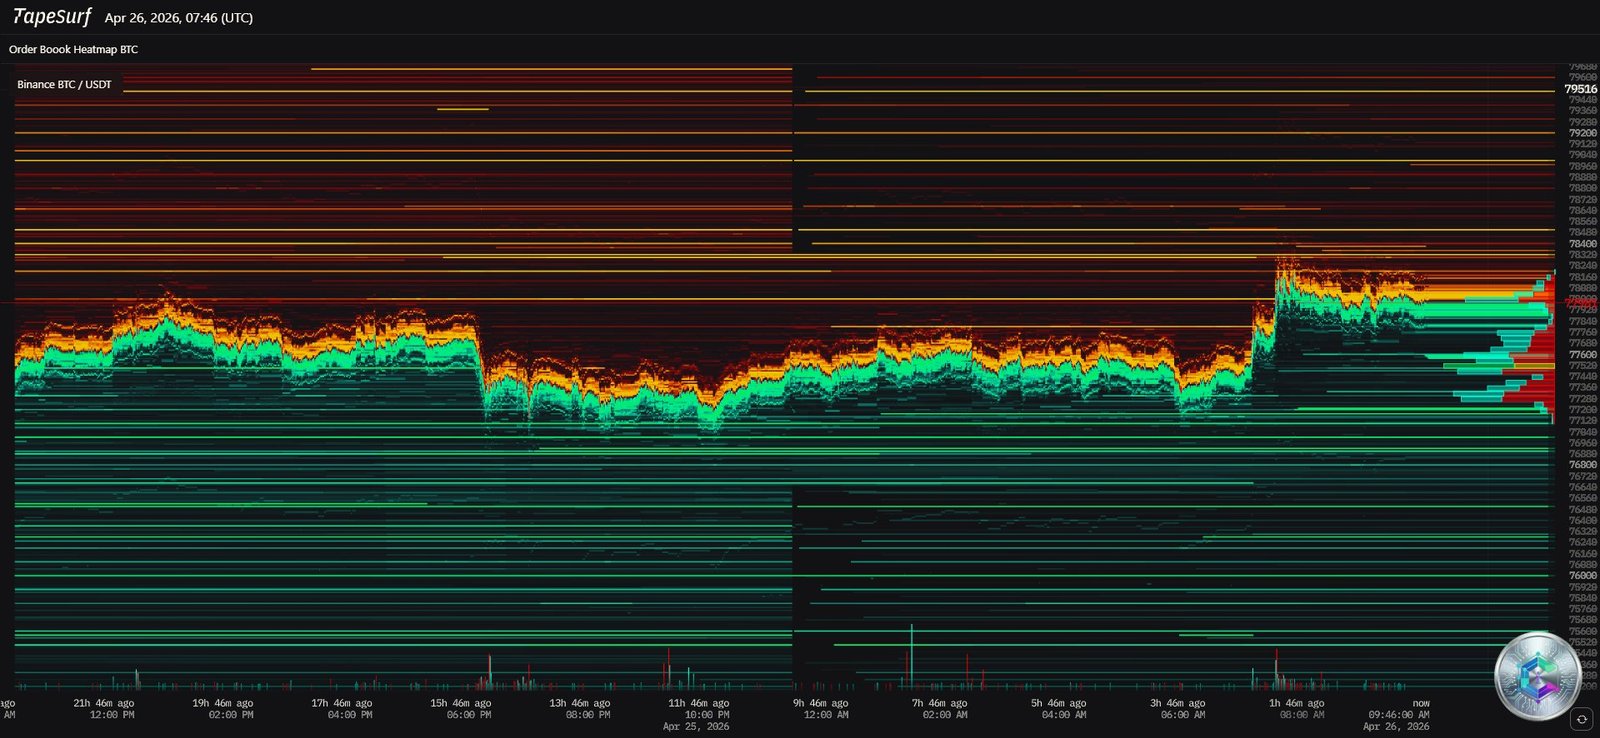
The TapeSurf order book heatmap for the BTC/USDT pair on Binance (above) provides an indispensable three-dimensional visualisation of the market, enabling detection of liquidity pools, market maker algorithm activity, and the true distribution of supply and demand beyond quoted prices.
Ask Walls: The $80,000 Fortress
The April 25–26 chronology reveals a complex stratification of limit orders. From the $78,500 zone up through $79,600 and beyond, an overwhelming density of incandescent red and orange horizontal lines is visible — colossal sell walls. The most severe concentration sits at the psychological barrier of $80,000, confirming the proprietary « Sell Power: 66 » label visible on technical charts.
Consuming this passive supply will require a herculean volumetric buying effort to allow price to ascend. This latent selling pressure explains the violent rejection Bitcoin suffered during its recent foray to $79,330. Notably, the temporal behaviour of some lines — appearing and disappearing abruptly — suggests algorithmic Spoofing practices designed to intimidate competing operators and trigger artificial price drops that allow the true accumulators to fill buy orders at more advantageous levels.
Bid Walls and Liquidity Sweeps
The lower portion of the heatmap reveals a robust support structure: multiple strata of dense green lines extending from the $77,000 zone down to $75,200. This institutional « laddering » strategy confirms that large entities have deployed staggered orders to accumulate the asset during high-volatility downturns. The levels around $73,300 constitute the ultimate line of demarcation before threatening the overall bullish structure.
Chart Analysis: Daily Timeframe
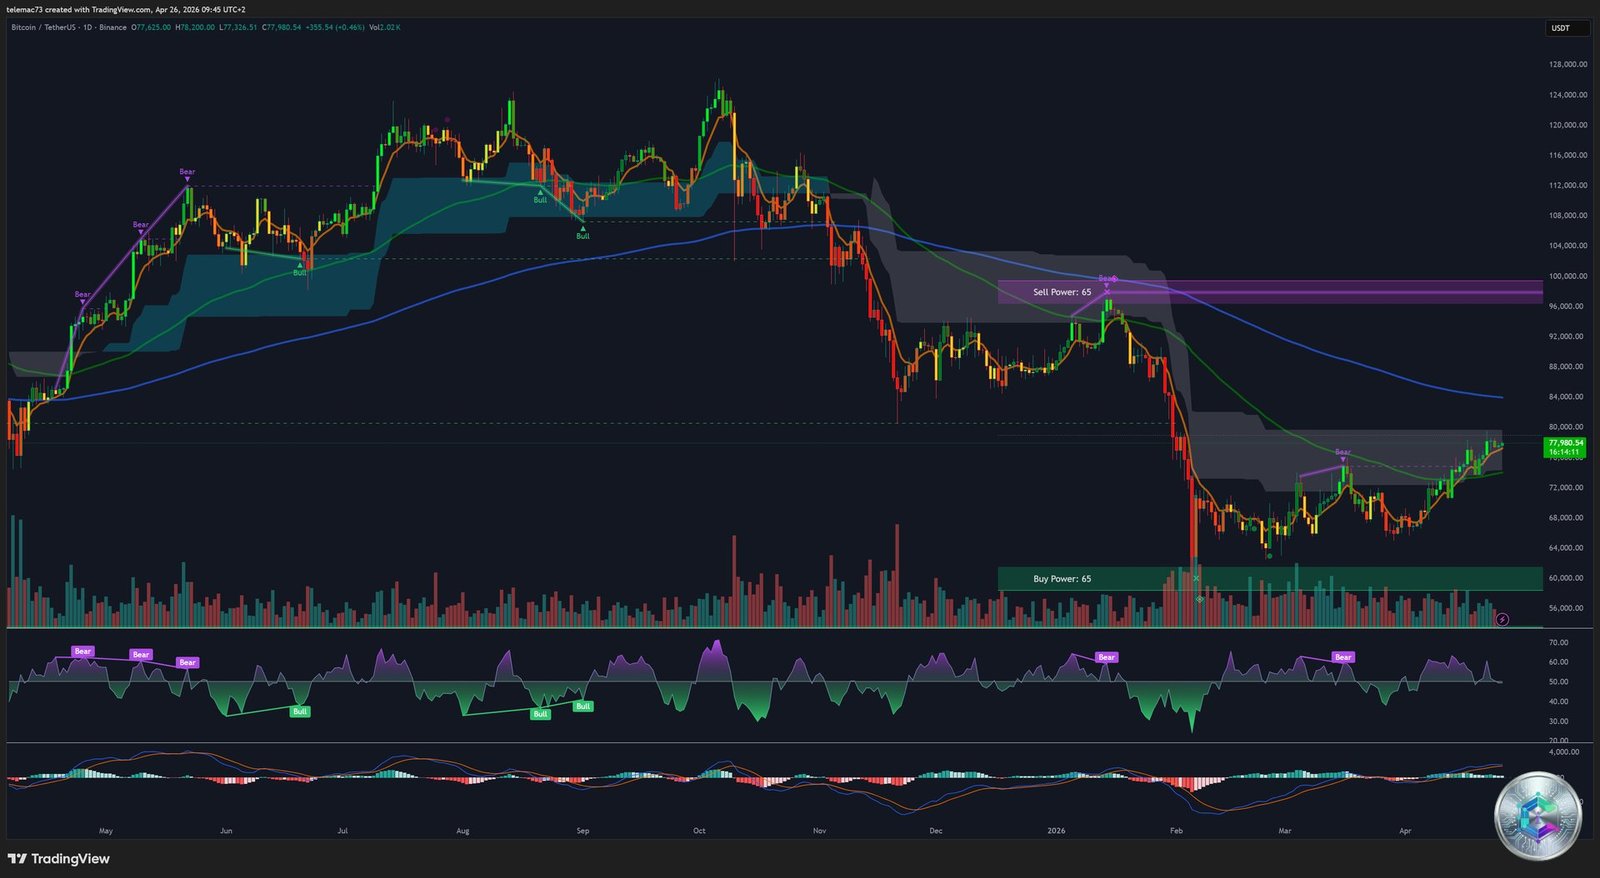
The daily chart is the primary canvas for identifying the macro trend and structural key levels that dictate Bitcoin’s medium-to-long-term trajectory. Price is currently gravitating around $77,480, having commenced a methodical recovery from previous lows. The most salient feature is the shadowed support/resistance zones — the price has recently emerged from the lower blocks and is now encountering a major resistance block labelled « Sell Power: 66 ».
Price is nonetheless trading above a long-term exponential moving average — the macroeconomic pivot of the bullish trend. As long as daily candle closes remain above this dynamic threshold (corresponding approximately to $72,000–$73,300), the overall market architecture remains intact. The RSI navigates the neutral zone (50-60), having purged the overbought excess from the recent peak to $79,000, granting the technical flexibility required to initiate a new expansion phase.
Chart Analysis: 4-Hour Timeframe (H4)
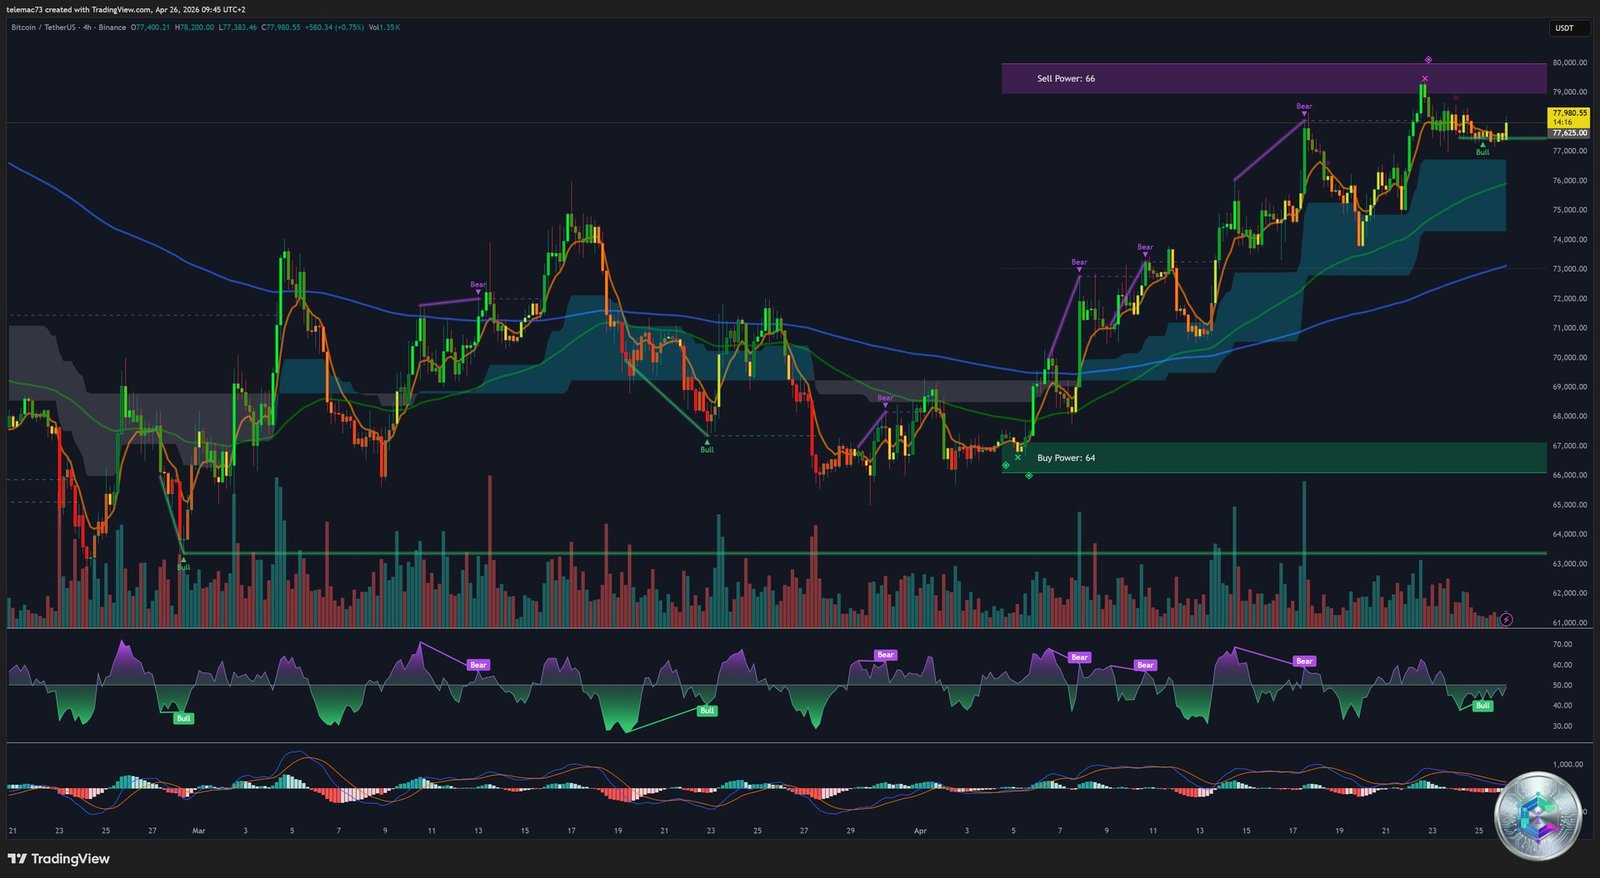
The 4-hour timeframe provides a strategic zoom into the current consolidation structure. The chart depicts a classic staircase sequence: price has engaged in a triangular compression / Bull Flag structure following the powerful ascent from lower supports. Peaks are contained by the « Sell Power: 66 » zone (purple band toward $80,000), while troughs are supported by the dynamic moving average.
The H4 MACD displays intertwined signal lines navigating very close to the zero line, with extremely small histogram bars — the visual definition of a market in precarious equilibrium, awaiting a directional liquidity flow. From a purely chartist perspective, flags and triangles within a primary bullish trend statistically resolve with an upside breakout, extending the initial impulsive move.
Micro-Structure Analysis: 15-Minute Timeframe (M15)
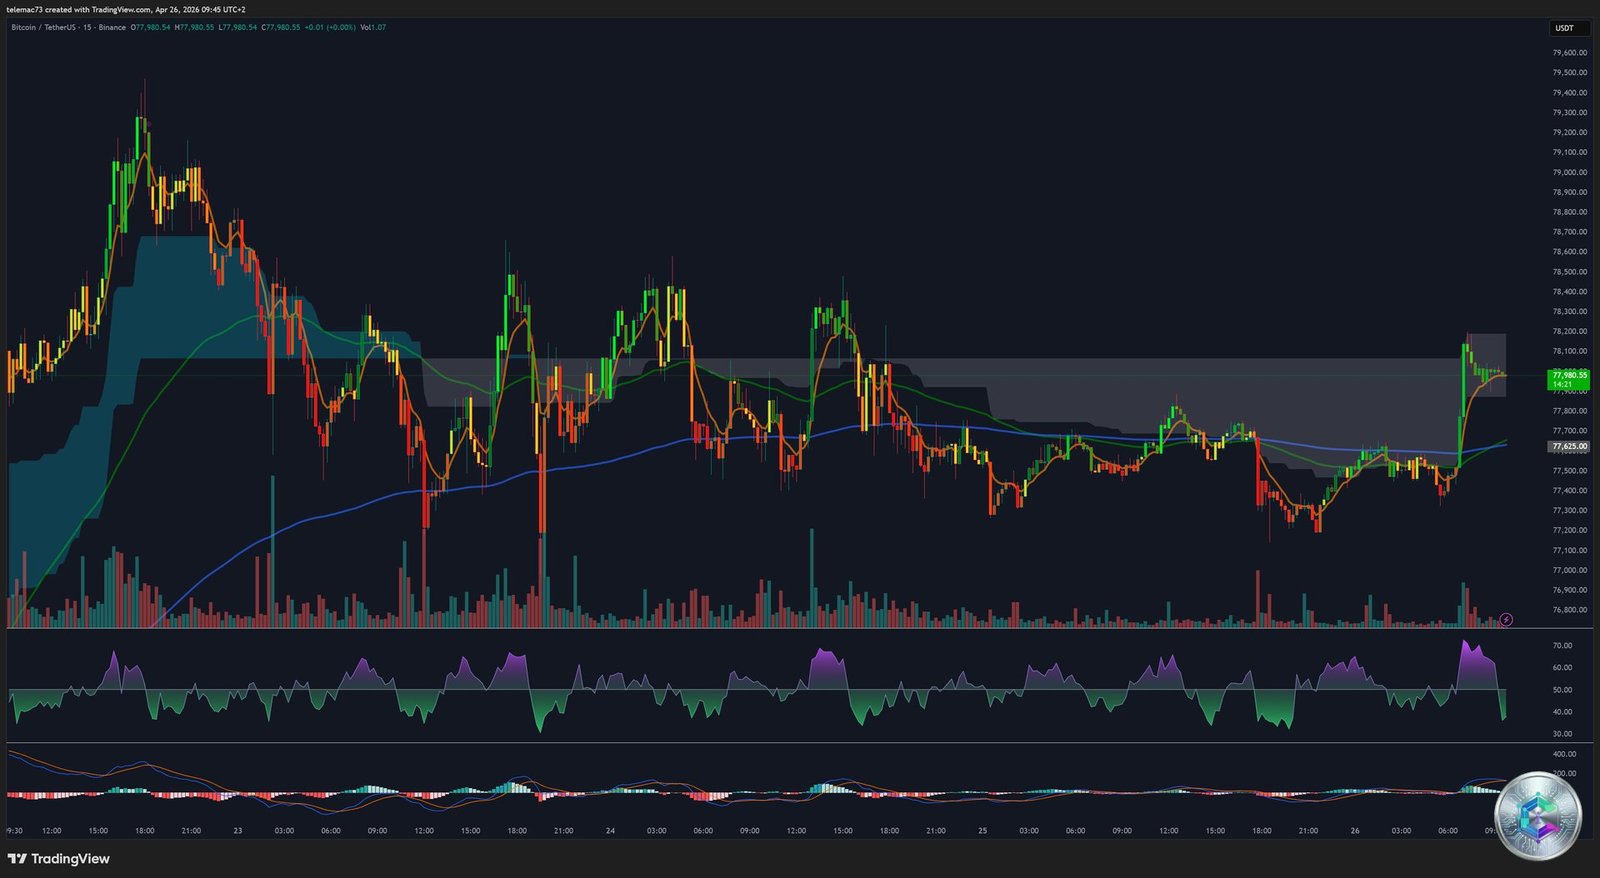
The 15-minute timeframe reveals the battle scars of recent algorithmic warfare. The right side of the chart exposes a sudden vertical collapse, represented by devastating long red candles — the liquidity purge triggered by the cancellation of Trump’s diplomatic trip, momentarily sending Bitcoin down -0.31%.
The subsequent formation is equally revealing: a long lower wick followed by a series of aggressive green candles illustrates a « V-shaped » recovery. This rejection confirms that the collapse was identified by Smart Money as a discounted accumulation opportunity — a classic Liquidity Sweep — in anticipation of the relief brought by the ceasefire announcement. The RSI had plunged into extreme oversold territory (below 30), providing the mathematical fuel needed for the subsequent ferocious mean reversion.
Summary Table: Key Levels and Technical Indicators
| Technical Metric | Level / Status | Strategic Implication |
|---|---|---|
| BTC/USDT Spot Price | ~$77,369 – $77,500 | Digestion phase in neutral zone; market awaiting direction. |
| Macro Resistance (Ceiling) | $79,330 – $80,000 | Massive passive sell wall (Sell Power 66). Requires major volumetric breakout. |
| H4 Pivot Support | ~$77,000 – $77,300 | Intraday tipping point. Holding above protects bullish structure. |
| Institutional Demand Floor | $75,000 | Underpinned by massive Spot ETF inflows. Target for liquidity hunts. |
| Structural Invalidation | $73,300 – $72,000 | Daily close breakdown = primary bullish scenario invalidation. |
| MACD (H4) | Intertwined lines / flat histogram | Imminent compression prefiguring a powerful expansive move. |
| RSI (Daily) | Neutral zone (50-60) | Excesses purged. Technical flexibility for new expansion phase. |
| Funding Rate (Perpetuals) | Deeply Negative | Short saturation — explosive Short Squeeze potential. |
Altcoins: Cross-Market Risk Appetite Signals
Ethereum (ETH) faithfully mirrors Bitcoin’s cautious stability, trading firmly above its psychological pivot of $2,300 with a stable dominance of 10.47%. Monero (XMR) offers a counter-intuitive performance: a +2.33% appreciation to $376.4 during diplomatic instability — confirming the emergence of a geopolitical Privacy Premium. XRP, at $1.42, attracts disproportionate institutional attention, supported by a clearer regulatory landscape with the SEC and analyst projections toward $10 long-term.
A notable phenomenon: Shiba Inu (SHIB) attracted 150,000 new holders in April 2026 despite a Fear & Greed Index of 33. This metric anomaly proves irrefutably that high-risk speculative capital has not abandoned the ecosystem — it is simply migrating toward low unit-price vectors in search of maximum asymmetric convexity.
Strategic Projections: The Compressed Spring
The current Bitcoin market architecture at end-April 2026 is the product of a rare confluence of forces. Bitcoin is consolidating in a bull flag formation just below the titanic $80,000 barrier. The Heatmap proves that seller walls are fiercely defending this level. However, the asymmetry lies in the heavily negative funding rates — the saturation of bearish bets creates a maximally compressed spring dynamic.
The most probabilistic projection postulates that at the slightest positive macro catalyst — US political affirmation, continued massive ETF support, or full normalisation of European banking infrastructure — Bitcoin will break free from the $79,330 resistance block. A breakout above $80,000 will instantly trigger a cascade of short position liquidations (algorithmic Short Squeeze), violently propelling prices toward $125,000 in the short-to-medium term, with end-cycle targets between $150,000 and $200,000 in the absence of systemic shocks.
In the absence of a bullish breakout, vigilance must be maintained on the $73,300 threshold. A sustained loss of this level on a daily close would justify a fundamental reassessment of the current macro-structural expansion paradigm.
⚠️ Disclaimer: This article is written exclusively for educational and informational purposes. It does not constitute investment advice, a recommendation to buy or sell digital assets, or an inducement to carry out any financial transaction whatsoever. Cryptocurrency markets are highly volatile and carry significant risk of capital loss. Please consult a qualified financial advisor before making any investment decision.