
📊 Market Snapshot — Price: ~$75,840–76,005 | 24h Change: +2.77% | Source: Binance BTC/USDT | Date: April 21, 2026, 08:38 UTC+2
Executive Summary
Bitcoin is consolidating around $76,000 on April 21, 2026, posting a +2.77% gain over 24 hours following a rebound from a daily low of $74,080. The market structure remains fragile overall, yet displays tangible signs of institutional resilience. The Fear & Greed Index sits at 28 (Fear), signalling a « contrarian bullish » environment in which sophisticated investors accumulate during broad market panic.
The TapeSurf order book heatmap reveals a heavy concentration of liquidity between $74,400 and $78,060, with price trading squarely in the middle of this range. On the macro front, geopolitical tensions (US-Iran conflict), Trump’s 10% blanket tariffs (Section 122), and uncertainty surrounding the Fed’s leadership transition continue to weigh on sentiment — without, however, derailing robust institutional ETF inflows.
Multi-Timeframe Analysis
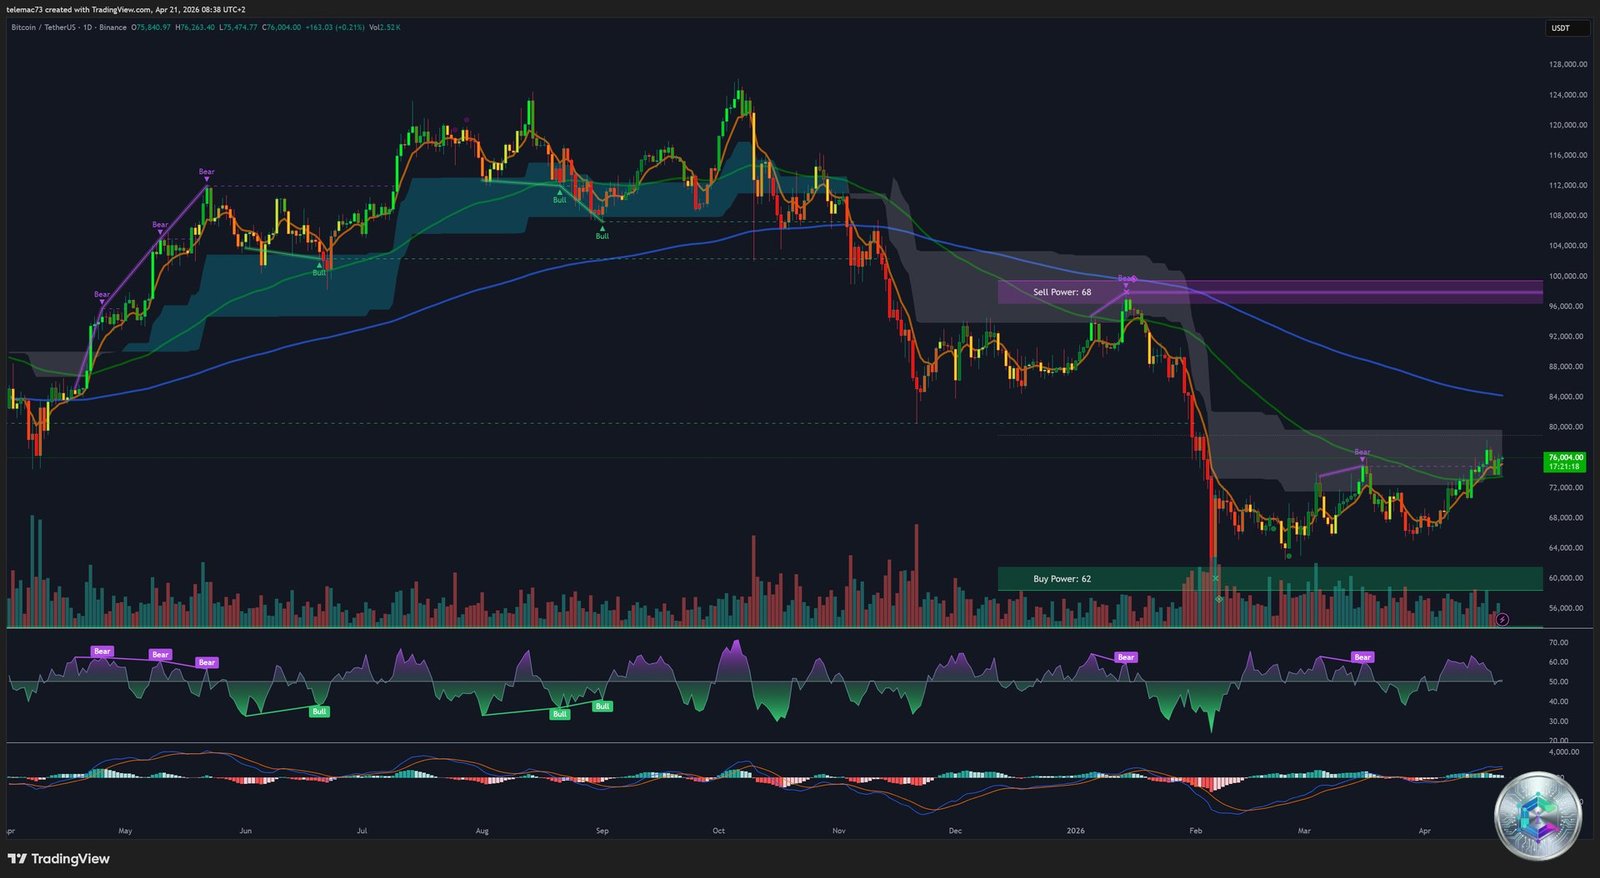
📅 Daily Chart (1D) — Macro Trend Structure
The daily chart clearly shows a deep correction from the all-time high of ~$126,000 (October 2025), with a cycle low reached near $65,000 in early 2026. The current configuration resembles a retracement/consolidation phase with a gradual recovery attempt underway.
Daily Ichimoku
- Price is trading outside the Ichimoku Cloud (Kumo), having emerged below a bearish cloud. It is currently testing the lower edge of cloud resistance.
- The Tenkan-sen (conversion line) is above the Kijun-sen (base line) — a moderately bullish short-term signal.
- Span A remains below Span B in the future cloud: the macro structure stays bearish until price consolidates above the Kumo (~$80,000–$84,000).
Moving Averages & Daily MACD
- MA 200 (~$87,000–$90,000): price is well below — long-term bearish structural signal.
- MA 50 (~$72,000): price has just reclaimed this level — positive pivot signal.
- A potential Golden Cross between the short-term MA and the MA 50 is forming if Bitcoin holds above $75,000 in the coming days.
- The daily MACD histogram is climbing back from deep negative levels: bearish momentum is exhausting. No confirmed bullish crossover yet, but convergence is underway.
- Daily RSI estimated at 42–48: neutral territory, exiting oversold — room to the upside remains available.
Chart Pattern
A potential « W Bottom » (double bottom) is forming between ~$65,000 (January 2026) and ~$67,000 (March 2026), with price recovering from the neckline (~$73,000–$74,000). Holding above $74,000 on a closing basis is a key bullish element.
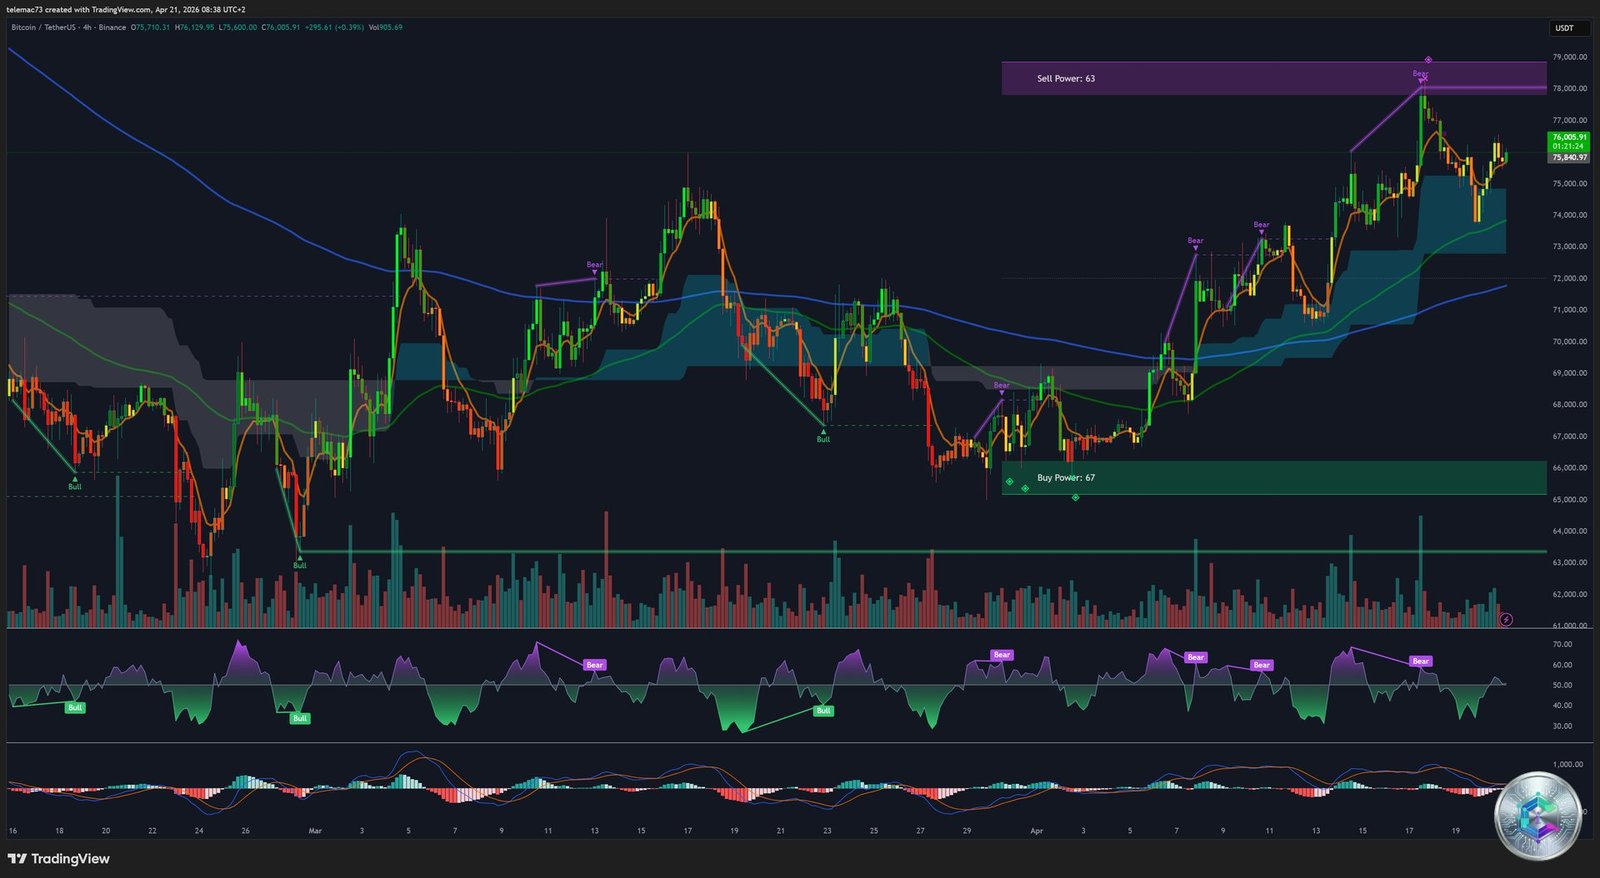
⏱️ 4-Hour Chart (4H) — Intermediate Dynamics
The 4H view reveals a strong upward move from the $65,000 low (late March 2026), posting a series of Higher Highs / Higher Lows — confirmed intermediate-term uptrend.
4H Ichimoku — Triple Bullish Configuration
Price is trading above the Kumo (green cloud) on this timeframe. The Tenkan-sen is above the Kijun-sen, and both are above the cloud: this constitutes the Ichimoku Triple Bullish configuration. The Chikou Span above past price provides additional confirmation of the bullish bias.
4H Bullish Flag
A Bullish Flag is forming: a sharp rally from $67,000 to $78,000 (the flagpole), followed by a mild descending channel consolidation (the flag). This pattern projects a continuation toward $88,000–$90,000 upon a confirmed 4H close above $77,000. A compression triangle ($75,200–$76,500) is also visible on recent 4H candles, signalling an imminent directional breakout.
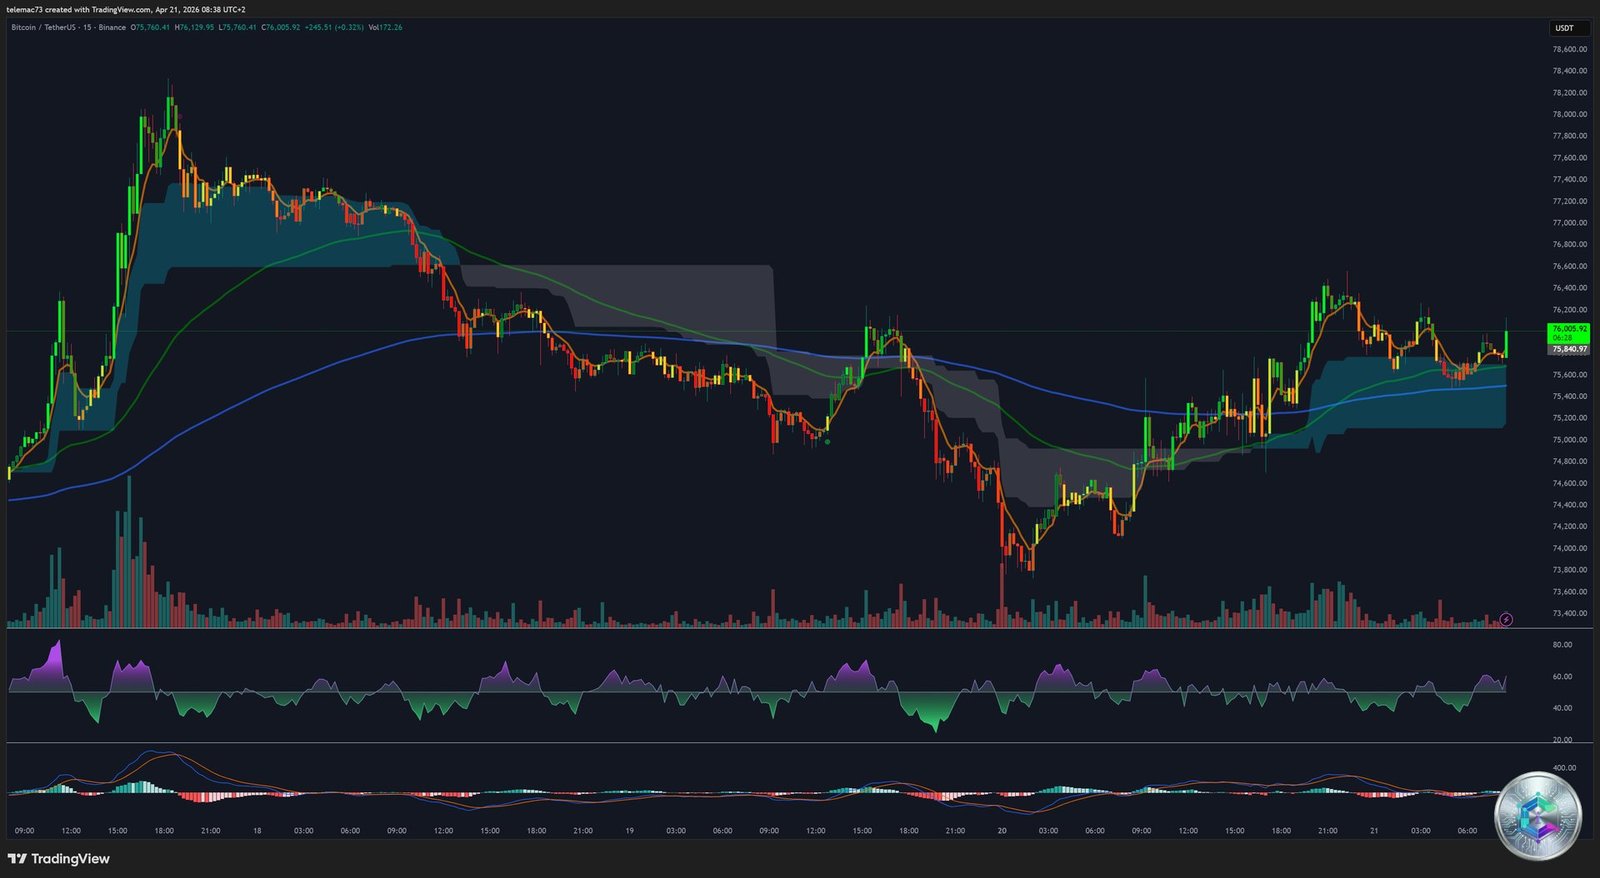
⚡ 15-Minute Chart (15M) — Microstructure & Execution
The 15M chart covers the April 17–21 session. After a peak near ~$78,200 (April 19), price corrected to ~$73,100 (April 20 morning) before recovering toward $76,000 in the current session. Price has reclaimed the Kumo (teal cloud) — a bullish entry signal on this timeframe.
A potential « Cup and Handle » pattern is forming: the cup corresponds to the $73,100 trough, and the handle to the current consolidation ~$75,400–$76,000. A break above $76,200 would confirm this pattern with a target toward $78,000–$78,500. The WaveTrend oscillator is emerging from its low zone — a short-term bullish impulse signal in progress.
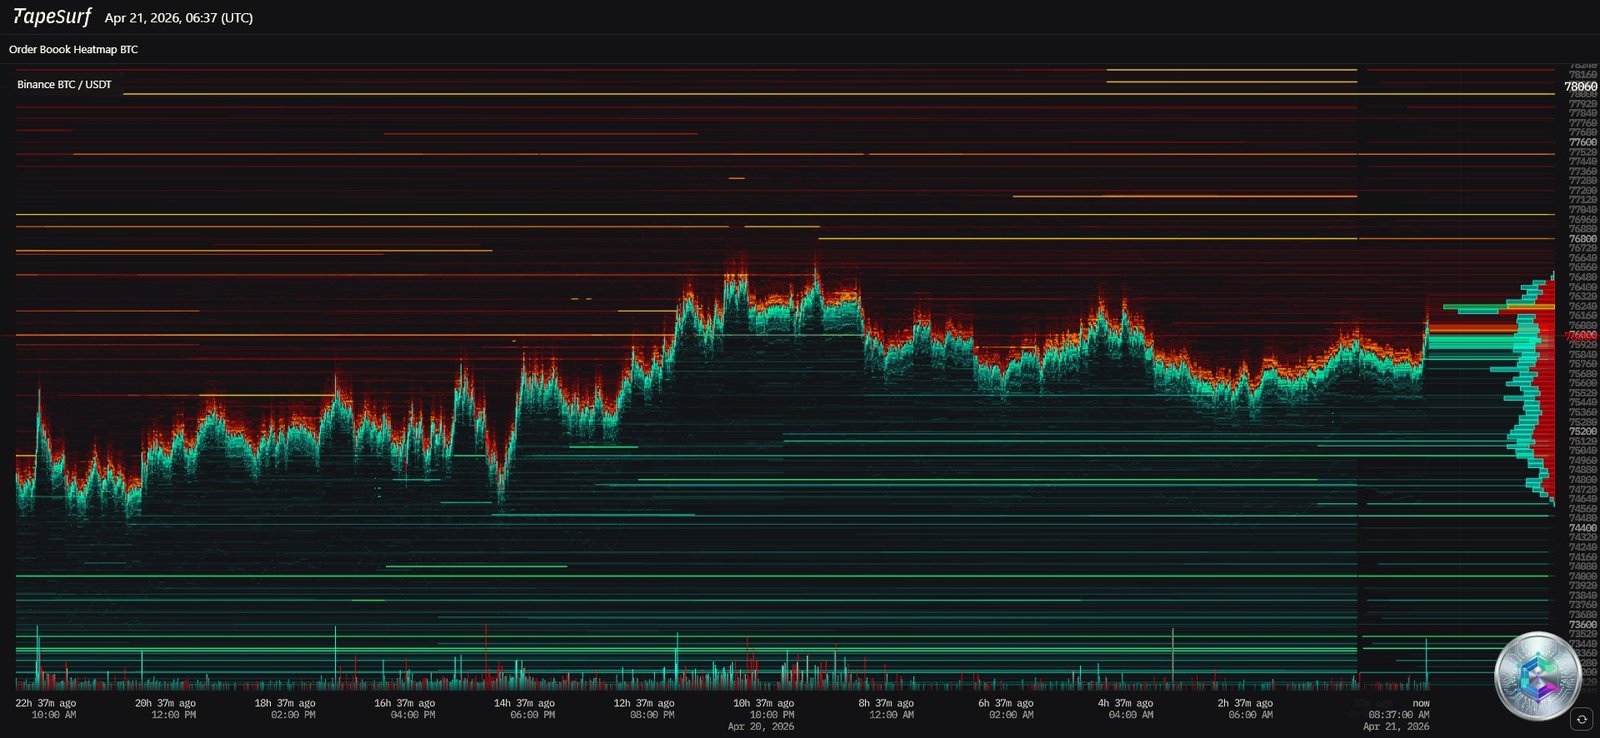
🔥 Heatmap Analysis — TapeSurf Order Book
The TapeSurf heatmap (06:37 UTC, Binance BTC/USDT) reveals the liquidity structure over the past 22 hours. Yellow/orange lines represent sell walls (resistance), while green/cyan lines indicate bid walls (support).
| Level | Type | Strength | Significance |
|---|---|---|---|
| $78,060 | Resistance (Sell Wall) | ⭐⭐⭐⭐⭐ | Major sell wall |
| $77,440–$77,600 | Resistance | ⭐⭐⭐⭐ | Historical sell liquidity cluster |
| $76,800 | Resistance | ⭐⭐⭐ | Former equilibrium zone |
| $76,000 | Neutral Pivot | ⭐⭐⭐⭐ | Current price zone — buyer/seller battle |
| $75,200 | Support | ⭐⭐⭐⭐ | Bid wall (thick green) |
| $74,400–$74,500 | Strong Support | ⭐⭐⭐⭐⭐ | Major bid wall — session trough |
| $73,600–$73,200 | Support | ⭐⭐⭐ | Structural bid zone |
The session’s Point of Control (POC) lies between $75,200 and $76,000, confirmed by volume profiles. Price is oscillating between two major liquidity concentrations: a sell wall above $78,000 and a demand wall at $74,400–$75,200.
📍 Key Support and Resistance Levels
Resistances
| Level | Importance | Source |
|---|---|---|
| ~$76,200–$76,500 | 🟡 Short-term | Intraday control point |
| ~$78,000–$78,200 | 🔴 Strong | Heatmap + April 19 high |
| ~$80,000–$84,000 | 🔴 Major | Daily Kumo lower edge + Bullish Flag target |
| ~$100,000 | 🔴 Structural | Sell Power 68 — institutional resistance |
Supports
| Level | Importance | Source |
|---|---|---|
| ~$75,200 | 🟢 Immediate | Heatmap bid wall + 15M Kumo |
| ~$74,400–$74,500 | 🟢 Strong | Heatmap + April 20 session low |
| ~$72,000 | 🟢 Structural | 50-day EMA — confirmed support |
| ~$70,000 | 🔵 Psychological | Major round level + institutional support |
| ~$65,000 | 🔵 Major | 2026 cycle low + Buy Power |
Daily Pivot Levels
Pivot Point: ~$75,500 | R1: ~$77,000 | R2: ~$78,500 | S1: ~$74,000 | S2: ~$72,500
🌍 Macro & Fundamental Context
✅ Bullish Catalysts
- Record institutional ETF flows: $471M net inflows in a single day (April 6), including $182M via BlackRock IBIT and $147M via Fidelity FBTC. Q1 2026 total: $18.7 billion in crypto ETF inflows.
- BlackRock accumulation: $284M into IBIT on April 17 alone — confirmation of sustained institutional demand.
- Geopolitical resilience: Despite US-Iran tensions, Bitcoin refuses to collapse — a sign of solid structural demand.
- CLARITY Act: Under Senate consideration for markup in late April 2026 — could open the door to sovereign wealth funds and pension plans.
- Weakening USD: Dollar pressure amid the trade war context favors alternative assets including Bitcoin.
⚠️ Bearish Risks & Headwinds
- Tariffs: The 10% blanket tariff (Section 122) keeps inflation elevated and delays Fed rate cuts.
- Fed transition: Jerome Powell’s mandate expires in May 2026. Kevin Warsh awaits Senate confirmation — notable institutional uncertainty.
- MA 200 as distant resistance: $87,000–$90,000 remains a major technical wall to overcome.
- Gold vs Bitcoin: Gold ETFs have captured $44.4B net this year vs $23.6B for Bitcoin — gold remains the preferred safe-haven for traditional investors.
- Death Cross MA 50/200: Still active on the daily — long-term bearish structure not yet reversed.
🎯 Trading Scenarios
🟢 Primary Bullish Scenario — Probability: ~55–60%
Trigger: 4H close above $76,500 with increasing volume.
- Target 1: $78,000–$78,200 (heatmap resistance + local high)
- Target 2: $80,000 (major psychological resistance)
- Target 3: $84,000–$88,000 (daily Kumo + Bullish Flag target)
- Stop Loss: Below $74,000 (break of 4H structural support)
Rationale: 4H Bullish Flag + Ichimoku Triple Bull + robust institutional ETF inflows + resilience against negative catalysts.
🔴 Alternative Bearish Scenario — Probability: ~30–35%
Trigger: Daily close below $74,000 with high sell volume.
- Target 1: $72,000 (50-day EMA + structural support)
- Target 2: $70,000 (major psychological support)
- Target 3: $67,000–$65,000 (2026 cycle lows)
- Stop Loss: Above $76,500 for short positions
Rationale: Death Cross MA 50/200 still active, daily MACD not yet confirmed bullish, daily Kumo resistance, macro headwinds (tariffs, Fed).
🟡 Consolidation Scenario — Probability: ~10–15%
Range $73,500–$77,500 for the coming week, pending a catalyst — notably the CLARITY Act Senate markup. Polymarket assigned a 55% probability to the $74,000–$76,000 range and 36% to $76,000–$78,000 for BTC price on April 21, closely mirroring the observed technical structure.
📊 Technical Summary Table
| Pattern | Timeframe | Status | Target |
|---|---|---|---|
| Bullish Flag | 4H | In progress (unconfirmed) | $88,000–$90,000 |
| Cup & Handle | 15M | Forming | $78,000–$78,500 |
| W-Bottom (Double Bottom) | Daily | Potentially formed | $84,000–$88,000 |
| Compression Triangle | 4H/15M | Forming | Imminent directional break |
| Ichimoku Triple Bull | 4H | Active | Bullish continuation |
Conclusion
Bitcoin stands at a critical technical crossroads on April 21, 2026. The short-term structure (15M, 4H) is clearly bullish, supported by solid institutional ETF inflows and remarkable resilience against macroeconomic headwinds. However, the long-term structure remains bearish: active Death Cross on the daily, price below the MA 200, and the daily Kumo acting as overhead resistance.
The decisive pivot sits at $76,500–$77,000: a 4H close above this level opens the path to $80,000–$88,000, while a rejection below $74,000 would call the recovery into question and expose $72,000 then $70,000.
Immediate watch zone: $75,200 (support) / $76,500 (resistance) / $78,060 (heatmap wall).
⚠️ Disclaimer: This article is written for educational and informational purposes only. It does not constitute investment advice, a recommendation to buy or sell, or financial advice of any kind. Cryptocurrency markets are highly volatile and carry significant risk of capital loss. Any investment decision should be made in accordance with your personal financial situation and, where appropriate, after consulting a licensed financial advisor.