
📅 Analysis Date: April 20, 2026 | 💰 Current Price: $74,353.21 USDT
Bitcoin’s ecosystem is experiencing a period of historic volatility and major structural redefinition in April 2026. This report delivers a comprehensive, multidimensional dissection of BTC/USDT price action, integrating global macroeconomic catalysts, multi-timeframe technical analysis (daily, 4-hour, and 15-minute charts), quantitative oscillators (RSI, MACD, Moving Averages), and micro-structural liquidity mapping via order book heatmaps.
⚡ Macroeconomic Context: The Strait of Hormuz Shock
Bitcoin’s recent trajectory cannot be understood without a rigorous analysis of the macroeconomic landscape dominating April 2026. The quarter’s defining geopolitical crisis was the escalation of tensions in the Persian Gulf, culminating in a U.S. naval blockade of the Strait of Hormuz following the collapse of diplomatic negotiations in Islamabad. This strategic chokepoint — through which approximately 20% of global oil supply transits — triggered an immediate supply shock, propelling WTI crude and Brent oil prices beyond $103–$104 per barrel.
This energy price surge rekindled fears of imported inflation, effectively forcing the Federal Reserve to indefinitely defer its anticipated monetary easing policies. In response, systemic risk aversion dominated: over $260 million in leveraged long positions were liquidated within 24 hours, pushing Bitcoin toward a temporary support floor around $74,000.
The « Peace Pivot »: Markets’ Paradoxical Resilience
However, financial markets quickly began pricing in a resolution. A ceasefire negotiated between the United States and Iran, leading to the conditional reopening of the Strait of Hormuz, acted as a powerful bullish detonator. Simultaneously, Goldman Sachs’ pivot on AI-driven technology stocks — characterizing the recent software selloff as « a disproportionate overreaction » — triggered a massive rally across the Nasdaq and S&P 500, which Bitcoin correlated with closely.
The mechanics of short squeezes amplified the move dramatically: approximately $6 billion in short positions had dangerously concentrated in the $72,200–$73,500 zone during the initial panic. Their forced unwinding propelled Bitcoin to recent highs above $78,000, before natural profit-taking pulled it back into its current consolidation range.
🏦 Institutional Fundamentals: The ETF vs. Corporate Treasury Dichotomy
The current market is defined by a fascinating dichotomy between short-term derivatives speculation and methodical institutional accumulation. Asset managers and corporate entities now hold over 1.5 million Bitcoins, deploying the asset as an asymmetric hedge against fiat currency devaluation amplified by sovereign deficits and systemic geopolitical tensions.
The case of Capital B (The Blockchain Group) is particularly telling: having recently acquired 12 additional BTC for €0.8 million — bringing its total holdings to 2,937 BTC at an average acquisition price of $91,975 per Bitcoin — this publicly listed institution is accumulating well above the current market price. This signals that institutions view the current price range as a window of temporary undervaluation relative to their long-term fair value estimates.
On the other side of the ledger, U.S. spot ETFs have introduced a cohort of « weak hands » reacting emotionally to macroeconomic headlines. Notable capital outflows have been recorded, with BlackRock’s fund posting liquidations exceeding $249 million during specific April 2026 sessions. This passive selling pressure counteracts active corporate accumulation, creating the friction zone currently trapping price.
📊 Daily Chart Analysis (1D): Squeezed Between MA200 and MA50
The daily chart is the cornerstone of any professional analysis, filtering speculative noise to reveal the market’s true gravitational forces. The picture it paints is of an asset in post-capitulation reconstruction. From an absolute nadir around $60,000 — a zone of massive institutional accumulation identified by a « Buy Power: 61 » block — Bitcoin has printed an unbroken sequence of higher lows, signaling a firm recovery by buyers.
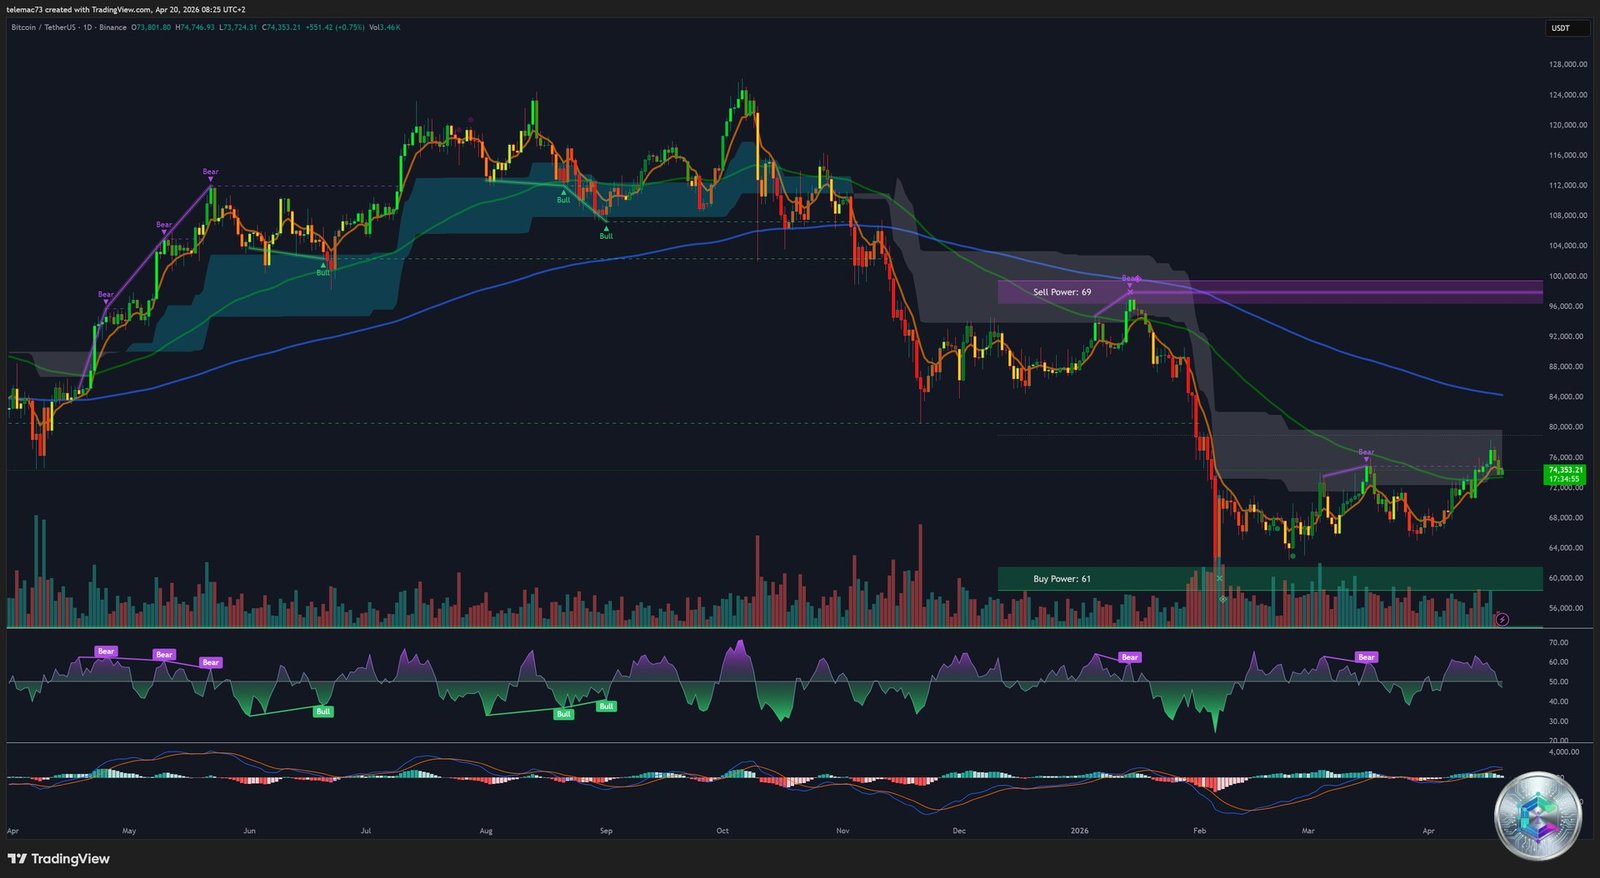
The current configuration is surgically precise. Key moving average dynamics are decisive:
- MA200 at $73,631 — The absolute arbiter between bull and bear markets. Price is bouncing precisely off this level; preserving it on a daily close validates the ongoing bull market structure.
- MA50 at $75,884 — An immediate glass ceiling acting as short-term dynamic resistance. Bitcoin is compressed in an extraordinarily tight range between these two averages.
- 14-day RSI: 28.557 — Formally in oversold territory (<30). A hidden bullish divergence: price holds at relatively elevated levels while momentum has been completely purged. A violent technical rebound is statistically very probable.
- Daily MACD — Histogram bars are shortening, potentially preparing a bullish Golden Cross crossover in the coming weeks.
- Macro Resistance ($96,000–$100,000) — A « Sell Power: 69 » block representing the cycle’s glass ceiling, where massive institutional take-profit orders await.
⏱️ 4-Hour Chart Analysis (4H): Compression Triangle and Tactical Indecision
The 4H chart provides the tactical view of the current moment, isolating the sequential moves of market participants. Recent price action was dominated by a violent rejection from the $78,000 level (« Sell Power: 65 » block), representing the post-geopolitical-crisis relief peak. This retracement found support around $65,000, where a « Buy Power: 65 » block formally absorbed the selling pressure.
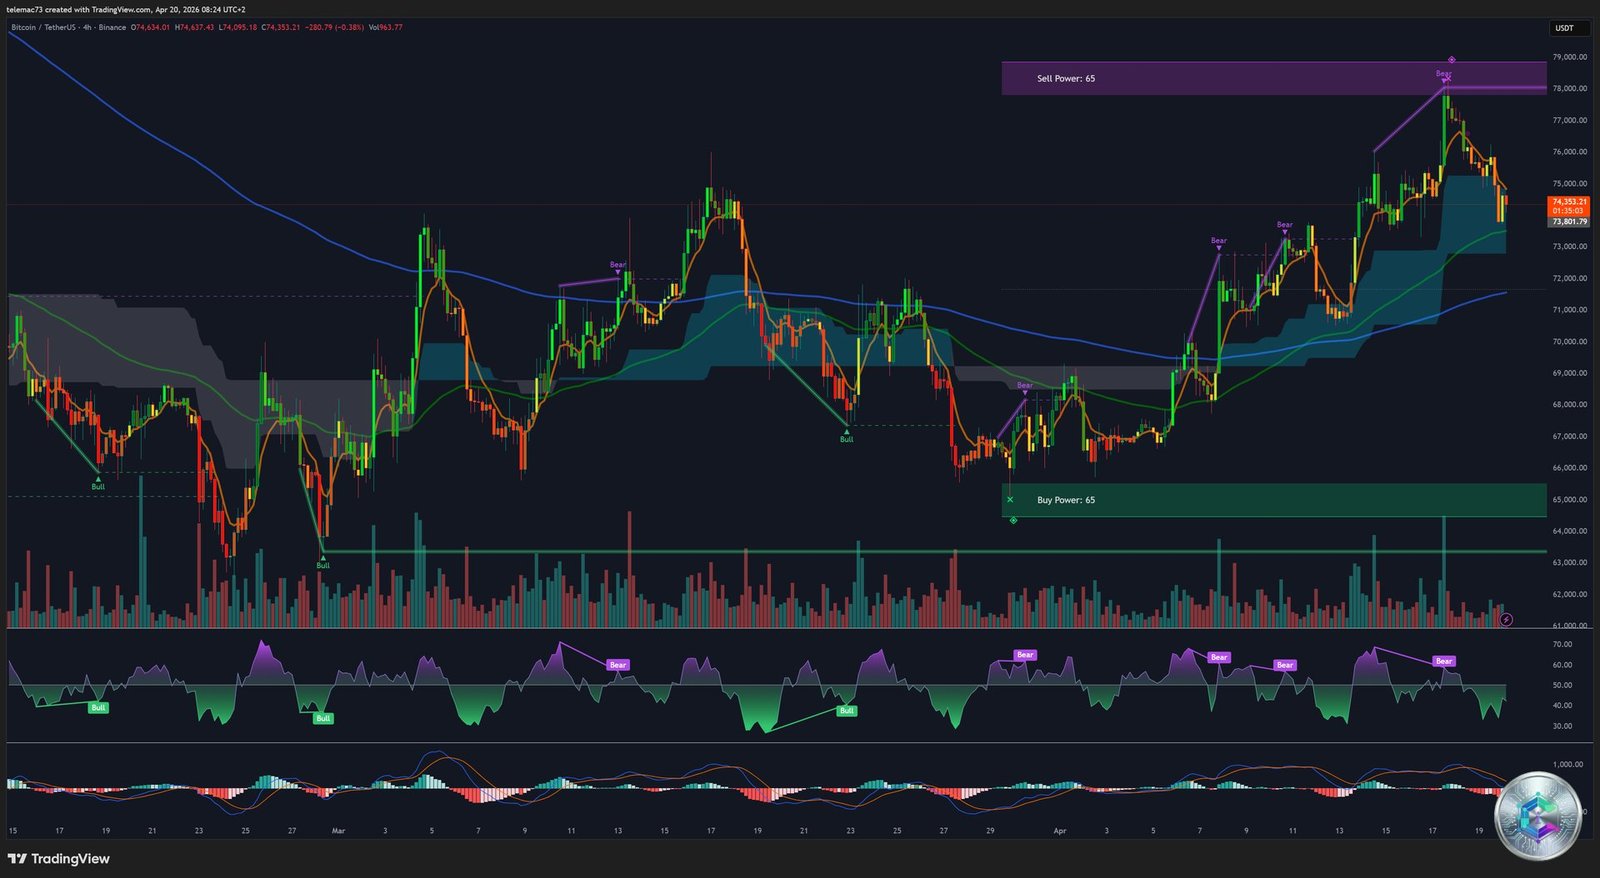
The dominant chart pattern is a symmetrical compression triangle (pennant): lower highs from the $78,000 peak combined with higher lows since the $65,000 bottom. This volatility compression invariably precedes an explosive directional expansion — the longer the spring is compressed, the more violent the eventual breakout. Given the underlying macro-bullish backdrop, the probability of an upside resolution remains statistically favored.
Indicators confirm the prevailing indecision: the 4H RSI hovers around 50 (perfect neutrality, maximum available amplitude in either direction), while the 4H MACD shows intertwined signal lines near zero. Flattened, braided moving averages are the textbook signature of an accumulation/distribution phase preceding an imminent directional decision.
🔬 15-Minute Microstructure (15m): The Silence Before the Storm
Descending to the 15-minute chart means plunging into the visceral reality of market microstructure — the arena where high-frequency algorithms, market makers, and intraday speculators collide. Price is frozen at $74,353.21 with a microscopic intraday change of +0.07%. Price action is « choppy » — erratic and disjointed. Japanese candlesticks overlap with long upper and lower wicks, illustrating fierce battles for micro-level control with neither side establishing sustained directional momentum.
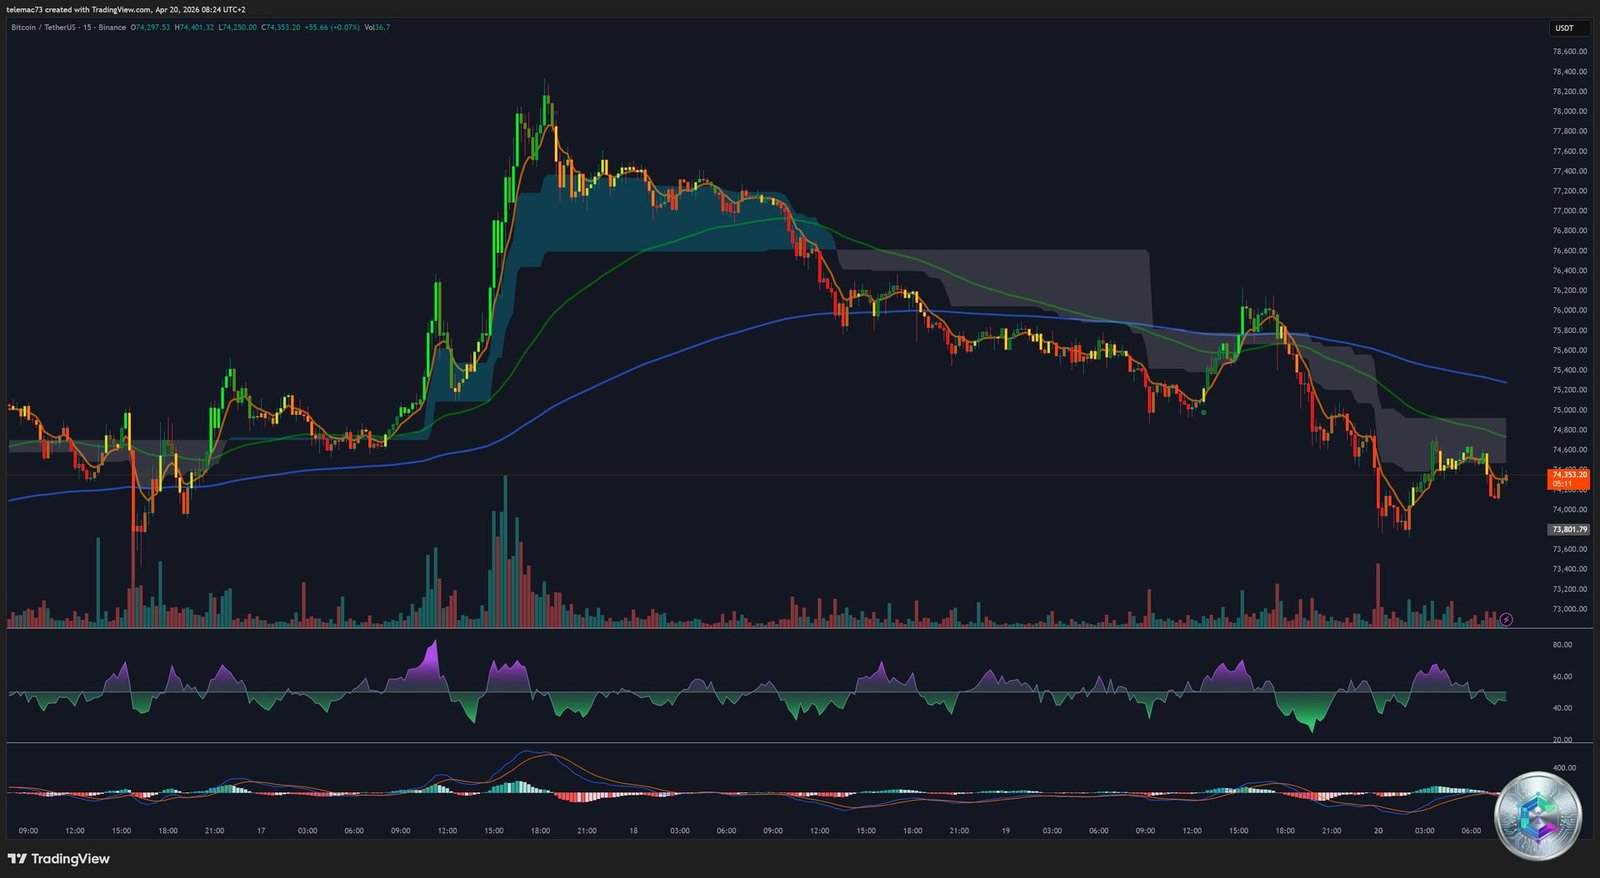
The moving average cloud is completely flattened — price oscillates through it in both directions without conviction. Oscillators corroborate this lethargy: the 15m RSI moves strictly between 40 and 60, avoiding any extreme zone. The MACD histogram barely grazes zero with tiny bars alternating between pale red and pale green. Trading volume has dried up considerably from the peaks registered during the initial liquidation wave — a classic sign that institutions have completed their primary allocations and are allowing the retail market to exhaust itself within a tight range, awaiting the next fundamental catalyst.
A potential intraday Bear Flag is identifiable on this timeframe: a break of the local support at $73,800 would target the lower liquidity pool, while a breach of the range ceiling at $75,000 would invalidate this bearish structure and force a cover of algorithmic short positions.
🗺️ Liquidity Heatmap: The Invisible Vise of the Order Book
The Binance order book heatmap (TapeSurf terminal) represents the apex of this analysis, rendering the market’s invisible gravitational forces visible. In modern markets, price action is not a random walk — it is mathematically attracted to zones of high liquidity. Institutional algorithms must route price toward these liquidity pools to execute massive orders without incurring prohibitive slippage.
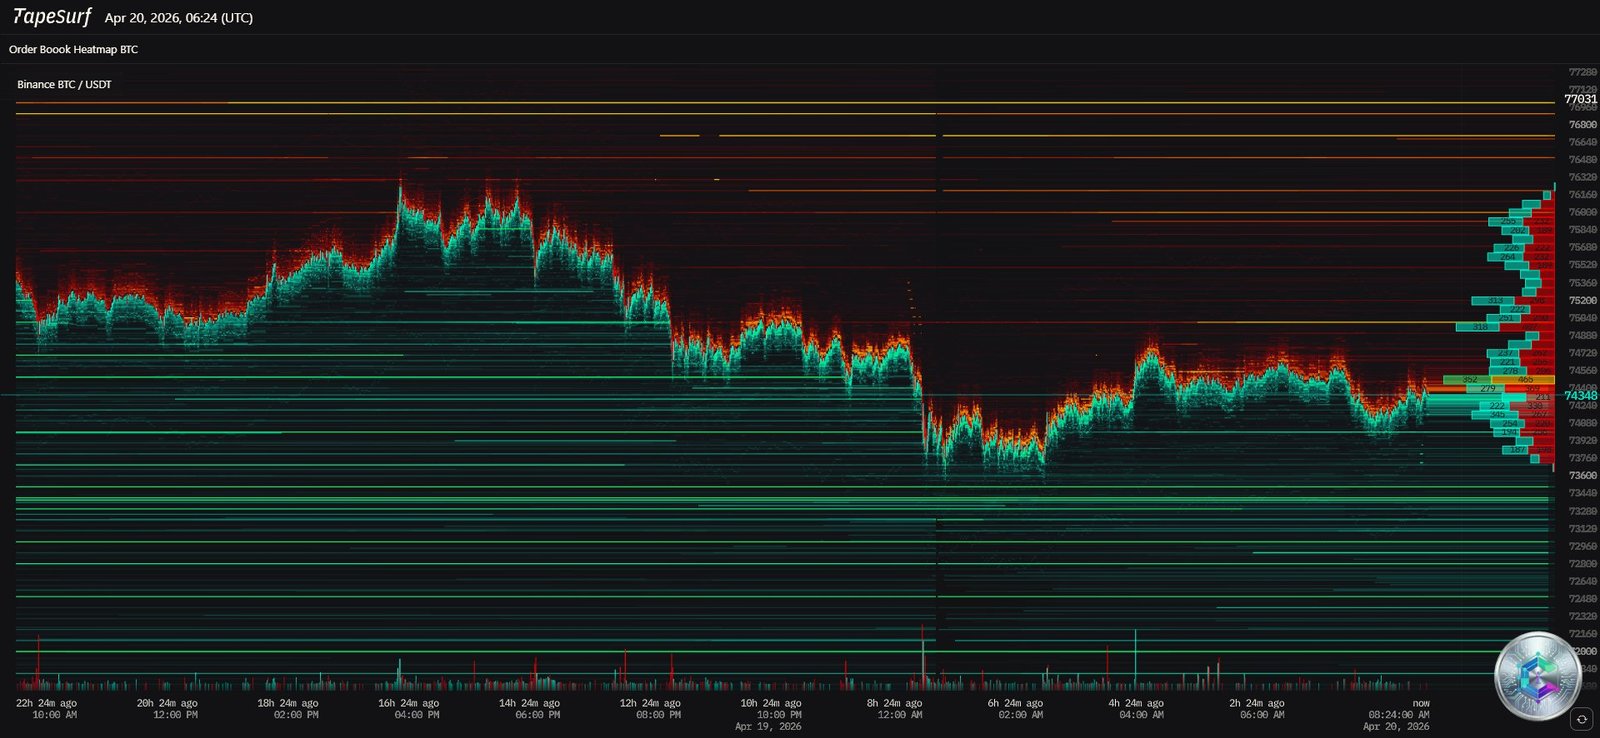
🔴 Above current price ($75,000 → $77,000+): A dense stratification of bright red and orange lines represents a massive glass ceiling of limit sell orders. This cluster is driven by profit-taking from buyers who entered near the $60,000 bottom, combined with algorithmic short entry orders. For Bitcoin to break out to the upside, colossal market buying power must absorb and « consume » hundreds of millions of dollars in passive orders.
🟢 Below current price ($73,500 → $72,000): Thick layers of green lines represent institutional limit buy orders forming a passive safety net. These actors are not aggressively buying — they are deploying their nets patiently, waiting for short-term volatility to trigger their orders at optimal prices.
The « spoofing » phenomenon is also observable — order walls appearing and disappearing suddenly, an algorithmic tactic to manufacture sentiment and push price in a target direction. However, the persistent density above $76,000 appears to be a genuine distribution barrier rather than spoofing.
📋 Key Technical Levels — Consolidated Reference
| Level Type | Price (USDT) | Significance |
|---|---|---|
| Macro Resistance (R3) | $96,000 — $100,000 | Cycle ceiling. « Sell Power 69 » block. Breakthrough = price discovery & institutional FOMO. |
| Intermediate Resistance (R2) | $78,400 | « Peace Pivot » swing high. « Sell Power 65 » block. Major 4H rejection level. |
| Immediate Resistance (R1) | $75,884 — $76,000 | Confluence of MA50 + Heatmap sell walls. Critical short-term obstacle. |
| Central Pivot | $74,636 | Current price ($74,353) slightly below → slightly bearish intraday bias. |
| Immediate Support (S1) | $73,631 — $73,500 | Confluence of daily MA200 + Heatmap buy wall. Critical defense zone. |
| Intermediate Support (S2) | $65,000 | 4H correction low. « Buy Power 65 » block. Tactical buy-the-dip level. |
| Macro Support (S3) | $56,000 — $60,000 | Institutional accumulation zone. Loss = full invalidation of secular bull thesis. |
🎯 Probabilistic Scenarios for Upcoming Sessions
🟢 Bullish Scenario — The Structural Breakout (Primary)
Favored by the underlying trend and macroeconomic parameters (geopolitical détente, tech equity recovery, potentially accommodative monetary policy), this scenario hinges on a volumetric breakout above the MA50 at $75,884. A confirmed daily close above $76,000 would ignite a FOMO effect and trigger cascading algorithmic short covering. The sequential price targets would be $78,400 (the Peace Pivot swing high), followed by $93,000–$96,000 as the macro end-of-quarter target.
🔴 Bearish Scenario — The Deferred Capitulation
Should the MA200 ($73,631) and the $73,500 liquidity net fail under the weight of hidden institutional distribution, short-term traders’ stop-loss orders would trigger rapid price slippage through a low-liquidity « air pocket » toward the intermediate support at $65,000. A resurgence of macroeconomic fears (a new energy shock or collapse of the Peace Pivot narrative) could transform this technical pullback into a brutal liquidation targeting the ultimate macro defense at $60,000 — a level whose loss would inaugurate a prolonged bear market.
🟡 Neutral Scenario — The Sideways Volatility Grind
A perfect equilibrium of forces — systematic treasury buying vs. ETF profit-taking — could keep Bitcoin trapped within the tight corridor of $72,000–$76,000 for several weeks. This « chop » phase would purge implied volatility from options markets, discourage speculative capital, and allow long-term moving averages to converge with price (mean reversion in time). While unpopular, this scenario would forge a concrete floor capable of supporting the next major bullish impulse toward all-time highs.
✅ Analytical Conclusion
Bitcoin on April 20, 2026 sits at the exact confluence of titanic forces. Its resilience through the Strait of Hormuz oil shock and its rapid rehabilitation alongside equity markets demonstrate undeniable institutional maturity. The macro-bullish structure, forged from the $60,000 low, remains structurally intact despite sustained selling pressure.
From a quantitative standpoint, the asset oscillates at $74,353, compressed within the microscopic gap separating its long-term support (MA200 at $73,631) from its short-term dynamic resistance (MA50 at $75,884). The deeply oversold daily RSI (28.5) — contrasting sharply with the neutrality of lower timeframes — signals that the spring is coiled to an extreme. The heatmap corroborates this tension, illustrating a barricade of sell orders ready to smother enthusiasm, balanced by an unyielding buyer liquidity net. The outcome of this millimeter-precision confrontation — determined by whether or not the vital pivot levels identified in this report are breached — will not merely set the direction for the week ahead, but will dictate Bitcoin’s structural trajectory for the entirety of the current financial cycle.
⚠️ Important Disclaimer: This article is written for educational and informational purposes only. It does not constitute financial, investment, or purchase advice of any kind. Cryptocurrency markets are highly volatile and carry significant risk of capital loss. Past performance is not indicative of future results. Any investment decision is entirely your own responsibility and should be made in consultation with a licensed financial advisor.