
In April 2026, Bitcoin (BTC) is trading in the critical technical zone of $77,100–$77,500, marking a spectacular recovery from the annual lows of $60,057 recorded in February. While the asset remains more than 38% below its all-time high of $126,272 (October 2025), the multi-timeframe technical configuration and massive institutional inflows are painting the formation of a macro floor of rare historical robustness.
Macroeconomic Context: The Strait of Hormuz Crisis and the Risk-On Pivot
The global economy has recently weathered intense inflationary pressures driven by the Iran-Israel conflict. The closure of the Strait of Hormuz for seven weeks sent Brent and WTI crude prices surging to alarming highs, propelling the US Consumer Price Index from 2.4% to 3.3% in March 2026. The Federal Reserve maintained a restrictive monetary stance, weighing on risk assets and triggering a rotation toward cash and defensive positions.
The reversal was swift and decisive. The announcement of a 10-day ceasefire and the full reopening of the Strait of Hormuz by Iranian Foreign Minister Abbas Araghchi — amplified by President Trump on social media — triggered a sweeping global risk-on move. The S&P 500 erased its 8% losses since the conflict began to close at a new all-time high. The VIX collapsed. Bitcoin, pushed above $77,000, captured this rotation disproportionately — confirming its role as a global liquidity barometer.
Institutional Architecture: Spot ETFs, MicroStrategy and Legislative Integration
The underlying momentum is driven by unprecedented structural institutional flows:
- Bitcoin Spot ETFs: Regulated crypto investment products attracted $1.1 billion in a single week in April, ending five consecutive weeks of outflows that had drained nearly $4 billion from the market. US investors accounted for 95% of these flows. Morgan Stanley’s MSBT ETF captured over $103 million in its first six trading days; BlackRock’s IBIT recorded daily inflows peaking at $291.9 million. Cumulatively, the 13 US Bitcoin ETFs now total $57.1 billion in net inflows and $97.6 billion in AUM — equivalent to capturing 6.5% of Bitcoin’s total market capitalization.
- MicroStrategy: Michael Saylor’s firm holds 720,737 BTC — 3.4% of maximum supply — valued at over $47 billion (average acquisition price: $75,985). Its « 42/42 Plan » targets raising $84 billion by 2027, creating relentless structural buying pressure on the open market.
- Legislative integration: Representative Sheri Biggs (South Carolina) disclosed an investment of up to $250,000 via BlackRock’s IBIT. In Washington, the debate over a « Federal Bitcoin Reserve » as a strategic national security asset is gaining momentum amid growing de-dollarization concerns.
Technical Analysis — Daily Chart: The MACD Golden Cross
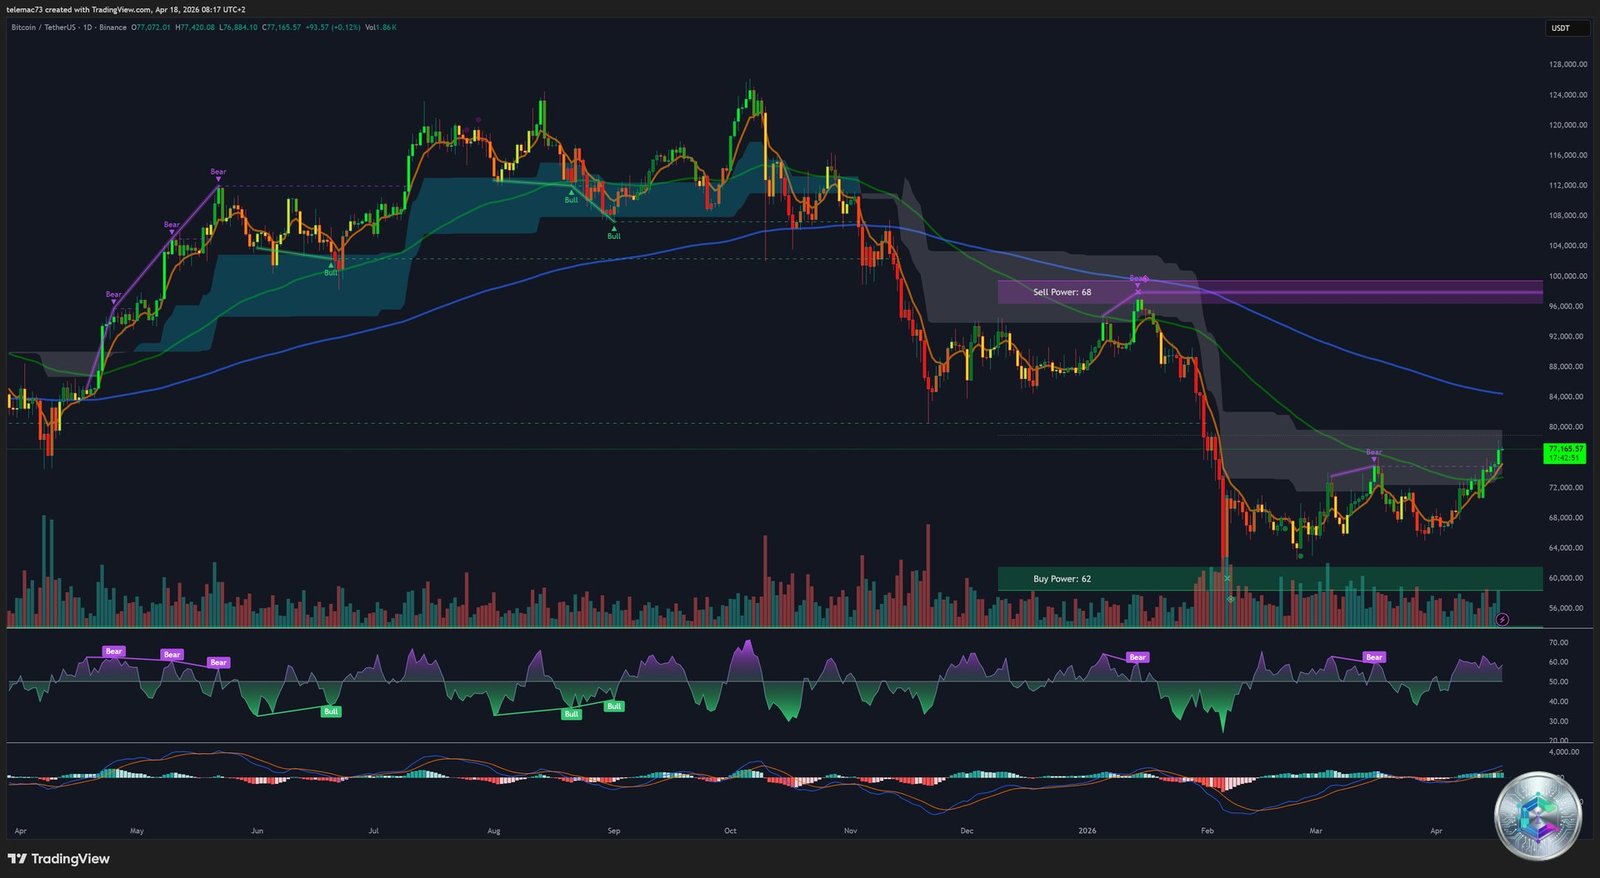
The daily chart reveals the global architecture of the current cycle. After a distribution phase that peaked above $120,000, the market endured a severe purge toward the $60,000 zone (institutional marker « Buy Power: 62 »). The subsequent recovery takes the characteristic V-shape, confirming Tom Lee’s (Fundstrat) historical projections.
Key daily technical signals:
- Moving averages: Clean breakout above the central EMA — candles now closing consistently above the curve, signaling a polarity reversal from distribution to aggressive re-accumulation.
- RSI: Bounce from oversold territory (below 30) to a healthy bullish zone, with confirming positive hidden divergences.
- MACD — Golden Cross: Critical signal. Deep bullish crossover below the zero line, histogram transitioning from deep red bars to expanding green bars — long-term buying momentum fully restored.
- « Sell Power 68 » resistance: Major historical liquidity zone near former highs — the natural destination of the current move.
Technical Analysis — 4-Hour Chart: Bull Flag and the $79,500 Wall
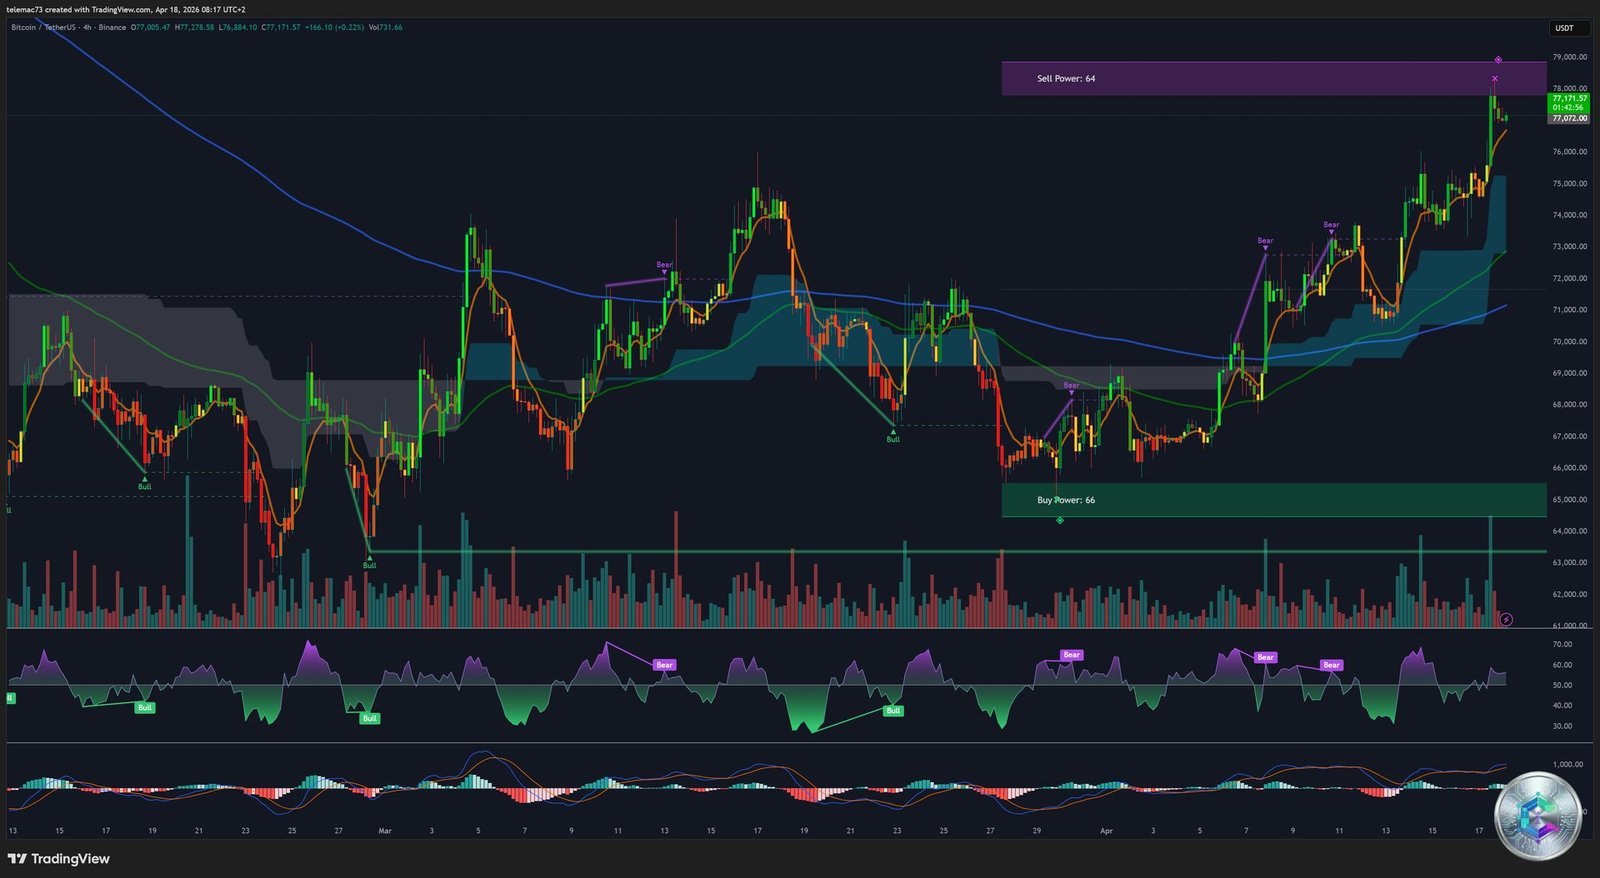
The H4 chart provides a microscope on the post-Ormuz impulse. Following a violent green impulsive candle (the flagpole), the asset is consolidating in a slightly declining lateral channel — a textbook Bull Flag pattern, indicating calm absorption of short-term profit taking without surrendering significant ground.
- Buy Power 66 ($64,000–$65,000): Institutional launchpad that triggered the current impulse.
- Sell Power 64 ($78,500–$79,500): Critical intra-week barrier — thick algorithmic block to absorb before extending higher.
- H4 RSI in overbought territory: « Bear » divergence labels appearing — lateral cooling consolidation needed before the next assault attempt.
- H4 MACD: Extremely wide separation, peaking green histogram — total buyer dominance at short-term timeframes.
Technical Analysis — 15-Minute Chart: Intraday Compression Triangle
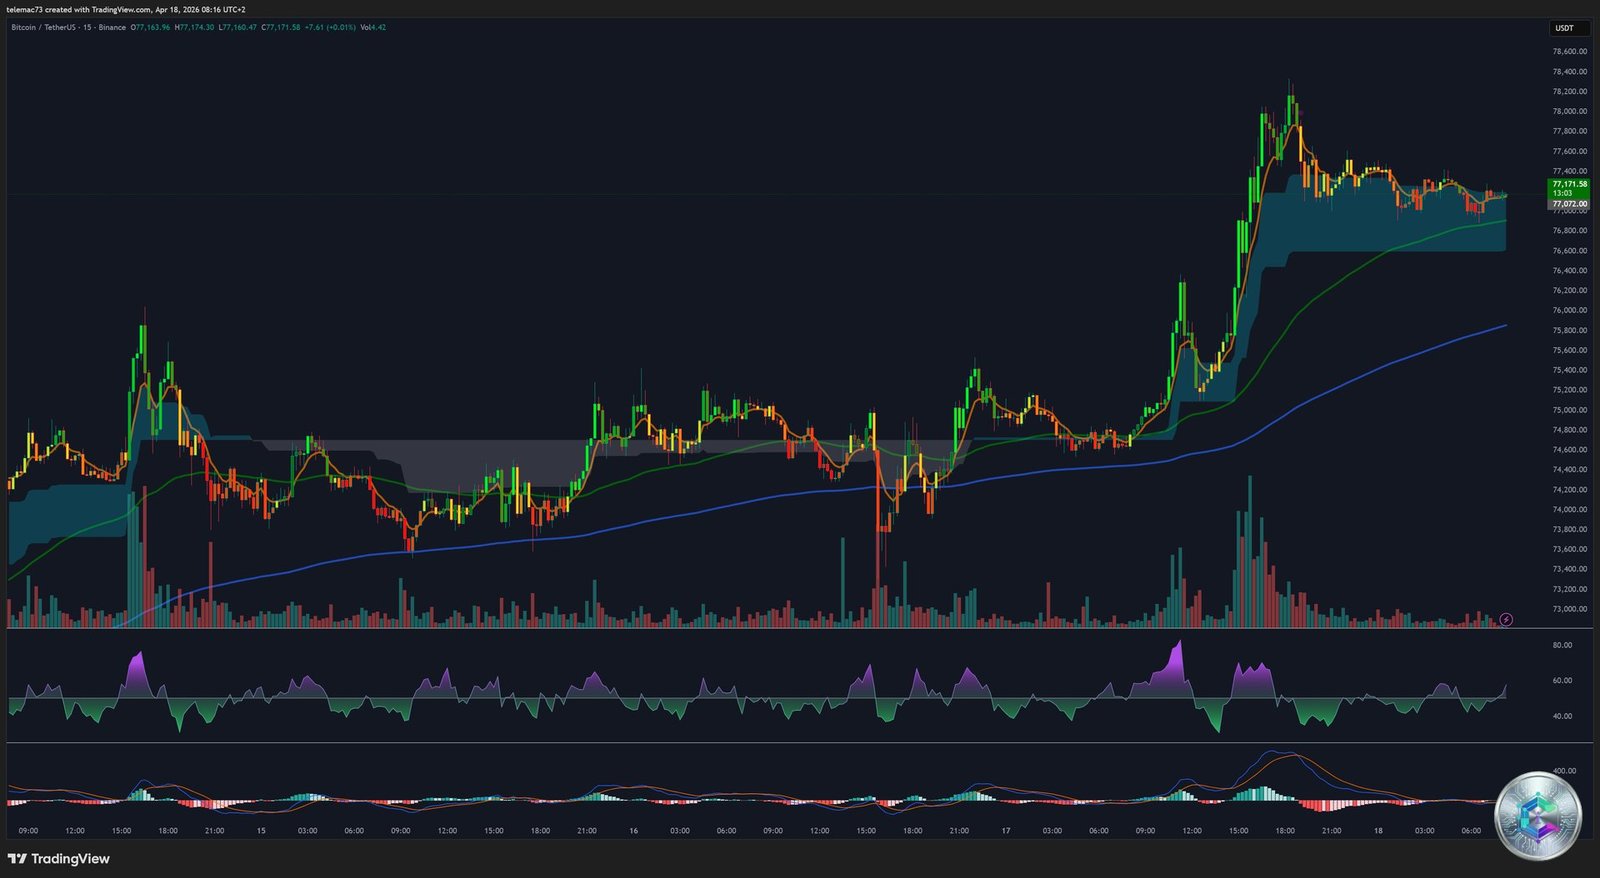
At the microscopic level, volatility has contracted sharply post-rally. The price profile forms a Compression Triangle (Pennant) with increasingly tighter highs and lows around the $77,171 pivot. The 15m MACD shows a minor bearish crossover (Death Cross) above zero — not a reversal signal, but the natural velocity tapering typical of lateral accumulation phases. Bearish breakdown attempts within the triangle are systematically absorbed by green volume spikes: « buy the dip » algorithms are defending the $77,000 threshold aggressively.
Liquidity Heatmap: The $83,000 Magnet
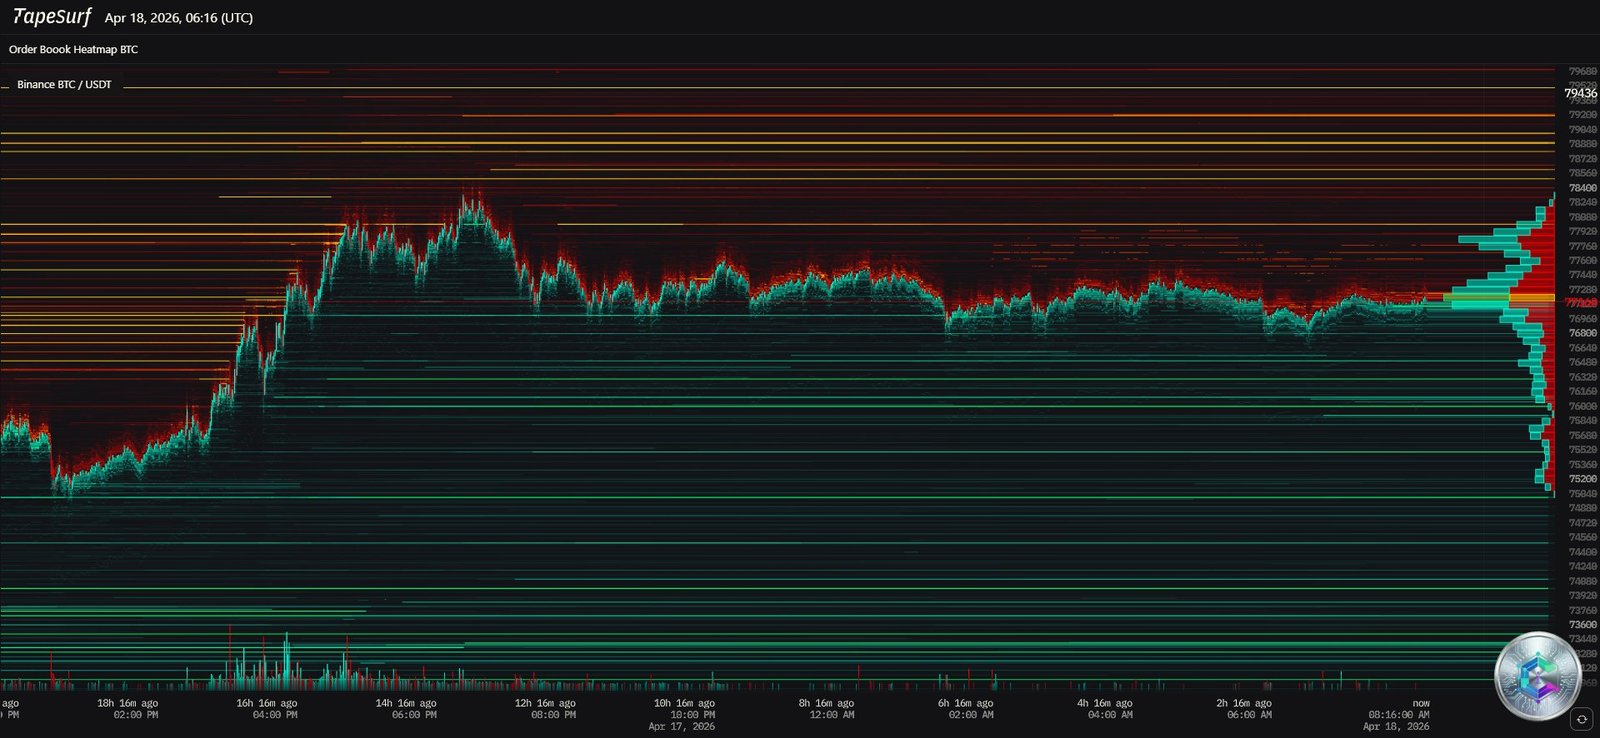
The Binance BTC/USDT order book heatmap reveals a striking asymmetry between selling pressure and buying support:
- Immediate ask wall ($77,500–$79,500): Extreme density of warm-colored horizontal layers (yellow, orange, red). This wall aligns perfectly with the H4 « Sell Power 64 » block. The asset must deploy massive institutional buying volume to « consume » this latent supply.
- Liquidation magnet at $83,000: A glowing cluster identified on 12-month leveraged liquidation heatmaps (CoinGlass) — the convergence zone of stop-losses and forced liquidation levels for shorts opened during the past 46 days of negative funding rates. If $79,500 breaks, a magnetic suction effect will mechanically draw price toward $83,000 to trigger the liquidation cascade.
- Fragile immediate support: Bid orders below current price are sparse. In the event of a flash crash, price could slide rapidly to $75,000, potentially $70,600, with little friction.
The Derivatives Powder Keg: 46 Days of Negative Funding Rates
The most explosive anomaly in the current market lies in the derivatives space. Negative funding rates persisting for over 46 consecutive days on perpetual futures contracts represent one of the most prolonged bearish anchoring periods in Bitcoin’s history — comparable only to the post-FTX collapse sequence of November-December 2022.
This positioning implies that short sellers are paying a recurring premium to long holders simply to maintain their bearish bets against a rising spot price. Vetle Lunde (K33 Research) describes this configuration as « optimal conditions for a short squeeze. » The mechanics are relentless: ETF inflows + MicroStrategy accumulation push spot higher → shorts accumulate mounting losses → automatic margin calls trigger → each forced liquidation generates a market buy order → chain reaction capable of driving price thousands of dollars higher within minutes.
Key Level Architecture
| Price Zone (USD) | Category | Significance |
|---|---|---|
| $83,000 – $84,000 | 🔴 Extreme Resistance | Short squeeze final target — liquidation magnet for trapped shorts (46 days) |
| $78,500 – $79,500 | 🔴 Ask Wall (Sell Power 64) | Algorithmic block H4 + Heatmap — decisive critical lock |
| $78,337 | 🟠 Intraday Resistance | Post-Ormuz impulse high — potential double top if not broken |
| $77,171 | 🟡 Local Pivot | 15m Pennant center — oscillator cooling zone |
| $74,000 – $75,000 | 🟢 Proximal Support | Resistance-to-support flip — buyer liquidity pocket on heatmap |
| $70,600 | 🟢 Intermediate Support | Algorithmic reloading zone (ETF) |
| $64,000 – $65,000 | 🟢 Major Support (Buy Power 66) | H4 launchpad — break invalidates mid-term bullish structure |
| $60,057 | 🟢 Ultimate Macro Floor | February 2026 annual low — Buy Power 62, Daily chart |
Strategic Conclusion: A Compression Preceding a Violent Expansion
The systematic investigation of the Bitcoin market in mid-April 2026 paints the portrait of an asset reaching institutional maturity. The resolution of the Ormuz crisis provided the macroeconomic substrate required — a deflation of energy risk premiums — to authorize major fund rotation into Bitcoin. Record ETF inflows, relentless MicroStrategy accumulation, US legislative engagement, and the redefinition of demand vectors by the nascent autonomous AI agent economy are constructing a spot buying floor of historical density.
The absolute line of demarcation lies between $78,500 and $79,500 (Sell Power 64 + Heatmap). A confirmed daily close above this wall would not be a simple resistance breakout — it would be the ignition trigger of a liquidation chain reaction propelling Bitcoin toward $83,000, sealing the asset’s entry into the most violent expansion phase of its 2026 macroeconomic cycle.
⚠️ Disclaimer: This article is written for educational and informational purposes only. It does not constitute investment advice, nor a recommendation to buy or sell digital assets or any other financial instrument. Cryptocurrency markets are highly volatile and carry significant risk of capital loss. Always consult a qualified financial advisor before making any investment decisions.