
In the second half of April 2026, Bitcoin (BTC) is navigating one of the most tension-laden consolidation phases in its recent history. Caught between two powerful opposing forces — an unprecedented institutional and regulatory infrastructure on one side, and an hyper-speculative, overleveraged market microstructure on the other — the reference digital asset finds itself at a critical crossroads. The resolution of the ascending triangle that has imprisoned prices for several weeks will dictate the trajectory for the entire quarter ahead. Full analysis.
I. The Macro Context: Bitcoin as a Safe Haven Asset
The Energy Crisis and Decoupling from Tech Equities
Historically correlated to technology indices like the Nasdaq, Bitcoin is undergoing a remarkable decoupling in spring 2026. The escalation of geopolitical tensions in the Middle East and maritime blockades have propelled Brent crude oil beyond the $100 per barrel mark, triggering massive sell-offs on traditional markets. In this context of systemic stress, Bitcoin’s decentralized architecture and continuous liquidity served as a hedging vehicle for institutional investors seeking to insulate themselves from contagion risk.
This shift fits into a broader macroeconomic framework: the IMF projects global public debt to reach 100% of world GDP by 2029. Faced with this unsustainable trajectory, Bitcoin is increasingly establishing itself in the minds of asset managers as an asymmetric insurance against sovereign default risk and the debasement of fiat currencies.
U.S. Regulatory Clarity: A Historic Turning Point
In mid-March 2026, the SEC and CFTC issued an unprecedented joint statement, explicitly clarifying that the vast majority of cryptographic assets do not constitute securities under the Securities Act of 1933. This formal positioning represents a radical departure from the regulation-by-enforcement approach of previous administrations and eliminates the existential risk of retroactive legal reclassification that had been restraining massive capital allocations from pension funds, sovereign wealth funds, and top-tier institutional wealth managers.
The direct consequence: Goldman Sachs filed a registration with the SEC for a Bitcoin Premium Income ETF, a sophisticated fund applying a covered-call overlay strategy on 40% to 100% of its underlying exposure. This financial mechanism generates current income by collecting option premiums, profoundly reshaping market microstructure through new mandatory hedging dynamics for market makers.
II. The Halving Cycle at Midpoint
In April 2026, the Bitcoin network sits exactly at the midpoint of its four-year cycle. With approximately 105,000 blocks remaining, the countdown has begun to the fifth halving, anticipated for April 2028, which will see the block reward fall to 1.5625 BTC. The current subsidy of 3.125 BTC per block limits daily issuance to approximately 450 new bitcoins, bringing the network’s annual inflation rate below 1% — a level lower than that of gold.
However, the translation of this scarcity into price performance is deviating significantly from historical models: since the April 2024 halving, Bitcoin has registered only approximately 15% gains — far below the parabolic surges of previous cycles. The cycle’s absolute peak appears to have been reached prematurely in October 2025, culminating around $126,000. Modelling suggests a genuine macroeconomic bottom may not materialize until between June and December 2026.
On the mining front, the 50% reduction in BTC-denominated revenues combined with stagnant prices is placing extreme operational pressure on the industry. A wave of M&A consolidation is underway — Riot Platforms’ attempt on Bitfarms being a perfect illustration. Only entities capable of diversifying their revenues (notably toward AI computing) will survive this « operational crypto-winter ».
III. The Heatmap: A Market Trapped in a Liquidity Vise
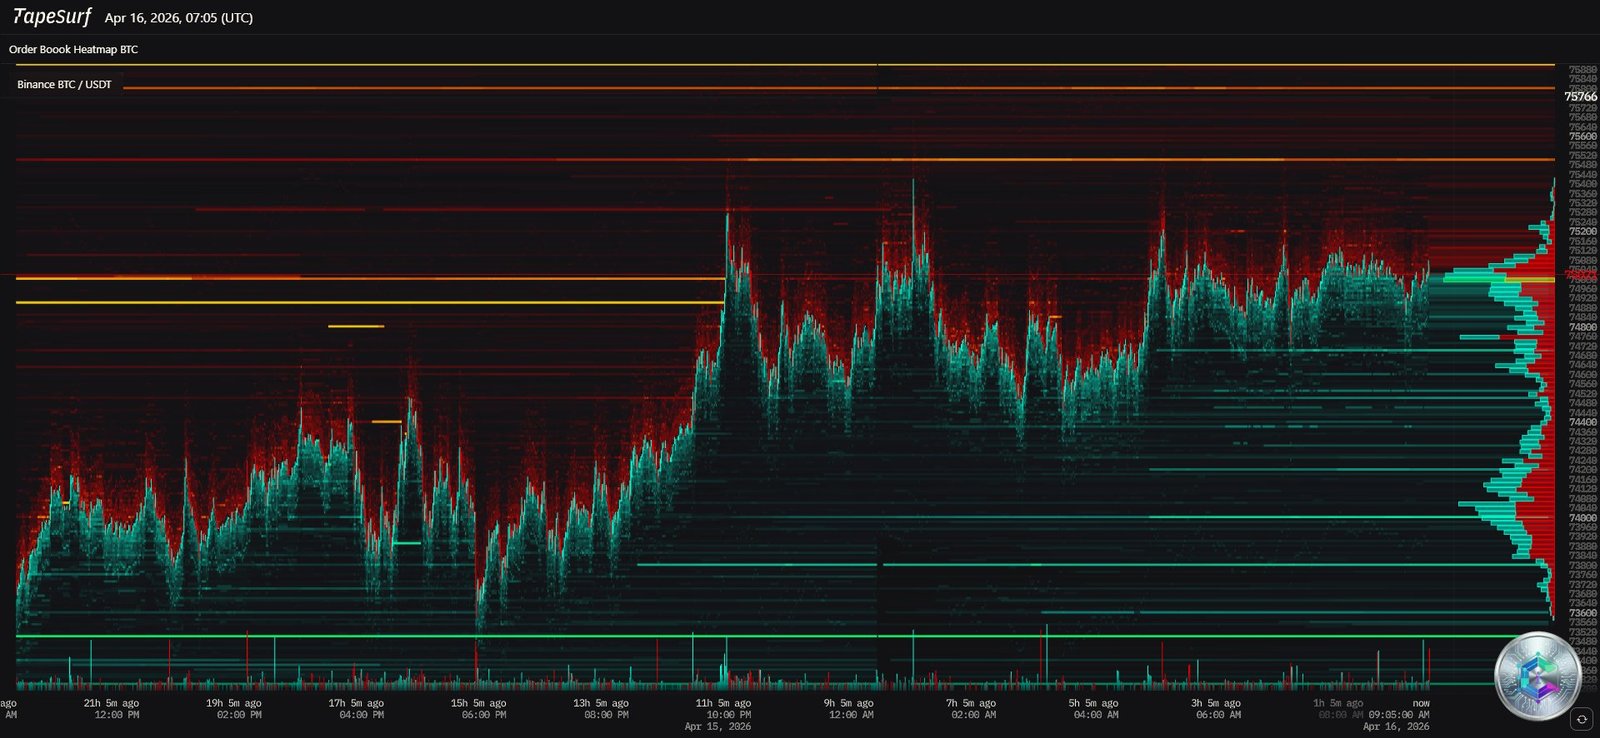
Analysis of the order book heatmap reveals an asymmetric liquidity structure of uncompromising clarity. Above the current price, dense red and orange bands materialize an exponential concentration of sell orders between $75,000 and $76,500. Below, more diffuse buying liquidity strata attempt to establish a floor between $73,000 and $74,000.
This imbalance structures the mechanics of future price moves. During a recent energy-crisis-driven impulse, Bitcoin tested the $72,530 level, triggering the liquidation of $16.29 million in short positions within one hour against only $150,600 in long liquidations — a ratio of 1 to 108, representing a 10,860% disproportion. This algorithmically orchestrated liquidity hunt (stop run) is the signature of market makers seeking to exhaust available supply.
The $75,000 zone also crystallizes a Negative Gamma phenomenon: options market makers, to maintain their delta neutrality, are mathematically forced to buy Bitcoin as prices rise and sell it as prices fall. This mechanism exponentially amplifies each directional move, transforming this zone into a literal powder keg.
IV. Multi-Timeframe Chart Analysis
Daily Chart: The Ascending Triangle and the $89,050 Target
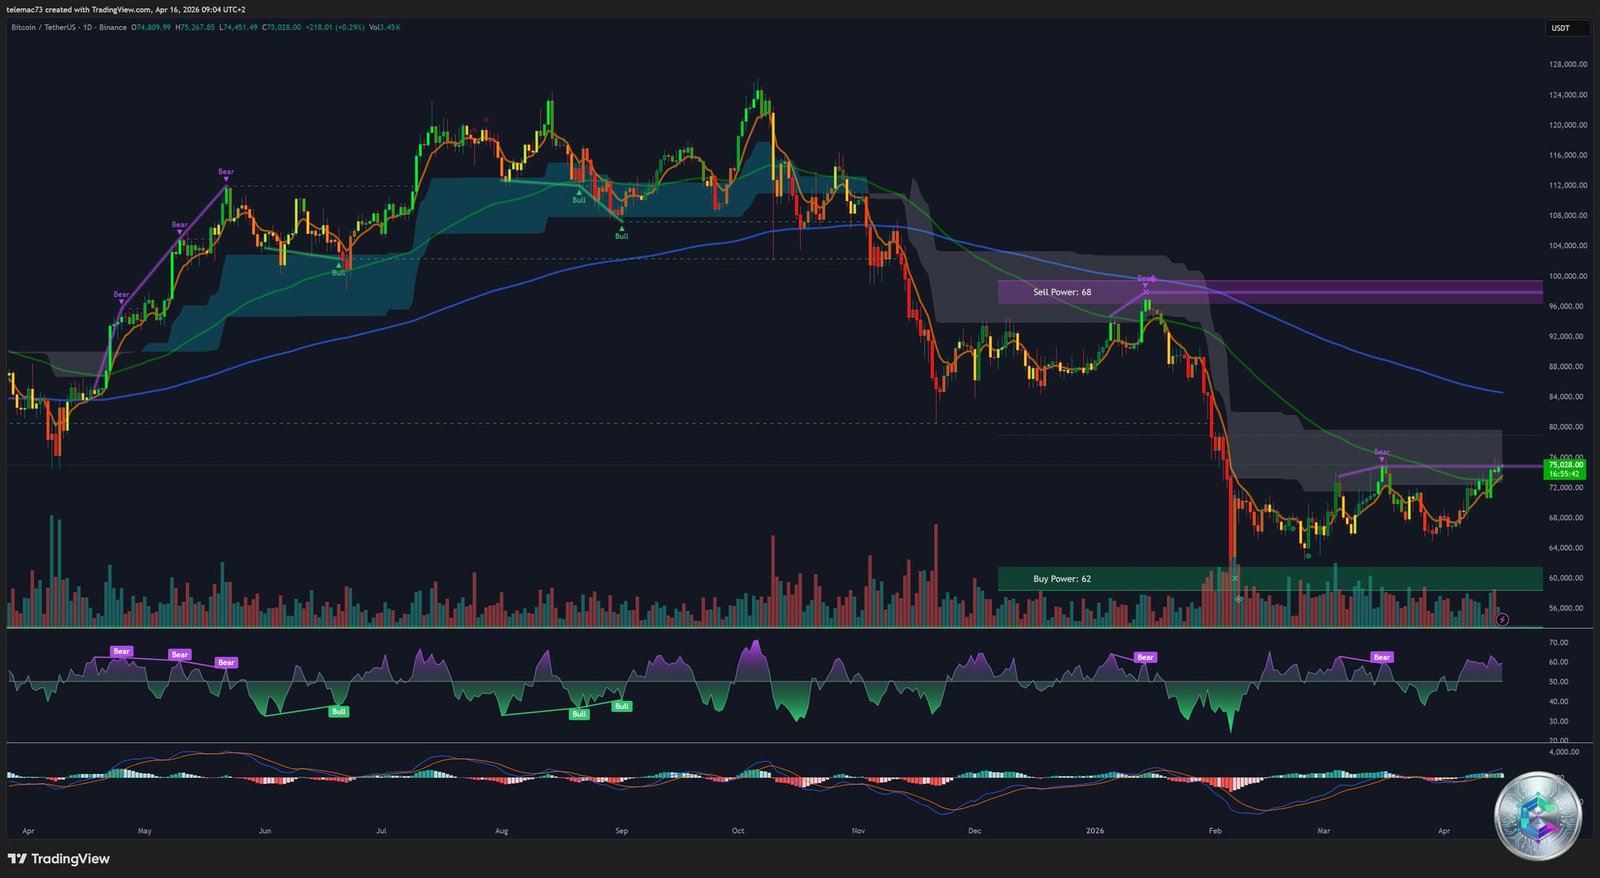
The daily chart provides a striking macro-structural perspective. Following the October 2025 all-time high (≈$126,000), a multi-month capitulation found its bedrock in the $60,000–$65,000 zone (« Buy Power: 62 »). From this floor, price action has been attempting to restructure within an ascending triangle: a flat horizontal resistance between $74,000 and $76,000, and an upward-sloping lower trendline marking systematic higher lows.
The theoretical bullish breakout target, calculated by projecting the triangle’s base height, is set at $89,050 — a potential 18% appreciation from current levels. However, this scenario runs into a major dynamic resistance wall: 100-day moving averages converge precisely around $75,000, and the weekly « Bull Market Support Band » ($78,000–$80,000) has flipped into an overhead resistance.
4-Hour Chart: The Tactical Battle and RSI Divergences
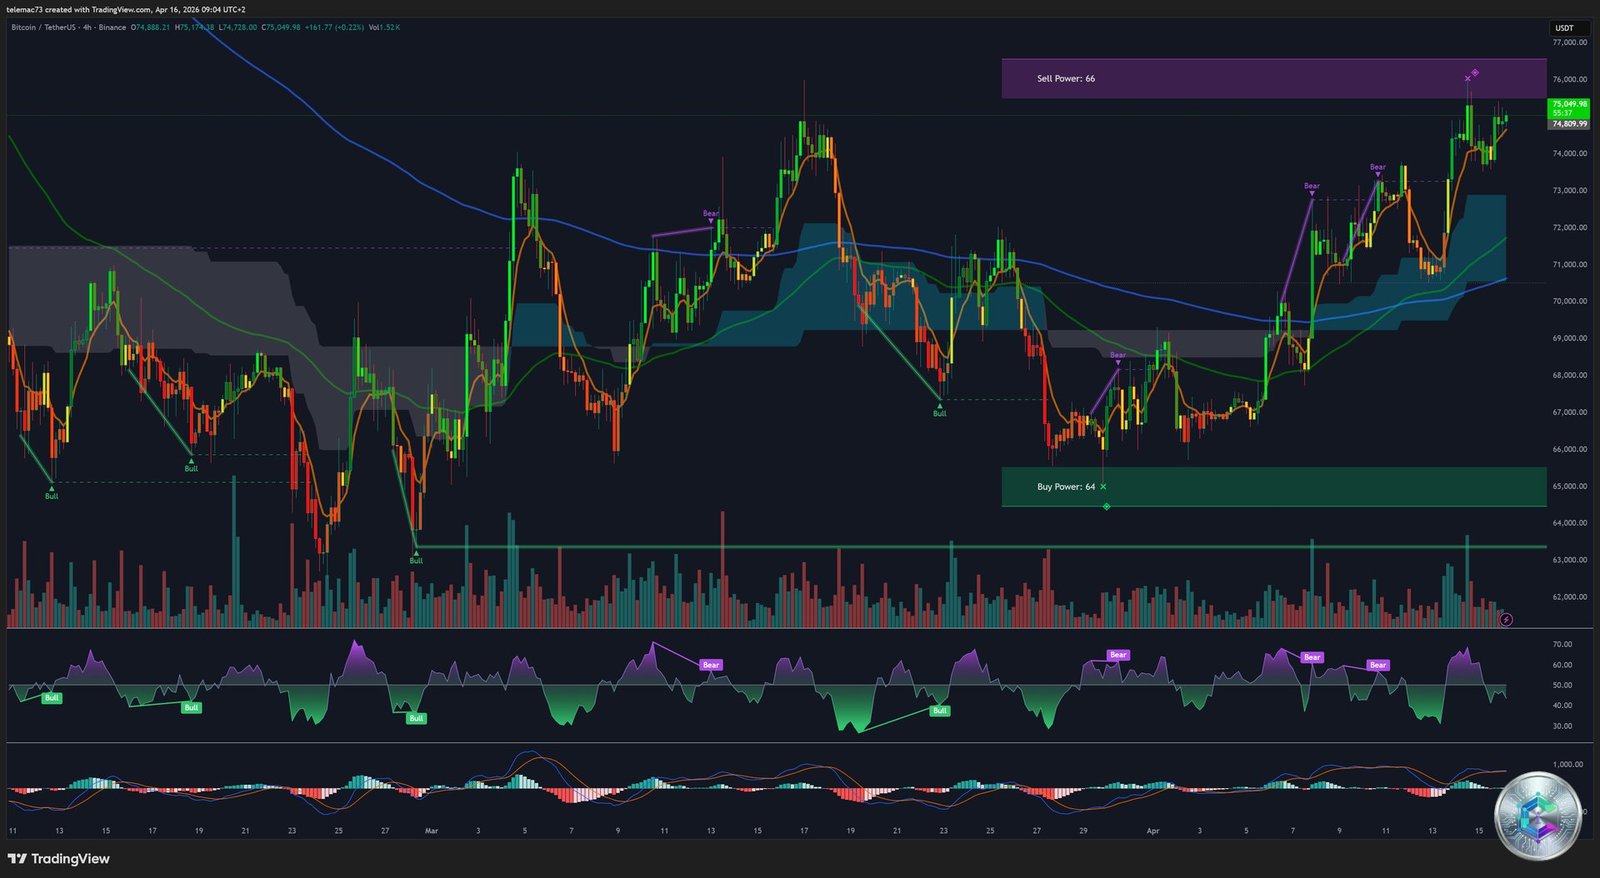
On the 4-hour timeframe, the tactical battle unfolds with precision. Immediate resistance is materialized by a « Sell Power: 66 » block between $75,000 and $76,000. The vital pivot at $70,467 constitutes the directional anchor: as long as 4H candle closes hold above this level, the path of least resistance remains oriented upward. Conversely, a break below would trigger aspiration toward the $70,540 liquidation cluster ($114.5 million in exposed long positions).
Critical note: multiple « Bear » bearish divergence signals on the RSI during recent tests of $75,000 explain the repeated inability of prices to break out of consolidation. Buying momentum exhausts prematurely at each assault attempt.
15-Minute Chart: The Algorithmic Footprint and Compression
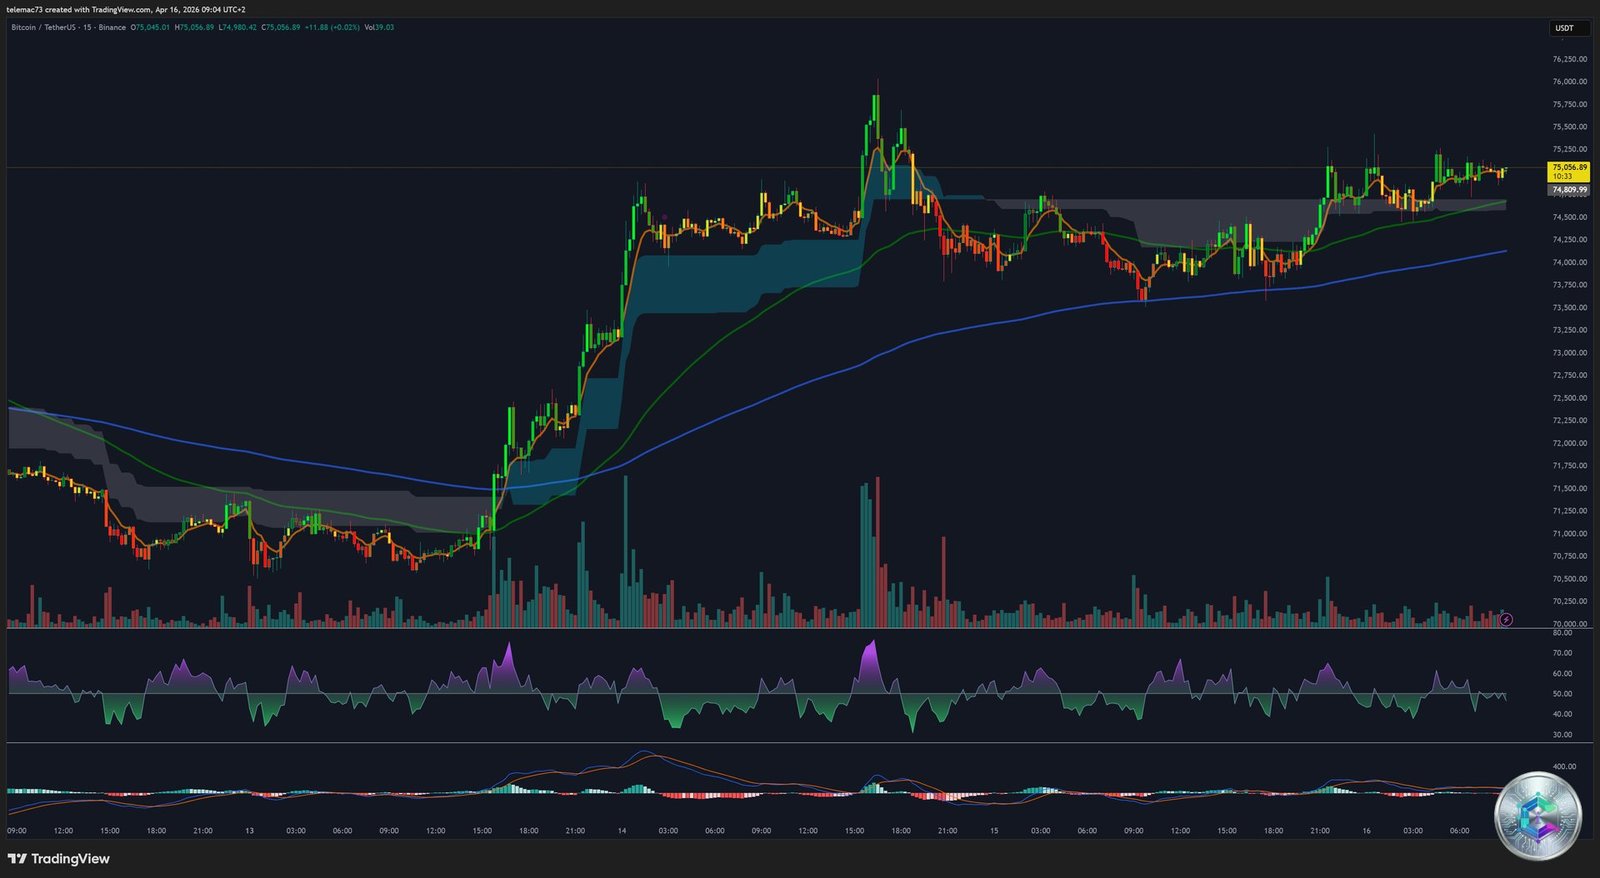
The microscopic M15 timeframe reveals the predatory behavior of HFT (High-Frequency Trading) systems. Prices meander in a horizontal compression channel, moving averages flattening and intertwining — a classic precursor to an imminent volatility explosion. The energetic buying reaction at the $73,617 floor (large rejection candles with long lower wicks) proves that short-term participants currently interpret these levels as tactical accumulation opportunities rather than the onset of a macro bearish reversal.
V. Technical Oscillators: The Warning Signals
Quantitative indicators paint a nuanced and contradictory picture depending on the timeframe:
- Daily RSI (14 periods): 55 — Neutral-bullish zone, momentum still far from overbought territory (critical threshold: 70). Substantial room for further upside remains.
- Daily MACD: +125.85 — Positive histogram validating underlying buying pressure, conditional on price holding above $73,400.
- ATR (14): 498.42 — High-volatility regime confirmed. Wide stop-loss levels are imperative for any directional trading.
- Fast Stochastic (9,6): 99.06 — Extreme and absolute overbought zone. Strong statistical warning of an imminent tactical correction.
- Williams %R: -1.144 — Algorithmic overheating confirmed. Complementary warning signal alongside the stochastic.
- TRIX — Testing its zero line. A validated break above would establish a resilient and persistent bullish bias.
VI. Key Price Level Map
| Classification | Price Zone (USD) | Significance |
|---|---|---|
| Macro Secular Resistance | $78,000 – $80,600 | Inverted Weekly Bull Market Support Band. Decisive break = return to pure Price Discovery. |
| Major Resistance Wall | $76,000 – $76,500 | Peak heatmap concentration. Short Squeeze trigger threshold (≈$200M). |
| Gamma Pivot Zone | $75,000 – $75,500 | Asymmetric volatility release point. 100-day MA confluence. Critical nerve center. |
| Minor Friction Support | $73,617 – $74,000 | Recent intraday low. Short-term tactical accumulation zone. |
| Vital Intermediate Support | $70,467 – $71,124 | Crucial H4 pivot + 50-day EMA. Break = aspiration to $70,540 cluster ($114.5M in longs). |
| Fibonacci Support | $68,950 | 23.6% Fibonacci retracement. Last safety net before macro floor. |
| Critical Macro Floor | $64,000 – $65,666 | Bull market waterline. Daily close below = secular bearish bias reactivated. |
Conclusion: Tactical Neutrality Pending the Decisive Break
The complete Bitcoin market autopsy in April 2026 depicts an asset grappling with a profound paradox. On one side, structural fundamentals have never been stronger: historic regulatory clarity, sophisticated institutional financial engineering, growing algorithmic scarcity, and repositioning as a macroeconomic safe haven. On the other, the short-term price microstructure is a pressure cooker at maximum tension: tightening Bollinger Bands, stochastic oscillators in absolute overbought territory, contracting spot buying flows, and an explosive Negative Gamma positioning.
The market’s fate for the coming quarter will be decided around the $75,000–$76,500 zone. Two strictly binary scenarios:
- Bullish scenario: Convincing break above $76,500 with spot volume → $200M+ Short Squeeze → air pocket to $89,050 (triangle target).
- Bearish scenario: Failure to hold $70,467 → $114.5M Long Squeeze at $70,540 → test of the vital $64,000–$65,666 bull market waterline.
Operational discipline is paramount: any directional engagement inside the $73,000–$76,000 minefield without chartist confirmation on a closed daily or weekly candle constitutes an unjustified asymmetric risk. Waiting for a clear and undeniable close outside the compression boundaries remains the only rational approach under current Gamma-driven, institutionally-dominated market microstructure conditions.
⚠️ Disclaimer: This article is written for purely educational and informational purposes. It does not constitute investment advice, a recommendation to buy or sell, or an inducement to conduct transactions in digital assets. Cryptocurrency markets are extremely volatile and carry risks of capital loss that can be total. Any investment decision must be made based on your personal situation, risk tolerance, and, where necessary, after consultation with a qualified financial advisor.