
Introduction: A Market in Critical Re-Accumulation Phase
As of April 13, 2026, Bitcoin (BTC) is navigating a critical consolidation phase at the intersection of heightened macroeconomic volatility and deep structural realignments. With the global crypto market cap at $2.49 trillion and a daily trading volume of $67.02 billion, liquidity remains substantial despite a severely strained psychological climate. Bitcoin commands a dominant 56.90% market share.
Price action revolves around $71,047, following a significant correction from its all-time high (ATH) above $123,500 — a textbook 50% retracement to the $60,000 zone before the current recovery. The Fear & Greed Index stands at 12/100 — Extreme Fear — a level historically correlated with macro market bottoms and institutional wealth transfer.
Part I — Macroeconomic Environment & Exogenous Shocks
The Stagflation Specter
March Core CPI posted a +0.196% monthly gain, slightly below consensus estimates. This initially acted as a bullish catalyst before the University of Michigan Consumer Sentiment survey revealed a historic collapse in confidence — raising the dreaded specter of stagflation.
In this scenario, the Fed is trapped: hiking rates risks triggering a severe recession, while cutting them devalues fiat currency. Bitcoin, as an asset with inelastic supply, plays its role as a hedge against monetary debasement. Markets are now watching for upcoming PCE data — a favorable reading could catalyze a decisive breakout above the $73,000 resistance.
The Strait of Hormuz Geopolitical Wildcard
Iran has floated the idea of imposing crypto-denominated tolls for transit through the Strait of Hormuz — one of the world’s most critical energy chokepoints. This sent shockwaves through markets, prompting institutional managers to reduce exposure to volatile assets in a classic de-risking move.
Paradoxically, the second-order implication of this same geopolitical dynamic is the entrenchment of sticky U.S. inflation, ensuring that institutional allocation to anti-dilutive assets like Bitcoin remains a fiduciary necessity. The failure of weekend U.S.-Iran talks briefly pushed BTC below $70,000, before resilience above $68,750 demonstrated exhaustion among macro sellers.
Part II — On-Chain Data & Institutional Capital Flows
The Silent Accumulation of Whales
Whale cohorts (addresses holding 10,000+ BTC) recorded net inflows for only the second time in all of 2026. While retail investors capitulate or remain paralyzed, high-conviction wallets are absorbing floating supply. This massive withdrawal to cold storage creates a structural supply illiquidity: any positive catalyst could trigger a violent supply squeeze, potentially redefining $80,000 as the new baseline valuation floor.
Spot ETF Flows & Derivatives Deleveraging
Spot Bitcoin ETFs recorded daily inflows of $471 million (highest since February), temporarily pushing price above $71,000. However, $250 million in outflows on other sessions have capped the rally below the $73,000 resistance wall.
On the derivatives side, CME Open Interest has dropped to its lowest level in 14 months — a sign of healthy deleveraging. A spot-driven market with low leverage drastically reduces the risk of cascading liquidations and provides a solid foundation for an organic, sustainable rally.
Part III — Microstructure: Order Book Heatmap Analysis
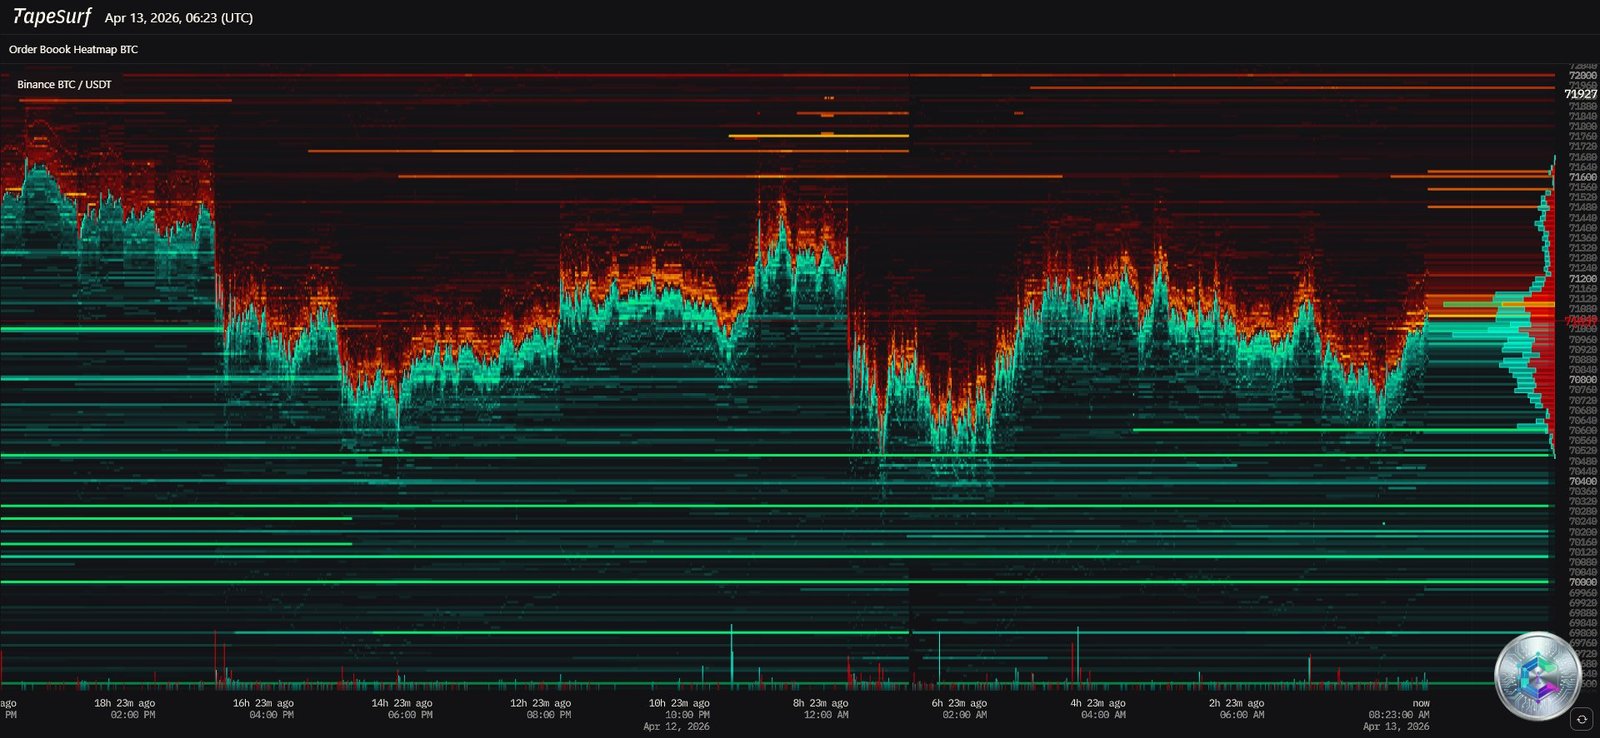
The heatmap above reveals the precise topography of passive liquidity between $68,000 and $73,000. The color coding is fundamental: red/orange bands indicate massive sell walls (ask liquidity), while bright green/cyan bands represent bid liquidity blocks.
- Immediate resistance: Dense sell walls between $71,800 and $73,000 — the micro-structural explanation for multiple rejections near this level.
- Layered support: Distinct green lines at $70,000 (major psychological level), $69,000, and $68,000 — safety nets placed by market makers.
- Point of Control (POC): The dominant volume node sits precisely around $71,000, explaining the strong gravitational attraction to this level.
The $105,000 Liquidity Magnet — Forced Liquidation Mapping
Liquidation cluster analysis reveals a major directional asymmetry. Excessive longs have already been flushed during recent drops. Predatory algorithms are now focused upward, targeting a colossal block of short liquidity between $105,000 and $110,000. The space between the current top and this cluster is characterized by thin liquidity — if Bitcoin generates enough bullish momentum to break current resistance, the move could become a self-feeding parabolic ascent. Nearly $1.5 billion in short positions would be wiped out simply by clearing the $95,000 psychological level.
Part IV — Daily Chart Analysis (1D)
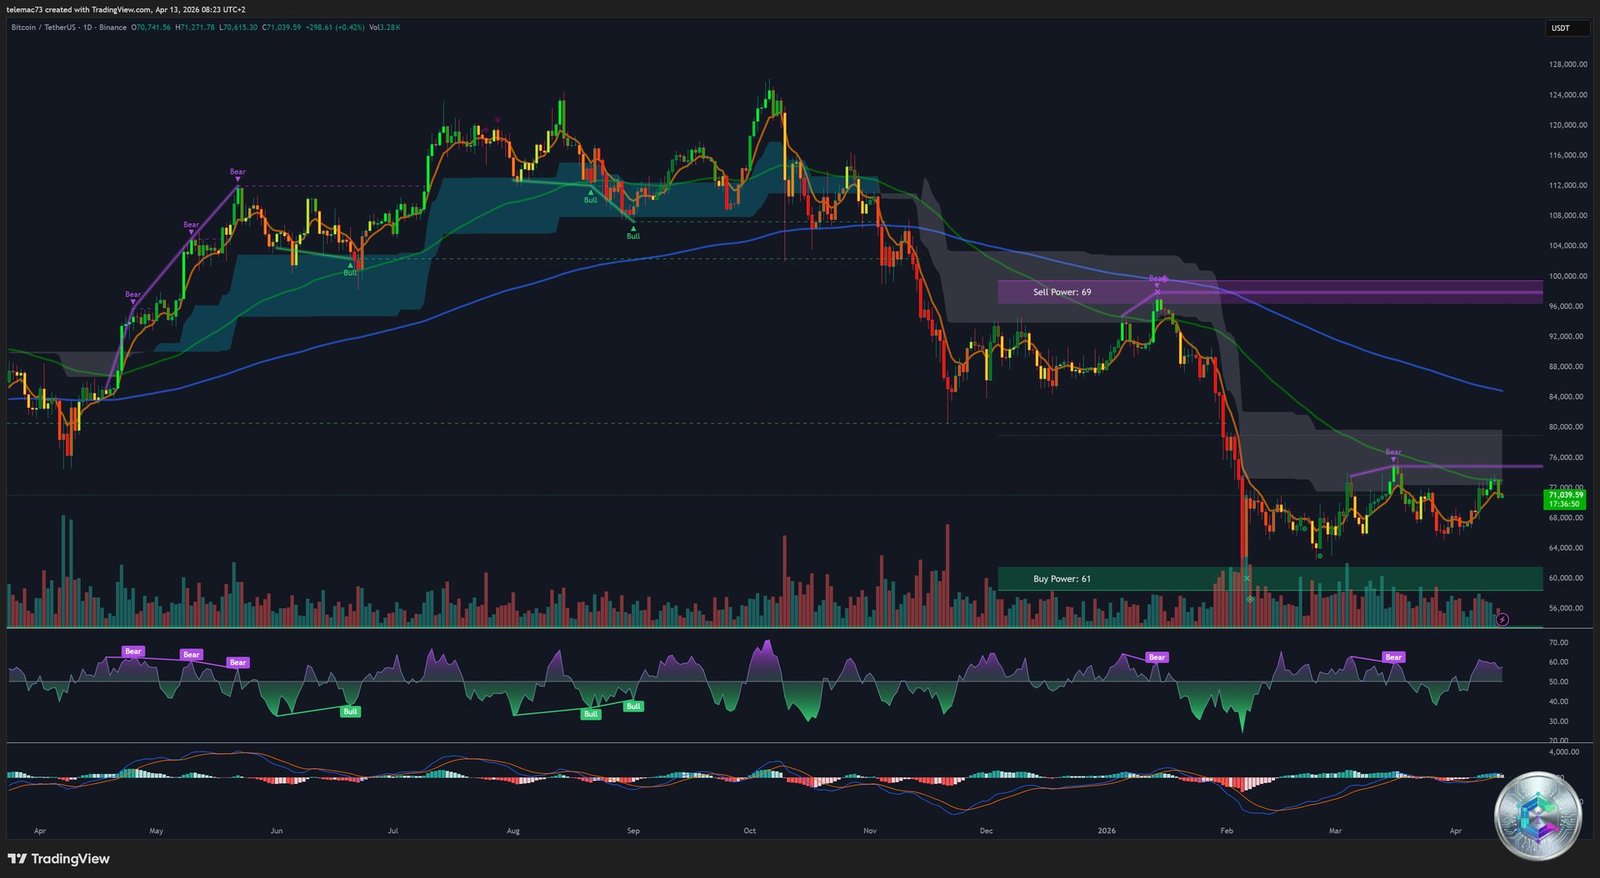
The daily chart covers the full price range from $60,000 to $124,000, illustrating the complete cycle: ATH euphoria → 50% purge → recovery. Current price (~$71,038) is inscribed within a large Broadening Wedge pattern, typical of post-crash re-accumulation phases.
Daily RSI & MACD — Reversal Signals
The daily RSI plunged below 30 during the $60,000 crash, then rebounded aggressively, now crossing the median line at 50 (current: ~58). This crossover is canonically recognized as the technical confirmation of a new macro bullish trend. On the weekly timeframe, the RSI is executing a major bullish breakout above its resistance trendlines — the mathematical basis for projections targeting $105,000.
The daily MACD histograms are lightening from deep red and converging toward the zero line. A rare bullish crossover on the 3-day MACD is currently being validated — an event that typically signals maximum risk-on allocation for quantitative funds.
Part V — 4-Hour Intermediate Analysis (H4)
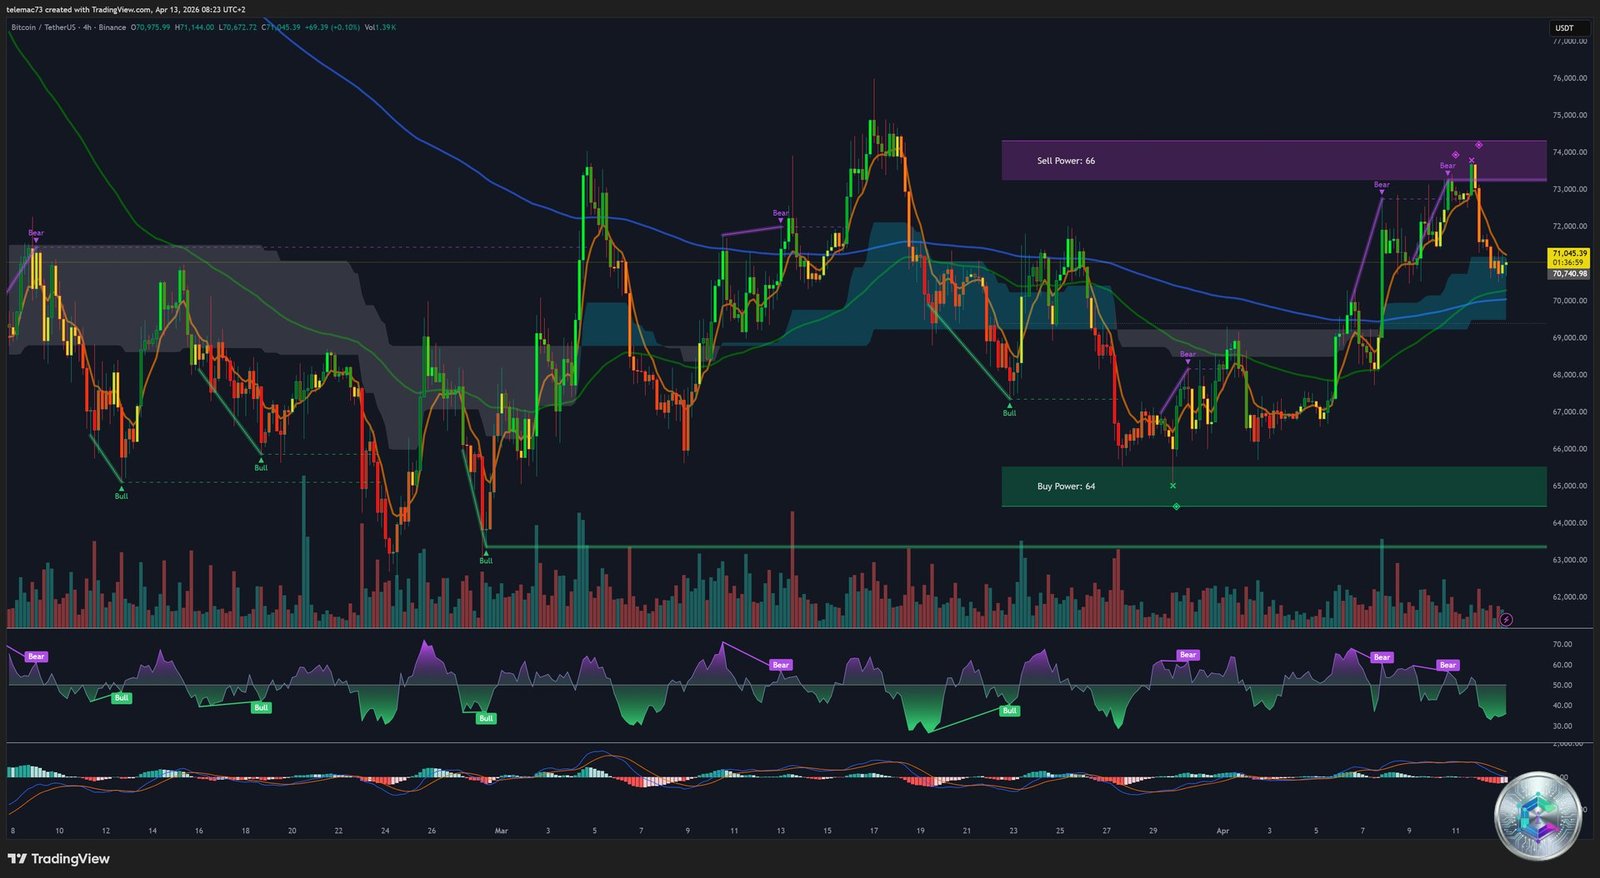
On the H4 timeframe, Bitcoin is evolving within a confinement geometry between two well-identified tectonic forces:
- « Buy Power: 64 » support: An inviolable zone between $64,000 and $65,000, confirmed through multiple bearish attacks.
- « Sell Power: 66 » resistance: A brick wall between $72,000 and $74,000, perfectly correlated with the heatmap data.
A critical development: a bearish Head & Shoulders pattern has invalidated — the neckline never decisively broke. In institutional analysis, a failed bearish pattern typically generates an opposing move of extreme violence (partial short squeeze). Following this invalidation, Bitcoin printed a healthy structure of higher lows, reclaiming bullish initiative.
The H4 RSI at ~63 confirms momentum firmly controlled by buyers with sufficient room to push toward the $73,600 resistance. The H4 MACD shows a bullish crossover with signs of fatigue approaching the zero line, reflecting the choppy nature of the consolidation.
Part VI — 15-Minute Microstructure (M15)
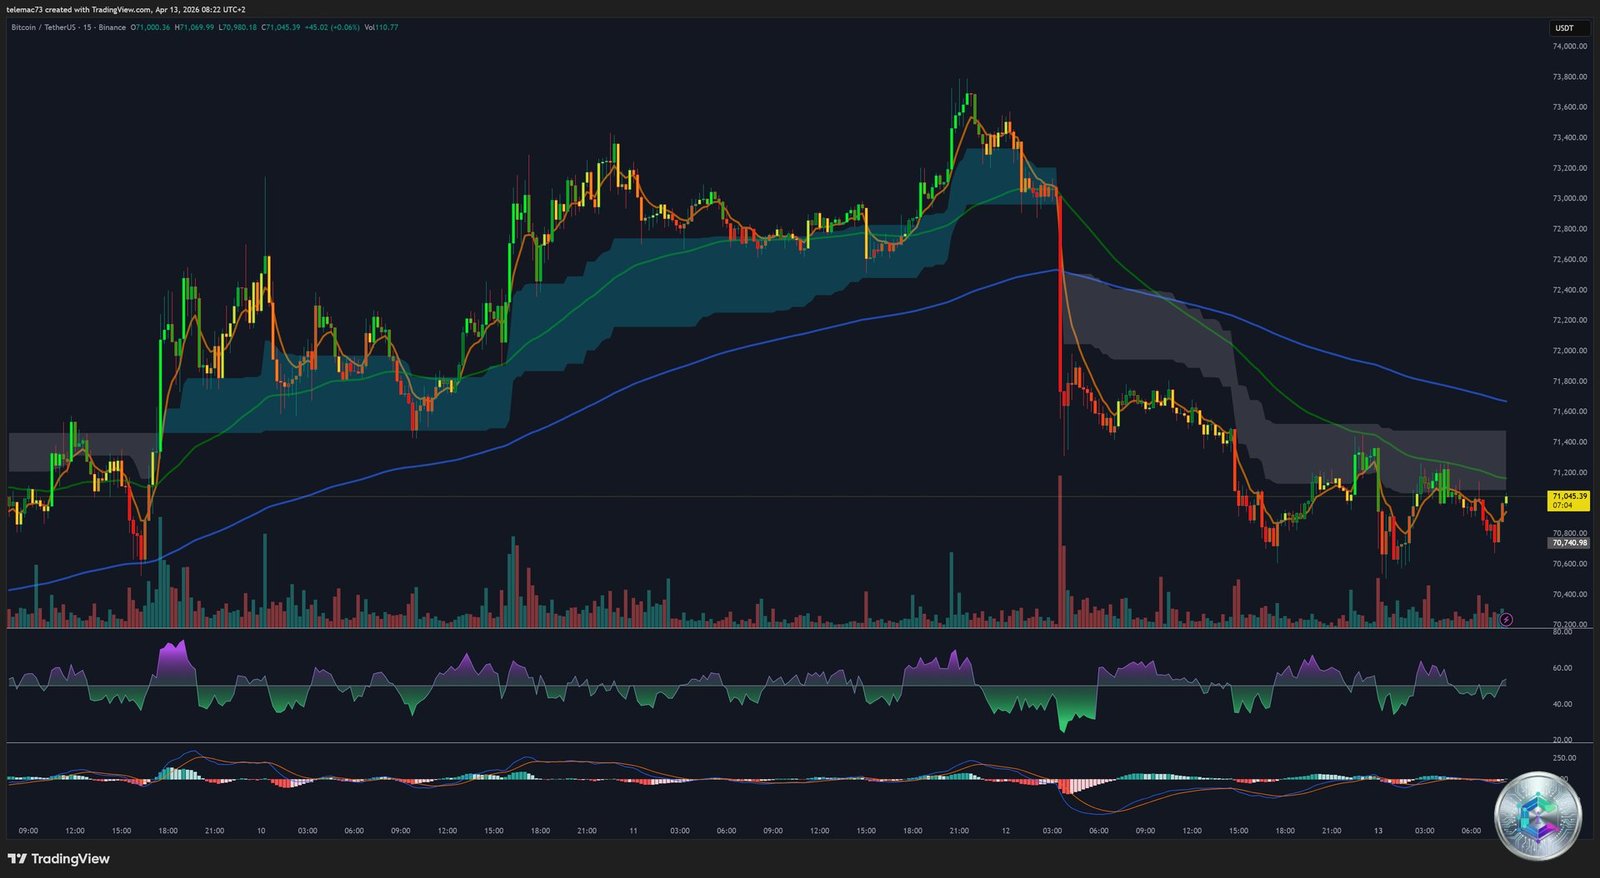
The M15 chart documents a local flash crash: from a peak above $73,000, price collapsed vertically to an intraday low of $70,616, accompanied by a massive volume spike. This behavior is symptomatic of a stop-loss hunt triggered by sudden geopolitical news flow.
Absorption occurred precisely at the $70,600 support. From this local capitulation point, the market is executing a choppy relief rally, stabilizing around the fair value at $71,000.
M15 signals are now turning constructive:
- The 15-min RSI is rebounding aggressively from extreme oversold territory (<20).
- The 15-min MACD is printing a Golden Cross on its signal lines from deeply negative post-crash territory.
- Price is forming a tight triangular compression — an imminent volatility eruption is mathematically inevitable.
Part VII — Strategic Level Mapping
Resistance Matrix & Upside Targets
| Structural Zone | Price Level (USD) | Analytical Confluence |
|---|---|---|
| Main Sell Wall | $72,000 – $74,000 | Sell Power: 66 — Maximum red density on heatmap — Multiple confirmed rejections |
| MT Channel Resistance | $76,100 – $76,200 | H4 bearish channel upper boundary — Tested during FOMC announcements |
| Short Squeeze Threshold | $95,000 | ~$1.5B cascading short liquidation trigger |
| Magnetic Zone | $105,000 – $110,000 | Short liquidity magnet — Thin liquidity above — Weekly RSI target |
| Absolute Macro Resistance | $131,000 – $135,000 | Fibonacci 2.618 extension — Daily Broadening Wedge projection |
Support Matrix & Downside Floors
| Structural Zone | Price Level (USD) | Analytical Confluence |
|---|---|---|
| Fair Value Pivot | $70,820 – $71,047 | Intraday POC — Current algorithmic equilibrium zone |
| Psychological Support | $70,000 | Persistent institutional demand — H4 EMA 50/200 |
| Microstructure Support | $68,750 | Last H4 bastion — Break below invalidates ST bullish market structure |
| Buy Power Zone | $64,000 – $65,600 | Buy Power: 64 — Massive green liquidity floor on heatmap |
| Macro Floor | $60,000 – $63,000 | February double bottom — Complete seller exhaustion |
Strategic Conclusion
Bitcoin’s market on April 13, 2026 operates within a network of highly deterministic forces. The current Broadening Wedge consolidation is not a symptom of structural exhaustion, but rather the final re-accumulation phase before a major directional resolution.
Converging bullish elements include: documented on-chain institutional accumulation, invalidation of the bearish H&S pattern, multi-day and weekly RSI/MACD signals, and total liquidation risk asymmetry now pointing upward. The highest probability resolution of this tectonic friction remains an upside volatility eruption, with the first major target at the $105,000 – $110,000 zone.
⚠️ Disclaimer: This article is written for educational and analytical purposes only. It does not constitute investment advice, nor a recommendation to buy or sell cryptocurrencies or any other financial asset. Cryptocurrency markets are extremely volatile and past performance does not guarantee future results. Only invest what you can afford to lose, and consult a licensed financial advisor before making any investment decision.