
As of February 17, 2026, Tether Gold (XAUt) is navigating a major technical correction after nearly touching $5,600 per token in late January. From closed Asian markets during Lunar New Year to unexpected geopolitical pivots and Federal Reserve pressure, the forces bearing down on tokenized gold are multiple and complex. A full breakdown.
🌍 Macro & Geopolitical Context: The Perfect Storm for Gold
Lunar New Year: Asia Goes Quiet, Volatility Spikes
One of the immediate drivers of current price weakness is the simultaneous closure of Asian markets for Lunar New Year (February 16–23, 2026). Mainland China, Hong Kong, Singapore, Taiwan, and South Korea together account for the majority of global physical gold demand. In the absence of these structural buyers, Western derivatives markets are exposed to reduced liquidity — amplifying every speculative downward move.
| Market | Status (02/17/2026) | Liquidity Impact |
|---|---|---|
| Mainland China | 🔴 Closed (Lunar New Year) | Very High — Drop in physical demand |
| Hong Kong | 🔴 Closed | High — Decline in institutional trading |
| Singapore | 🔴 Closed | Moderate — Reduced regional flows |
| United States | 🟢 Open (post Presidents’ Day) | High — Concentration of selling volume |
The Kremlin Memo: The Unexpected Geopolitical Shock
The most structurally disruptive event is the leak of an internal Kremlin memorandum, revealed by Bloomberg on February 13, 2026. The document suggests Russia is seriously considering re-entering the US dollar settlement system as part of a strategic economic partnership with the Trump administration, in exchange for joint ventures in natural gas, offshore oil, and critical minerals (palladium, nickel).
This policy reversal challenges one of the fundamental pillars of gold’s rally since 2022: central bank de-dollarization. If Russia and other BRICS nations realign with the dollar, demand for gold as an alternative reserve asset could structurally decline.
The Fed Stays Hawkish: Real Rates Weigh on Gold
Despite encouraging signs on headline inflation, persistent services inflation is pushing the Federal Reserve to maintain a restrictive stance. Markets have pushed back expectations for the first rate cut to mid-2026. In this environment, the opportunity cost of holding XAUt — compared to US Treasuries yielding 4–5% — remains high and represents a lasting headwind.
🏦 Tether Gold (XAUt) Fundamentals: Rock-Solid Foundations
Backing Mechanism & Transparency
Each XAUt token is backed by one troy ounce of fine gold from a London Good Delivery bar, stored in high-security Swiss vaults. Tether publishes regular independent attestations and allows qualified holders to redeem their tokens for physical gold — a decisive advantage over traditional ETFs. In Q1 2026, Tether’s gold reserves have reached record levels:
| Reserve Metric | Value (Q1 2026) |
|---|---|
| Physical gold held | ~148 tonnes (4.75M oz) |
| Reserve value | ~$23 billion USD |
| Market share (Gold Stablecoins) | ~60% |
| XAUt market capitalization | >$2.6 billion |
| Annual holder growth | +150% |
With 148 tonnes of gold, Tether ranks among the top 30 gold holders in the world, surpassing the central banks of Qatar and Australia. This reality is fundamentally reshaping institutional perception of the asset.
Ecosystem Expansion: Gold.com, Derivatives & Dividends
On February 12, 2026, Tether acquired a minority stake in Gold.com for $150 million, aiming to integrate XAUt into mainstream physical distribution channels. Meanwhile, mining companies like Elemental Royalty (ELE) now offer shareholders the option to receive their quarterly dividends directly in XAUt tokens — creating unprecedented real-world utility for the tokenized asset.
📊 Multi-Timeframe Technical Analysis
Daily Chart (1D): The End of the Parabola
The daily chart illustrates a parabolic uptrend that began in mid-2025, driven by massive central bank buying and growing distrust of fiat currencies. The peak of January 29, 2026 at $5,596.70 represented an extreme extension from long-term moving averages. The break below $5,000 is a significant weakness signal: while price remains under this threshold, the daily bias shifts to neutral-to-bearish. The daily RSI is rolling over from overbought territory, confirming that an extended consolidation phase is needed to purge the excesses of 2025.

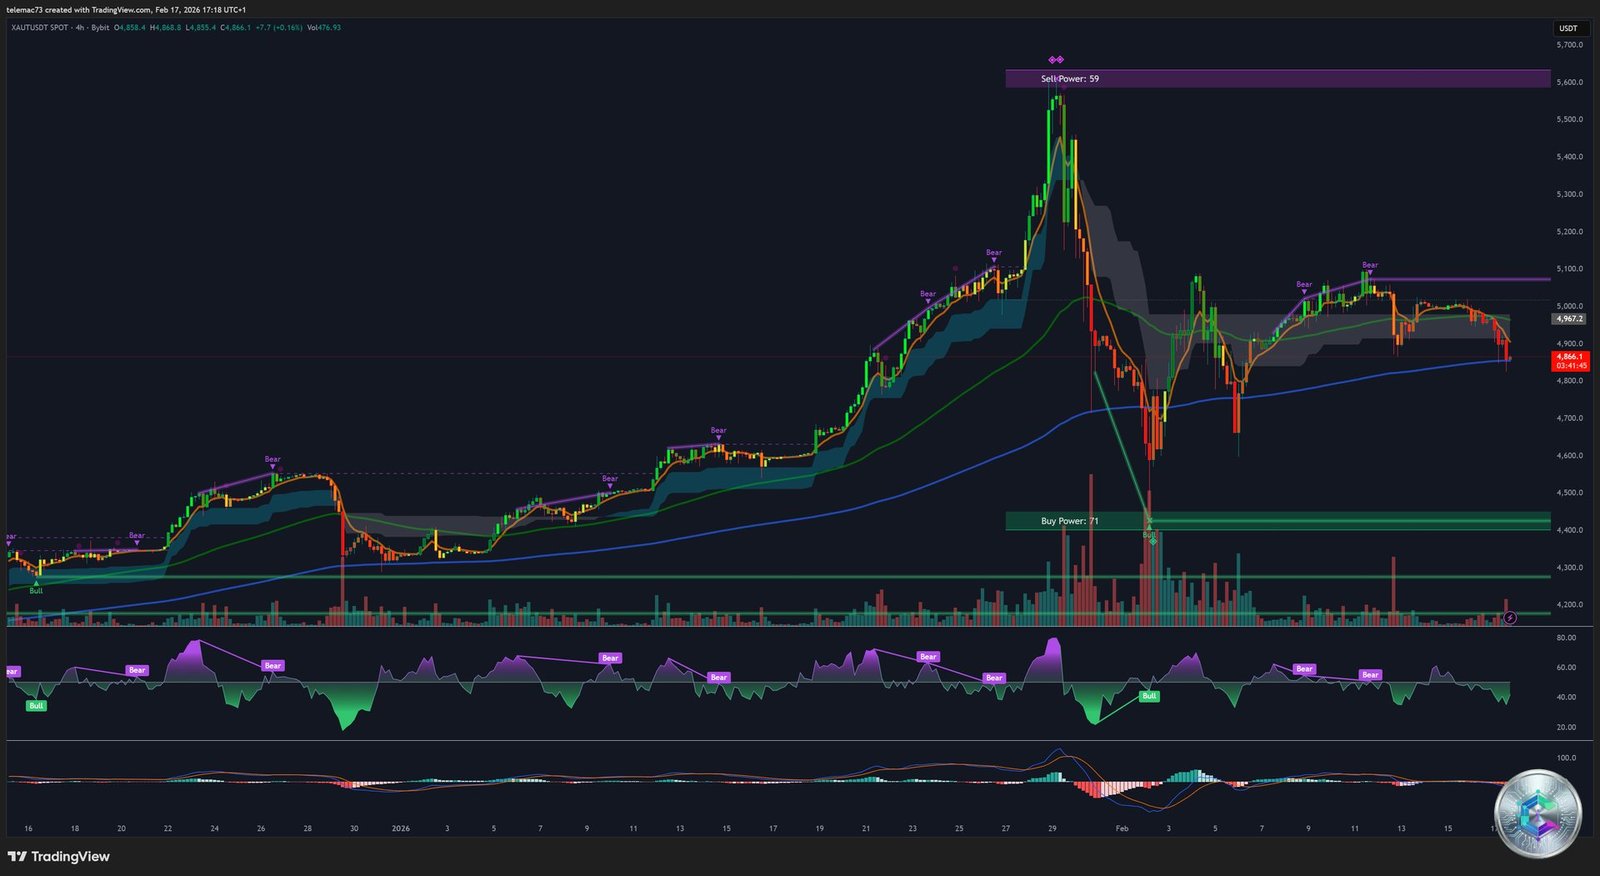
4-Hour Chart (4H): The Decisive Pivot Zone
The 4H timeframe reveals the internal mechanics of the correction. A powerful Sell Power zone (institutional distribution) is identified at the $5,600 top, while a Buy Power zone (accumulation) forms around $4,400. The current price (~$4,917) is oscillating around a critical technical pivot at $4,862.60:
- If the pivot holds with increasing volume → recovery toward $5,030 becomes viable
- If the pivot breaks → path opens toward major support at $4,660
15-Minute Chart (15M): Intraday Reading
The 15M chart shows a series of cascade drops followed by horizontal consolidation phases. The February 17 low at $4,858.20 defines an intraday demand zone ($4,850–$4,870) where short-term buyers are attempting to stabilize price. Warning: liquidation heatmaps signal a buildup of stop orders below $4,850 that could trigger a flash crash toward $4,750 on a decisive breakdown.

Key Levels Summary Table
| Level | Price | Significance |
|---|---|---|
| 💰 Current Price | $4,917.40 | Bearish consolidation |
| ⚖️ Major Pivot | $4,862.60 | Short-term decision level |
| 🟢 Immediate Support (S1) | $4,850.00 | Intraday demand zone |
| 🟢 Critical Support (S2) | $4,660.00 | Daily structural support |
| 🔴 Resistance (R1) | $5,000.00 | Major psychological threshold |
| 🔴 Resistance (R2) | $5,150.00 | Bullish reversal confirmation |
| 📈 200-Day EMA | $5,215.00 | Long-term trend resistance |
🌊 Liquidity, Heatmaps & Whale Behavior
Liquidation data as of February 17 reveals a predominance of short liquidations during intraday bounces ($225 in shorts vs. $54 in longs), signaling a market crowded with short sellers. A short squeeze is possible if price manages to break through the $4,980–$5,020 resistance zone with conviction.
The liquidation heatmap shows high-intensity zones just above current price levels (aggressive sellers), while institutional buyers (whales) appear to be waiting in the $4,400–$4,600 zone to accumulate heavily. On-chain data confirms this silent accumulation: the number of XAUt holders has grown +150% in one year, signaling a transition of the asset from speculative tool to long-term capital preservation instrument.
🔗 Correlations: XAUt vs BTC & Physical Gold
In 2026, the XAUt/BTC divergence has deepened. While Bitcoin has suffered a 53% correction from its highs, tokenized gold displays superior resilience. The XAUT/BTC ratio shows bullish chart patterns (Morning Star, Bullish Harami), suggesting a rotation of crypto capital toward tokenized gold in risk-off mode.
Compared to physical gold and traditional ETFs, XAUt offers instant transferability via Ethereum, TON, or LayerZero without logistical friction. A slight discount of $30–35 is occasionally observed on some trading platforms — an arbitrage opportunity for high-frequency institutional actors.
🎯 2026 Outlook: What Are the Major Institutions Saying?
| Institution | XAUt / Gold Target (End 2026) | Main Driver |
|---|---|---|
| 🏦 J.P. Morgan | $6,300 | Massive diversification toward real assets |
| ANZ Bank | $5,800 | Sustained EM central bank buying |
| Goldman Sachs | $5,400 | ETF inflows + Fed rate cuts |
| Bank of America | $5,000 | Investment demand + persistent inflation |
| Deutsche Bank | $4,450 (average) | Post-euphoria consolidation range |
Institutional consensus remains predominantly bullish on gold for 2026, with Goldman Sachs targeting $5,400 based on a repeat of 2025’s key drivers: structural central bank purchases and a Fed rate-cutting cycle.
Risk Scenarios & Invalidation
The primary bearish risk is a sustained US dollar strengthening. If Trump’s policies stimulate growth while maintaining high rates to fight residual inflation, gold could correct by up to -20% from current levels. A formal peace agreement in Ukraine would also remove the geopolitical risk premium that has broadly supported gold prices. Technically, a weekly close below $4,400 would invalidate the long-term bullish structure.
✅ Synthesis & Key Action Levels
Tether Gold (XAUt) is navigating a critical transition zone. Fundamentals have never been stronger (148T of gold, +150% adoption, institutional integration), but macro headwinds are real. Three levels command all professional traders’ attention:
- $4,862.60 (Short-Term Pivot) — Positive reaction + volume = confirmed local floor. Break = opening toward $4,660.
- $4,600–$4,700 (Strategic Accumulation Zone) — Confluence of LT supports and institutional demand. Sweet spot for structural long positioning.
- $5,000 / $5,150 (Resistances to Reclaim) — Close above $5,150 = technical signal that the correction is over and the asset is headed for new highs.
The low-liquidity environment of Lunar New Year demands caution: avoid chasing impulsive bounces and instead use limit orders within identified support zones. Buy-on-Dip strategies remain preferred as long as $4,400 holds.
⚠️ Disclaimer: This article is written for educational and informational purposes only. It does not constitute investment advice, nor a recommendation to buy or sell any financial or crypto asset. Cryptocurrency markets are highly volatile and carry significant risk of capital loss. Always conduct your own research (DYOR) and consult a licensed financial advisor before making any investment decision.