
Tether Gold (XAUT) has just experienced one of the most volatile periods in its history. After reaching an all-time high of 5,597.10 USDT on January 29, 2026, the asset suffered a brutal correction of nearly $450 within minutes, temporarily plunging to 5,100 USDT. This multi-timeframe analysis examines the macroeconomic factors, critical technical levels, and outlook for tokenized gold in a context of global monetary transformation.
The Macroeconomic Context: Confluence of Bullish and Bearish Factors
XAUT’s parabolic ascent in January 2026 reflects the exceptional performance of physical gold, which crossed the symbolic $5,000 per ounce threshold for the first time. This historic rise is driven by several fundamental catalysts that continue to exert their influence on markets.
Tether’s Reserve Strategy: A Paradigm Shift
Tether has executed a major strategic transformation of its balance sheet. The company now holds approximately 140 tons of physical gold (520,089.3 troy ounces) stored in secure facilities in the Swiss Alps, placing the stablecoin issuer among the world’s 30 largest gold holders. XAUT represents over 60% of the gold-backed stablecoin market, with a market capitalization exceeding $4 billion.
This strategy of « replacing paper with metal » is part of a logic of protection against monetary depreciation and offers unprecedented transparency: each XAUT token is backed by one physical troy ounce of gold identifiable by serial number, with a 1:1 ratio, unlike traditional paper gold markets where leverage can reach 100:1.
Geopolitical Tensions and Fed Uncertainty
The January 30 flash crash has its roots in a sudden reversal of market sentiment. Uncertainty surrounding the nomination of the next Federal Reserve chairman, with speculation around Kevin Warsh perceived as more « hawkish, » triggered a Dollar Index (DXY) rebound from 95.5 toward 97.45. A strong dollar traditionally exerts downward pressure on USD-denominated assets.
Simultaneously, a bipartisan agreement avoiding a U.S. government shutdown temporarily reduced the political risk premium. This sudden reduction in uncertainty, coupled with massive profit-taking after a 20% rise in one month, created the conditions for the observed flash crash.

Daily Technical Analysis: An Overheated Bullish Trend
On the daily timeframe, the XAUT chart reveals a parabolic bullish trend validated by a « Golden Cross » where the 50-day moving average crossed above the 200-day. However, oscillator analysis shows alarming warning signals.
Extreme Overbought Indicators
The 14-day Relative Strength Index (RSI) reached levels oscillating between 86 and 95 according to sources, figures not observed for decades. History shows that such RSI levels often precede large-scale corrections, sometimes up to 60% of the parabolic movement’s value.
The daily candle of January 29 formed a violent rejection at the 5,600 USDT level, a major psychological resistance zone where institutional selling algorithms took over. Despite this drop, the market structure remains technically bullish as long as prices maintain above long-term supports.
Critical Technical Levels (Daily)
Resistances:
- 5,600 USDT: All-time high (ATH) and rejection zone. A daily close above would confirm resumption of the parabola toward 6,000 USDT.
- 5,450 USDT: Intermediate resistance, pivot point for bullish recovery.
- 5,359 USDT: Daily pivot calculated for January 30, equilibrium level.
Supports:
- 5,100-5,150 USDT: Immediate support, flash crash low and short moving average.
- 5,000 USDT: Critical psychological threshold, major institutional defense.
- 4,800 USDT: Retracement support, former resistance turned strong support.
- 4,550 USDT: Long-term trend support (200-day MA).
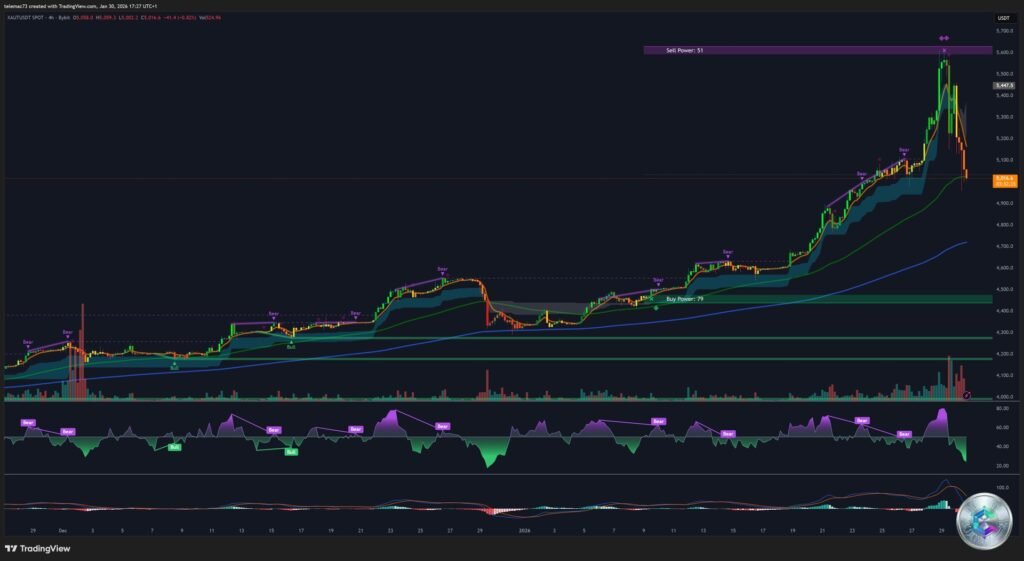
4-Hour Analysis: Corrective Dynamics and Elliott Waves
The 4-hour timeframe offers a more granular view of price distribution. After reaching the peak of 5,597 USDT, XAUT entered a corrective phase resembling a completed wave (v) in a broader Elliott cycle. This correction brought the price back toward the middle zone of the Bollinger Bands.
Capital Flow and Sentiment
Volume analysis shows a significant increase during the descent, suggesting long position capitulation (liquidations) rather than massive structural selling. The MACD indicator crossed below its signal line, confirming that medium-term momentum has turned in favor of sellers.
The price found temporary support around the 50 EMA (50-period exponential moving average), which currently acts as a bulwark against a deeper fall toward 4,900 USDT. Sentiment has shifted from « extreme euphoria » to « cautious fear. » Institutional investors appear to be using the 5,100-5,200 zone to reload their positions.
Volume concentration on Bybit (16% of global volume) suggests that movements on this platform often dictate the direction for the entire XAUT market.
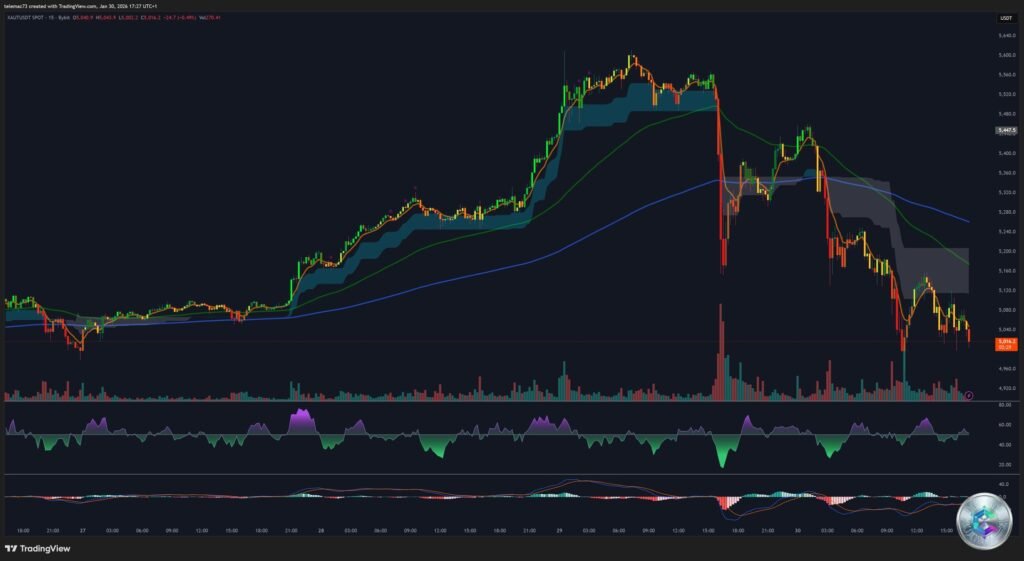
15-Minute Analysis: Anatomy of the Flash Crash
The 15-minute analysis is crucial for dissecting the January 29 collapse. In less than two 15-minute candles, XAUT lost nearly $450 in value. This movement is not due to a sudden deterioration of gold fundamentals, but to a lack of buy-side liquidity at the peaks.
As soon as the first massive sell orders hit the order book, a chain reaction of stop-losses was triggered. The 15m chart now shows a stabilization attempt. The RSI, after plunging into oversold territory (below 30), is gradually climbing back toward 46, indicating neutralization of immediate selling pressure.
Intraday Pivot Points (January 30, 2026)
Pivot points calculated using the standard method (HLC/3) provide a roadmap for active traders:
- R2: 5,842.01 USDT – Extreme selling zone
- R1: 5,606.60 USDT – Peak retest, caution
- PP: 5,359.59 USDT – Direction of the day (Bullish if above)
- S1: 5,124.01 USDT – Reactive buying zone
- S2: 4,877.01 USDT – Major structural support
The price currently oscillates around the midline of the short-term Bollinger Bands, located near 5,140 USDT. A break above 5,200 on this timeframe would be the first sign of a technical rebound toward the daily pivot.
Institutional Outlook for 2026
Despite the late January correction, institutional consensus remains largely bullish for the rest of the year. Several major banks have revised their gold price targets upward, citing central bank diversification and U.S. fiscal uncertainty as enduring drivers.
Banking Forecasts for Gold (2026)
- RBC Capital Markets: $7,100/oz (End 2026)
- UBS: $6,200/oz (Q2 2026)
- Deutsche Bank: $6,000/oz (End 2026)
- Goldman Sachs: $5,400/oz (Considered conservative)
- Morgan Stanley: $4,600-5,700/oz (Base-Bull scenario)
These forecasts suggest that the drop below 5,200 USDT is perceived by analysts as a buying opportunity (buy the dip) rather than the beginning of a bear market. Structural demand, particularly from Tether which continues to purchase one to two tons of gold per week, provides a safety net for prices.
Gold vs Silver vs Bitcoin: Capital Rotation
XAUT’s performance must be put in perspective with that of other precious metals and Bitcoin. In January 2026, silver experienced an even more spectacular rise, reaching $120 per ounce, before suffering a 23% crash on January 30, confirming a widespread liquidation of tangible assets.
As for Bitcoin, it consolidates below $90k after reaching peaks near $125,000 in 2025. The Gold/BTC ratio has begun turning in favor of gold, suggesting capital rotation toward less volatile assets as U.S. recession risks increase. Tokenized gold, via XAUT, benefits from this rotation, attracting capital seeking gold’s security with blockchain liquidity.
Conclusion: A Strategic Entry Point?
Tether Gold (XAUT) has demonstrated in January 2026 its capacity to act as a barometer of global fear and inflation. Although the recent correction was brutal, it fits within a classic market cycle after an irrational euphoria phase characterized by an RSI near 95.
Fundamentals remain exceptionally solid: Tether has established itself as a « private central bank » for gold, storing its reserves in the planet’s most secure vaults, far from direct U.S. jurisdiction. For professional investors, XAUT offers liquidity and portability that physical gold cannot match, while avoiding paper market manipulation risks.
As long as the 5,000 USDT pivot holds, the directional bias remains bullish, driven by structural monetary depreciation and a global quest for security. The current zone of 5,100 USDT appears to offer an attractive entry point for medium-term exposure to what has become the digital era’s quintessential reserve asset.
Traders must closely monitor the nomination of the next Fed chairman, as Washington will provide the next major signal for the dollar, and therefore for XAUT.
Disclaimer: This article is published for educational and informational purposes only. It does not constitute investment advice or a recommendation to buy or sell. Crypto-asset markets are extremely volatile and carry significant risks of capital loss. Always conduct your own research (DYOR) and consult a professional financial advisor before making any investment decision.