
As global markets prepare to reopen for the Asian session this Sunday, March 29, 2026, all eyes are fixed on West Texas Intermediate crude oil (WTI / USOIL), which is testing a critical resistance zone at $101.50 per barrel. A breakout above this level could trigger a parabolic acceleration toward the $120.00 target, against a backdrop of the most significant oil supply disruption in modern history.
Geopolitical Context: Operation Epic Fury and the Hormuz Blockade
The current price dynamics stem from the launch of Operation Epic Fury on February 28, 2026 — a joint U.S.-Israeli military campaign targeting Iranian strategic infrastructure. The initial strikes neutralized a large portion of the Islamic Republic’s air defense capabilities and led to the death of Supreme Leader Ali Khamenei, plunging the Iranian command into radical restructuring.
In direct retaliation, the Islamic Revolutionary Guard Corps (IRGC) officially declared the closure of the Strait of Hormuz on March 4, 2026. This maritime chokepoint, through which approximately 20 million barrels per day — roughly 20% of global liquid petroleum consumption — normally flows, has become the world economy’s primary bottleneck. The immediate impact translated into a net loss of more than 10 million barrels per day from international markets.
| Market Parameter | Pre-Conflict Level | Situation as of March 29, 2026 | Impact |
|---|---|---|---|
| Daily Hormuz Flows | 20.0 mb/d | < 2.0 mb/d (estimated) | -90% |
| Regional Production Deficit | 0.0 mb/d | > 10.0 mb/d | Critical |
| Geopolitical Risk Premium | $2–5 | $18.00 | +260% |
| OECD Inventories | 5-year average | -180 million barrels | Alert |
Beyond the physical blockade, the mass withdrawal of maritime insurers from any cargo transiting the Persian Gulf has created an insurmountable financial bottleneck. Iranian drone strikes also hit Saudi Aramco’s largest refinery, while QatarEnergy’s LNG facilities at Ras Laffan suffered damage reducing capacity by 17%. Even in the event of an immediate ceasefire, a return to normal supply could take three to five years.
Macroeconomic Analysis: A Structural Supply Imbalance
The International Energy Agency (IEA) has described the current situation as the « greatest energy security challenge in history. » Despite authorizing a massive release of 400 million barrels from Strategic Petroleum Reserves (SPR), analysts at BNY and Macquarie estimate that a mere ten additional days of Strait closure would completely neutralize this measure.
On the OPEC+ side, eight key member states — including Russia and Saudi Arabia — maintained their production quotas unchanged through March 2026. The Gulf producers’ inability to route their crude to market creates a gap that U.S. shale producers cannot fill instantaneously: Enverus Intelligence Research projects U.S. supply growth of only 370,000 barrels per day by end-2026 — a negligible volume against the global deficit.
Systemic consequences are already materializing: aviation sector distress, critical fuel shortages in Pakistan, Vietnam and the Philippines, and for India — which imports 87% of its crude — sustained prices above $110 could shave a full percentage point off GDP growth while pushing inflation to unsustainable levels.
Technical Analysis: WTI Price Structure
Technically, USOIL is displaying a major breakout configuration. After reaching a panic high near $120 at the outbreak of conflict, prices corrected to the $87–90 zone, corresponding to the 0.618 Fibonacci retracement of the initial impulsive wave — a high-quality support level.
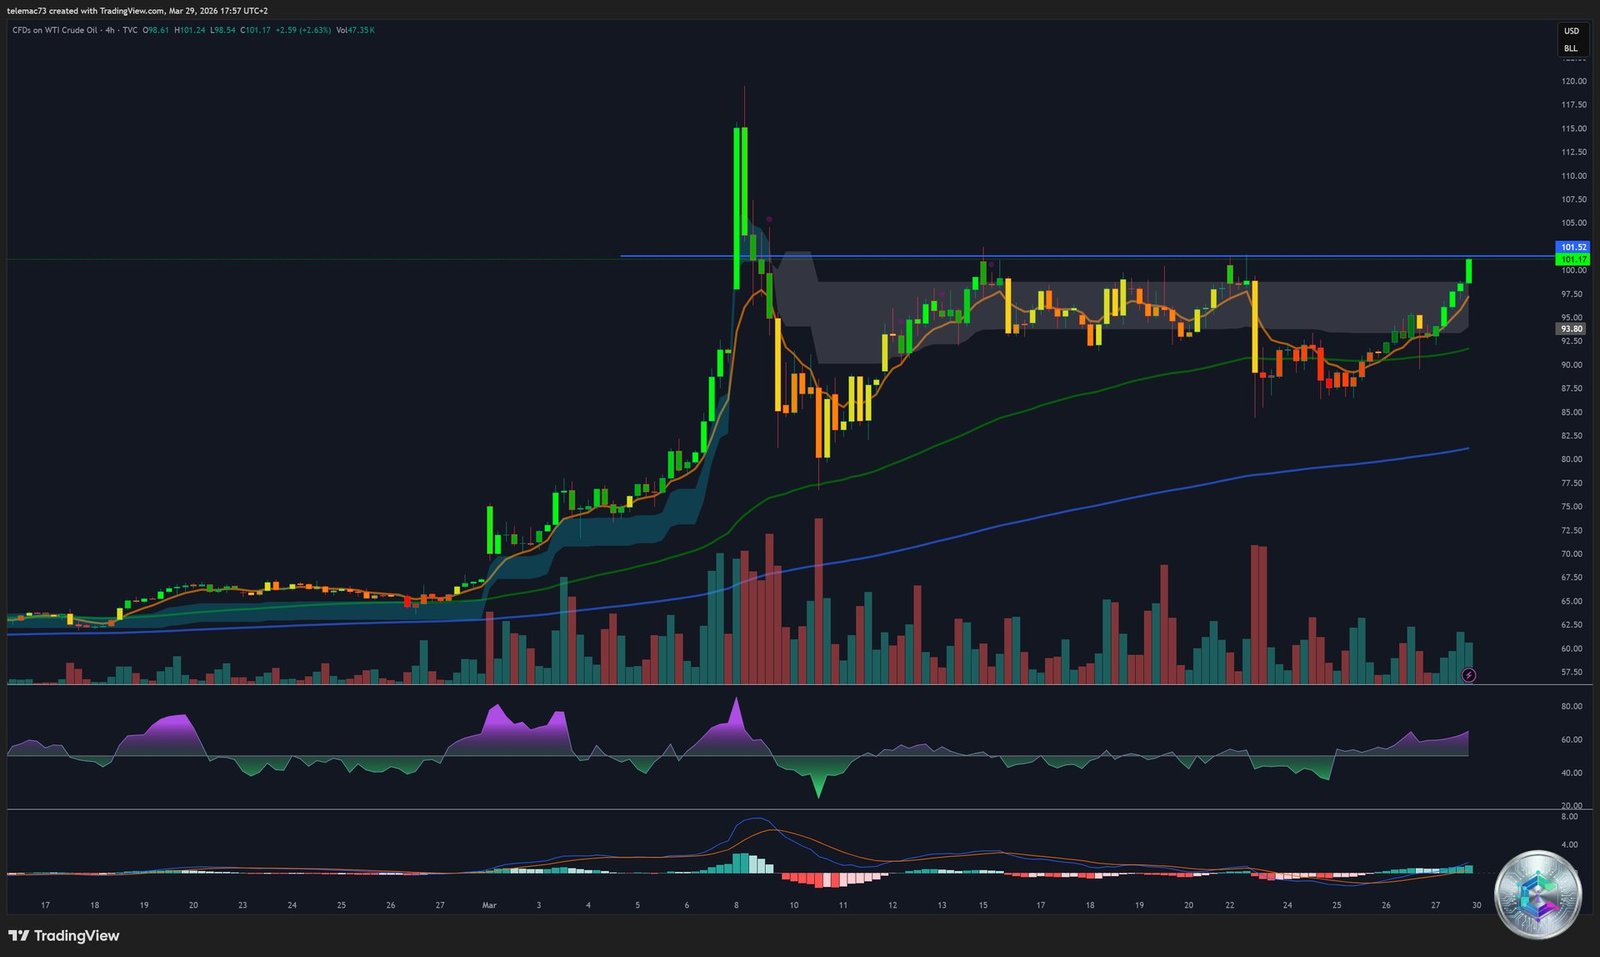
Key Technical Levels
| Level | Price (USD) | Strategic Role |
|---|---|---|
| 🎯 Final Target | $120.00 | 2022 high — major liquidity zone |
| ⚠️ Intermediate Resistance | $111.00–$113.00 | March 9 highs — supply zone |
| 🔑 Breakout Pivot | $101.50 | Critical bullish confirmation threshold |
| 📍 Dynamic Support | $95.85 | Current session pivot point |
| 📐 Fibonacci 61.8% Support | $88.28 | Deep correction support |
| ❌ Bullish Invalidation | $75.60 | Major Elliott pivot — alternative scenario |
Momentum Oscillators and Indicators
- RSI (14): Currently ~68.67 on the daily timeframe, approaching overbought territory (70) with no bearish divergence — buying pressure remains dominant.
- MACD (12,26): Clear buy signal above the zero line. The OsMA histogram is beginning to plateau — typical of consolidation before the next impulse leg.
- Moving Averages: Price is trading above all key MAs (20, 50, 100, 200-day), all sloping upward. The EMA50 is serving as a robust dynamic support.
- ADX: Exceeding 80 on certain high-frequency analyses — an exceptionally strong trend reading, rarely observed in commodity markets.
The Liquidity Vacuum: The Catalyst for a Run to $120
The hypothesis of a rapid surge rests on the concept of the Fair Value Gap (FVG). Between $102 and $115, the historical volume profile shows very few consolidated transactions. Once the $101.50 barrier is broken, there are virtually no technical obstacles in the form of massive sell orders before the 2022 highs. The path to $120 would essentially be clear.
Elliott Wave Analysis: Wave (iii) Underway
According to Elliott Wave analysis, USOIL has completed its corrective wave (ii) and is now entering wave (iii) — traditionally the most extended and fastest wave. Consolidation above the $75.60 pivot has validated the long-term bullish scenario. Fibonacci extensions project a target zone between $126 and $150 if current momentum is maintained. Key risk to monitor: the $119–120 level has already acted as a massive rejection zone on March 7 and 19, forming a potential double top structure if price fails to clear it on strong volume.
Weekend Context: Catalysts for the Reopening
Several developments over the weekend will shape the Asian session open:
| Event | Signal | Expected Impact |
|---|---|---|
| 10 tankers passage through Hormuz | Moderately bearish | Limited profit-taking |
| Threat of U.S. ground operation | Strongly bullish | Elevated risk premium |
| Record on-chain volumes ($1.2B) | Bullish | Confirms underlying demand |
| Trump April 6 deadline | Neutral/Bullish | Extended uncertainty |
Brent crude has already breached $110, reaching $112.57 on March 27 (+44.80% month-over-month). WTI was trading at $99.64 (+32.90% YTD). Reduced Russian exports to Europe combined with the Hormuz blockade are redirecting demand toward American crude, potentially narrowing the WTI/Brent spread and accelerating the move toward $120.
Scenarios and Risk Factors
Bullish Scenario (Base Case)
A bullish gap open above $101.50 would confirm the continuation of Elliott’s impulsive wave toward $120. As long as the Strait of Hormuz remains largely closed and no diplomatic agreement is reached, upward pressure remains the central scenario for the remainder of the quarter.
Bearish Scenario (Alternative)
A peace deal providing for the secure reopening of the Strait could instantly evaporate the estimated $18 geopolitical risk premium, sending WTI back toward $75–80. A more aggressive coordinated G7 reserve release including refined products (diesel) could also cap prices below $100 in the near term.
Conclusion
USOIL approaches this reopening session in a state of extreme tension. The technical picture is unambiguous: $101.50 represents the last line of defense before a low-liquidity zone extending to $120. The fundamentals — structural supply deficit, military escalation, and infrastructure destruction — support a bullish bias for the remainder of the quarter. The next few hours will be decisive.
⚠️ Disclaimer: This article is written exclusively for educational and informational purposes. It does not constitute investment advice, a recommendation to buy or sell any financial asset. Financial markets involve the risk of capital loss. Please consult a qualified financial advisor before making any investment decision.