
Strategic and Technical Analysis of the Solana (SOL) Ecosystem
The dynamics of the digital asset market in early 2026 traverse an unprecedented structural reconfiguration phase, placing the Solana protocol at the center of a complex debate between technical depreciation and fundamental expansion. On February 4, 2026, the decentralized financial ecosystem observes with sustained attention the breakdown of the major $100 support level, a threshold that has served as a psychological and institutional anchor throughout much of the previous year.
Macroeconomic Context and Market Sentiment
The recent collapse in Solana prices does not occur in a vacuum but results from a convergence of systemic pressures affecting the entire risk asset class. Global sentiment, measured by the Crypto Fear & Greed index, has plunged into « extreme fear » territory with readings oscillating between 14 and 20, reflecting massive disengagement from retail operators.
The Impact of Monetary Policy and Geopolitics
The primary catalyst for this risk aversion lies in the American macroeconomic sphere. The nomination of Kevin Warsh as Federal Reserve president, perceived by markets as a decidedly hawkish pivot, has triggered a brutal surge in the US dollar and bond yields. This prospect of prolonged monetary tightening has driven capital outflows from volatile assets. In this context, Bitcoin has crashed below $75,000, hitting fifteen-month lows, which has exerted irresistible downward pressure on high-capitalization altcoins like Solana.
| Macroeconomic Indicator | Value / Status (Feb 2026) | Impact on SOL |
|---|---|---|
| Fear & Greed Index | 14 – 20 (Extreme Fear) | Limited bounce capacity due to pessimism |
| Bitcoin Dominance | 57.3 % | Capital migration toward relative safety |
| Total Capitalization | 2.54 – 2.65 Billions $ | Global liquidity contraction |
| Funding Rate | Negative (-0.0080 %) | Predominance of short positions |
Institutional Flows and ETF Dynamics
Institutional interest, which had been the engine of 2025 gains, shows signs of temporary fatigue. For the first time since their introduction, Solana-based investment products have recorded significant net outflows totaling $31.7 million in a single week. Spot ETFs have also experienced their first weekly redemptions, totaling $2.45 million.
However, it is crucial to note that this trend is not uniform. The Bitwise BSOL ETF continues to capture the majority of residual net inflows, suggesting that sophisticated investors are rotating internally toward more stable vehicles rather than a complete withdrawal from the network.
In-Depth Technical Analysis of SOL/USDT
Analysis of the provided charts (daily, 4-hour, 15-minute) allows visualization of the price structure degradation and emergence of critical control points.
Daily Chart Study (1D): The End of the $100 Anchor
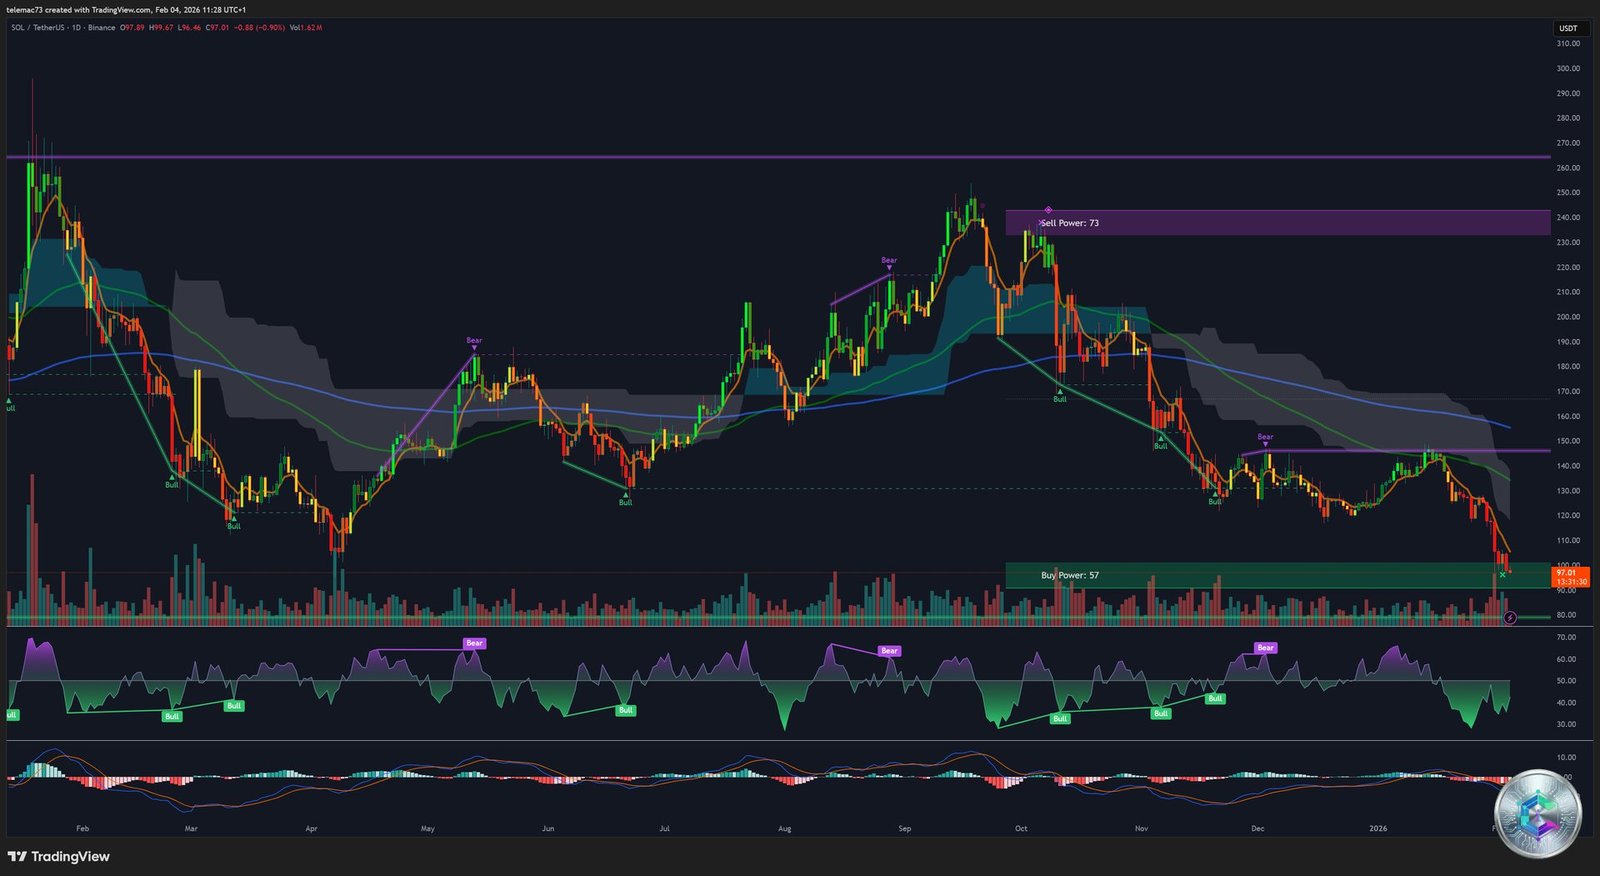
On the daily timeframe, the breakdown of the $100 support marks a transition from a consolidation phase to an aggressive distribution phase. This level, termed the « Liberation Day » support, had historically attracted strong demand. Closing below this threshold has transformed what was an accumulation zone into a major psychological resistance.
Price reached a ten-month low at $96.43, testing buyer resilience in the demand zone between $95 and $98. Technical indicators confirm the intensity of selling pressure:
- Daily RSI: Plunged toward 25, entering extreme oversold territory. While this may signal seller exhaustion, in a strong downtrend, RSI can remain oversold for extended periods.
- MACD: Displays persistent bearish crossover since January 19, with red histogram bars widening, indicating the downside momentum has not yet stabilized.
- Moving Averages: The 50 and 200-day EMAs now sit well above price, acting as structural ceilings. The 50-EMA is around $128, reinforcing the January resistance zone.
4-Hour Chart Analysis (4H): V-Shape Bounce Attempt
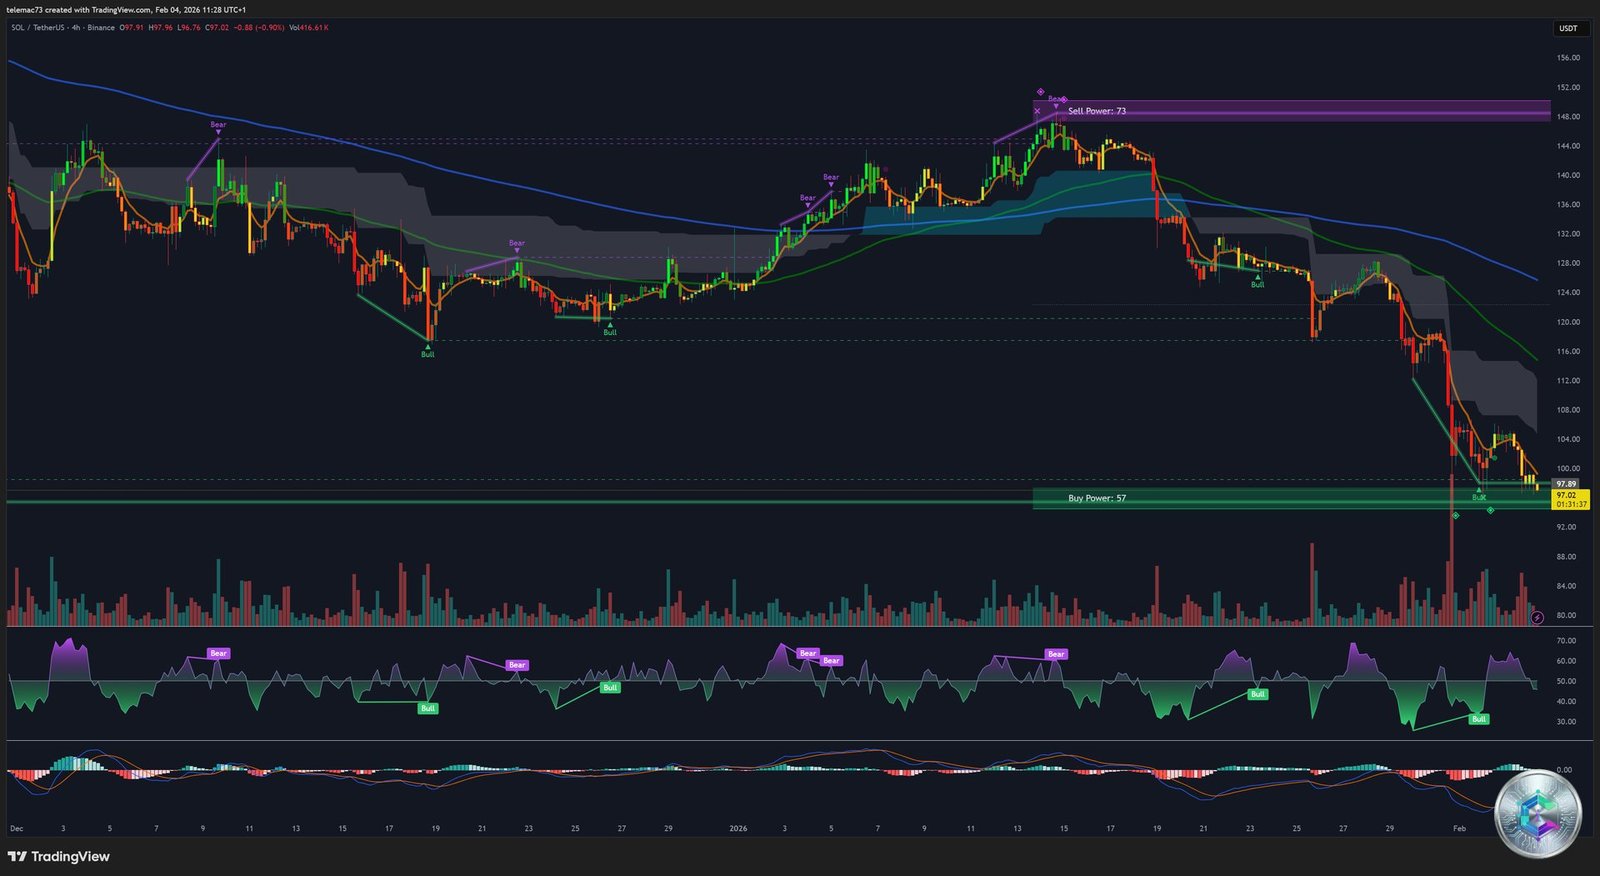
The 4-hour chart offers a more nuanced perspective, showing immediate buyer reaction after the wick below $100. A potential « V » shaped recovery structure is beginning to form. The RSI on this timeframe has risen from 18 to 36, suggesting that scalpers and opportunistic investors are beginning to intervene.
However, this recovery attempt faces immediate obstacles. The confluence zone between $106 and $107 must be reclaimed to invalidate the immediate bearish bias. Failure to break this level could result in a « Lower High » formation, confirming the continuation of the trend toward macroeconomic supports.
15-Minute Chart Analysis (15m): Microstructure and Liquidity
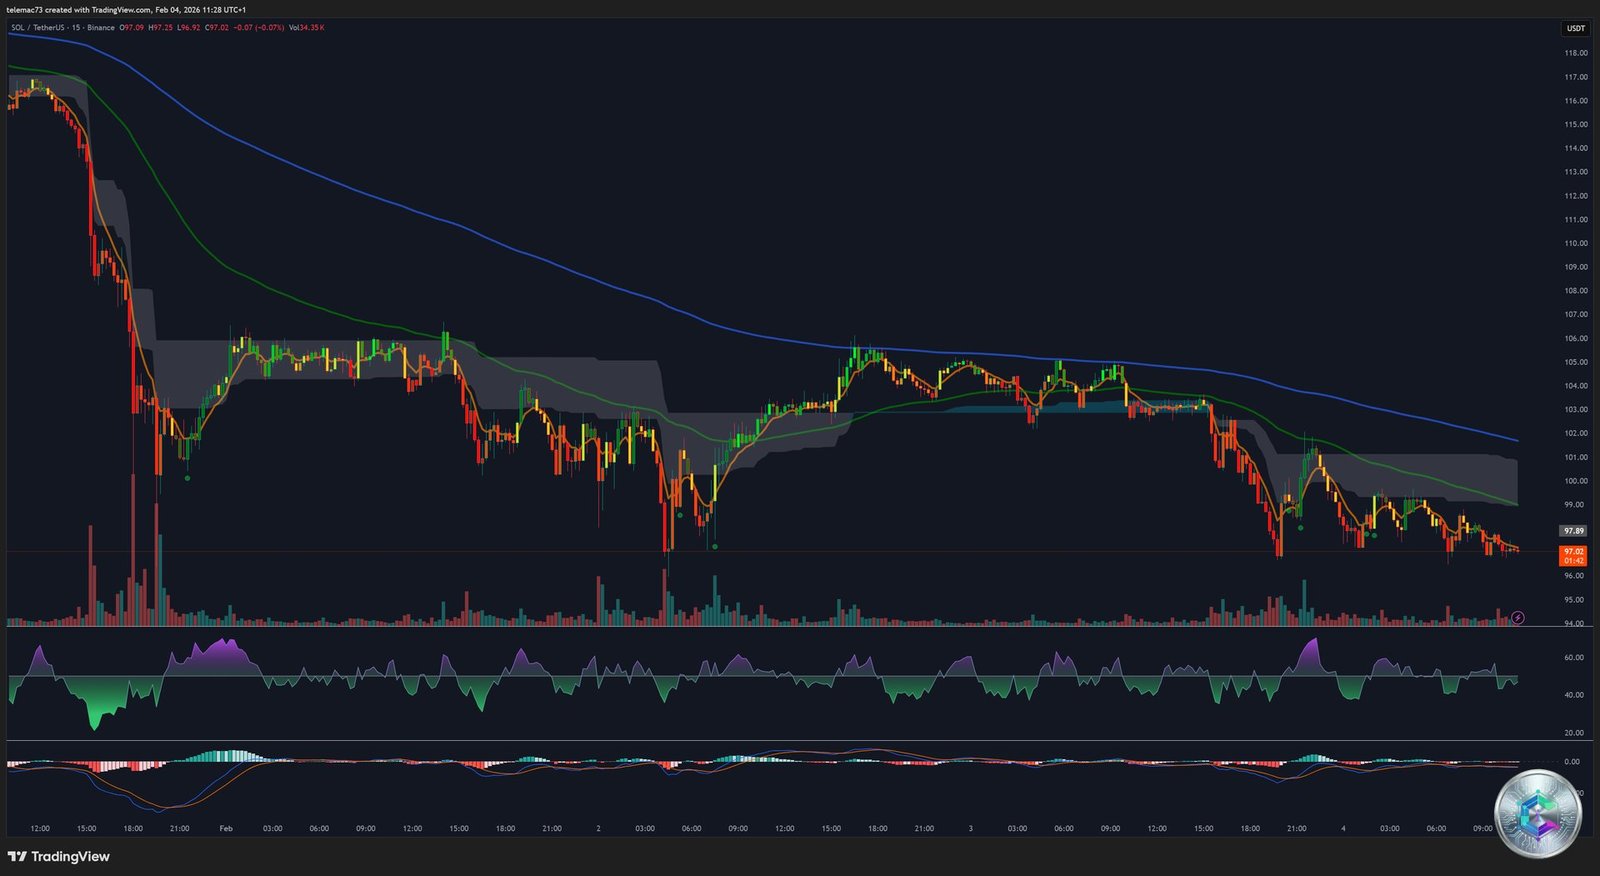
On the fifteen-minute timeframe, we observe intense intraday volatility. Price movements are characterized by « liquidity sweeps » where price hits stop-loss orders below recent lows before bouncing. The creation of a « breaker block » and « Bullish Change of Character » (CHoCH) on this timeframe signals that buy algorithms are beginning to activate around $102. Maintaining the local pivot zone at $101.94 is essential to preserve bounce momentum toward higher resistances.
Identification of Support, Resistance, and Pivot Levels
Precision in identifying price levels is critical for risk management during high volatility. Data from Fibonacci pivots and historical structure provide the following framework:
Fibonacci Pivot Points (SOL/USD Base)
Using Fibonacci mathematics allows isolation of probable reaction levels based on previous volatility:
| Level | Price ($) | Significance |
|---|---|---|
| Resistance 3 (R3) | 99.416 | Probable rejection zone on weak bounce |
| Resistance 2 (R2) | 98.843 | Former support turned technical barrier |
| Resistance 1 (R1) | 98.488 | First strength test for buyers |
| Pivot Point (PP) | 97.915 | Intraday sentiment rotation axis |
| Support 1 (S1) | 97.342 | Immediate defense zone |
| Support 2 (S2) | 96.987 | Intraday capitulation threshold |
| Support 3 (S3) | 96.414 | February wick floor |
Major Structural Support and Resistance
Beyond algorithmic pivots, the long-term market structure defines crucial battle zones for the weeks ahead.
Support Levels:
- $92 – $95: Historical demand zone and liquidity cluster. This is where long-term investors (HODLers) tend to reinforce positions.
- $80 – $85: Major macroeconomic floor corresponding to the 2022 pivot. A break of this level would radically change Solana’s bullish thesis for 2026.
- $76: Ultimate support identified on the 4H chart as the last bastion before prolonged « crypto winter » entry.
Resistance Levels:
- $107 – $110: Short-term trend pivot. Transforming this zone into support is the sine qua non condition for a relief rally.
- $113 – $118: Major « Supply » zone where short position liquidations concentrate. Breaking this level could trigger a massive « Short Squeeze ».
- $125 – $130: Base of 2026 resistance, including the 50-EMA and 50-SMA. This is the level Solana must reclaim to restore a bullish market structure.
Order Flow Analysis and Liquidation Heatmap

The liquidation heatmap is an essential predictive tool as it visualizes zones where trader leverage is most vulnerable. The crypto market tends to move toward high liquidity zones to « clean » overleveraged positions before choosing a sustainable direction.
Dynamics of « Short Squeeze » vs « Long Flush »
Observation of early February 2026 heatmap indicates a fascinating asymmetry. After the drop below $100, a considerable mass of traders opened short positions, betting on continued decline.
- Short Squeeze Potential: If Solana rebounds above $113, approximately $500 million in short positions would be liquidated. This forced repurchase would create artificial buying pressure, capable of propelling price toward $120 in record time.
- Long Flush Risk: Conversely, if the $95 support fails, remaining long positions would suffer over $142 million in additional liquidations, likely triggering a flash crash toward $80.
Sentiment on Derivatives Markets
Coinglass data reinforces the hypothesis of ongoing capitulation. The Long/Short ratio has fallen to 0.97, meaning more bearish bettors than bullish ones. Additionally, the negative funding rate indicates that short sellers are willing to pay fees to maintain their bearish bets—a sign of extreme pessimism that often precedes violent trend reversals. Open Interest is declining, suggesting traders are closing positions from fear rather than strategy, typical behavior at local cycle bottoms.
Network Fundamental Health: The Price/Usage Decoupling
The most paradoxical element of this analysis lies in the stark contrast between Solana’s market performance and its on-chain operational growth. While the token loses value, the network has never been more active.
Record Utilization Metrics
The Solana network reached historic peaks in February 2026, proving the protocol’s utility detaches from token price speculation:
- Total Value Locked (TVL): Reached a record of 73.4 million SOL, approximately $7.5 billion at current rates. This represents 18% growth in one week, signaling users aren’t withdrawing funds from the ecosystem despite price decline.
- Decentralized Exchange (DEX) Volume: Daily volume hit an eight-month peak of 51.3 million SOL. On a weekly basis, Solana DEX volume reached its highest level in twelve months at 264.8 million SOL.
- Active Addresses: Daily active users jumped 115% by late January, driven by growing adoption of payment services and decentralized finance.
The Micropayments and Stablecoin Velocity Thesis
Solana is pivoting from its « meme coin casino » image toward that of a global payment infrastructure. The stablecoin velocity (rotation speed) on Solana now far exceeds Ethereum’s. The recent issuance of $750 million in USDC by Circle on the Solana network is formal proof.
This adoption is facilitated by ultra-low transaction costs, making micropayments economically viable. Standard Chartered emphasizes that Solana is the only blockchain capable of supporting real-time payment interactions for artificial intelligence (AI) agents, a sector that should generate massive SOL demand for gas fees in coming years.
| On-Chain Metric | Value (Feb 2026) | Growth / Trend |
|---|---|---|
| Total Value Locked (TVL) | 73.4 M SOL | + 18 % weekly |
| Weekly DEX Volume | 264.8 M SOL | 12-month record |
| Daily Transactions | 109.5 Million | 2-year peak |
| USDC Issuance (Circle) | 750 Million $ | Liquidity expansion |
Technological Perspectives: The Alpenglow Upgrade
A major fundamental catalyst expected for Q1 2026 is the « Alpenglow » upgrade. This technical evolution aims to reduce transaction finality time to just 150 milliseconds.
This advancement is not merely a performance improvement; it radically changes Solana’s value proposition versus competitors like Ethereum or Layer-2s (Base, Arbitrum). A 150ms finality enables:
- Decentralized exchanges (DEX) with user experience identical to centralized platforms (CEX).
- Orbital data server networks and decentralized data centers (as envisioned by xAI and SpaceX).
- Perfect synchronization for in-store payment systems, eliminating checkout wait times.
This technological superiority forms the foundation for long-term bullish predictions from investment banks.
Institutional Forecasts and Price Targets (2026-2030)
Despite current turmoil, institutional analysts maintain an ambitious perspective for Solana while adjusting short-term targets to reflect market reality.
The Standard Chartered Report
Geoffrey Kendrick, head of research at Standard Chartered, revised his forecasts in a report dated February 3, 2026. While he lowered the 2026 target, he raised long-term targets.
Kendrick Price Scenario (Standard Chartered):- End of 2026: $250 (revised from $310). Kendrick forecasts underperformance relative to Ethereum until 2027 as new use cases materialize.
- 2027: $400
- 2028: $700
- 2029: $1,200
- 2030: $2,000
This forecast rests on the idea that Solana will become the dominant network for small-value financial transactions, a market that traditional processors like JPMorgan (handling 6,000 transactions per second) cannot efficiently serve due to cost structures.
Other Expert Perspectives
- Backpack Exchange: Forecasts a range between $150-$260 by year-end, driven by increased network reliability.
- V-Shape Analysis (Cointelegraph): If the current V-structure confirms, a near-term target of $150 is conceivable, representing a 44% gain from current levels.
- « Crypto Winter » Scenario: Conversely, more cautious analysts on Investing.com suggest a return to $35 is possible if global macroeconomic conditions continue deteriorating.
Analytical Synthesis: « It Broke Its Big Support at $100 and Now? »
The $100 support breakdown is a major technical event, but should be interpreted as a « liquidity hunt » rather than a cycle end. The price reaction after the $96 wick shows that institutional and algorithmic demand remains present in the value zone.
Recovery Scenario (Bullish)
To validate a trend reversal, Solana must pass through these stages:
- Reclaim $102 – $104: Transform the immediate pivot resistance into base support.
- Break the $107 trend pivot: This level would invalidate the immediate downtrend structure.
- Short Squeeze toward $115 – $118: Activation of short liquidations would provide fuel for a rally toward $125.
Bearish Continuation Scenario (Risk)
Real danger persists if these conditions continue:
- Failure at $107: If each bounce is sold, price will eventually exhaust buyers at $100.
- Break below $95: A daily close under this level would open the door to a crash toward the $80-$86 zone, triggering another wave of long position liquidations.
- Massive ETF Outflows: If institutions continue withdrawing over multiple consecutive weeks, structural selling pressure will be difficult for retail buyers to absorb.
Conclusions and Strategic Recommendations
February 2026’s Solana analysis reveals an asset in full mutation. The $100 breakdown has purged excess optimism and leverage, creating what many analysts call a « generational buy signal » for those believing in technology fundamentals.
From a professional standpoint, the recommended strategy centers on patience and confirmation:
- For Accumulation: The $92-$100 zone represents significant technological value. Progressive accumulation (DCA) in this zone seems judicious given the decoupling between network usage (at all-time high) and price (ten-month low).
- For Trading: It is imperative to await confirmed daily close above $107 to engage in directional long positions. Current volatility favors « mean reversion » strategies rather than pure trend-following.
- Risk Management: A safety stop-loss below $90 is essential, as a break of this level would signal a macroeconomic paradigm shift toward prolonged bear market.
In conclusion, Solana remains the most credible alternative to Ethereum, with real adoption now exceeding mere speculation. The « February Storm » appears to be the final resilience test before a recovery phase driven by the Alpenglow upgrade and maturation of payment use cases. The $100 breakdown, while frightening to neophytes, is technically a necessary event for building a solid foundation toward the ambitious $250 target for year-end 2026.
⚠️ Educational Disclaimer
This article is provided for educational and analytical purposes only. It does not constitute financial advice, investment recommendation, or inducement to buy or sell digital assets. The technical and fundamental analyses presented reflect market conditions at publication (February 2026) and may rapidly become obsolete. Cryptocurrency markets are extremely volatile and carry significant risks, including total loss of invested capital. Before making any investment decision, consult a qualified financial advisor and conduct thorough independent research. The authors are not responsible for losses or damages resulting from the information contained in this article.