
The cryptocurrency market is currently experiencing a major phase of turbulence, and Ethereum (ETH) is no exception to this dynamic. As of January 30, 2026, the asset is trading around $2,700, marking a significant decline of nearly 4% over 24 hours. This correction follows an attempted stabilization above the psychological threshold of $2,900, ending a three-day consecutive upward streak.
Technical Correction Amplified by Macroeconomic Factors
Ethereum’s current decline cannot be dissociated from the global macroeconomic context. The announcement of Kevin Warsh’s potential nomination as Chair of the U.S. Federal Reserve triggered a widespread « risk-off » movement across markets. Perceived as a « hawkish » profile unfavorable to crypto assets, this leadership change propelled the U.S. Dollar Index (USDIDX) up by 1.06%, exerting mechanical downward pressure on all growth assets.
Market data reveals a 5.47% depreciation since the beginning of the month, a performance significantly lower than the historic peak of $4,955.23 reached on August 24, 2025. The 7-day realized volatility reaches 67.2%, a level considerably higher than Bitcoin’s (43.5%), testifying to the intensity of current movements.
Multi-Timeframe Technical Analysis: Structure Under Pressure
15-Minute Chart: Liquidity Cascade
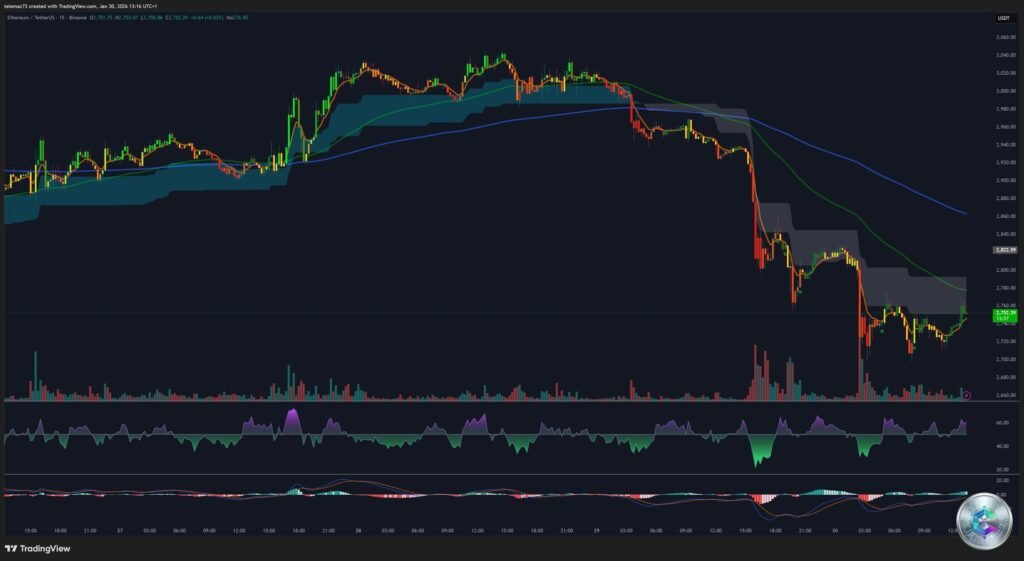
The 15-minute timeframe illustrates a brutal drop qualified as a « waterfall, » from the $2,814 level to the immediate support at $2,700. This movement was accompanied by an explosion in volumes, a sign of short-term capitulation of leveraged positions. Exponential moving averages (EMA) crossed downward, confirming the strength of the selling impulse.
The MACD indicator shows an acceleration of the negative histogram without immediate signs of bullish divergence, suggesting the bottom may not yet be consolidated. The order book depth over 100 basis points fell by 5.2%, indicating a withdrawal of liquidity by market makers in anticipation of increased volatility.
4-Hour Chart: Key Pivot Breakdown

On the 4-hour chart, the degradation is more structural. The price broke down through the previously identified support zone around $2,823. The RSI indicator displays marked bearish divergence zones, while the MACD crossed below its signal line.
A massive « Sell Power » zone is identified between $3,350 and $3,440, a level that now seems out of reach in the short term without a major catalyst. The session’s central pivot is at $2,800. Sustained maintenance below this level invalidates scenarios of immediate recovery toward $3,100, the « max pain » level identified in the options market.
Daily Chart: Consolidation in a Wider Range
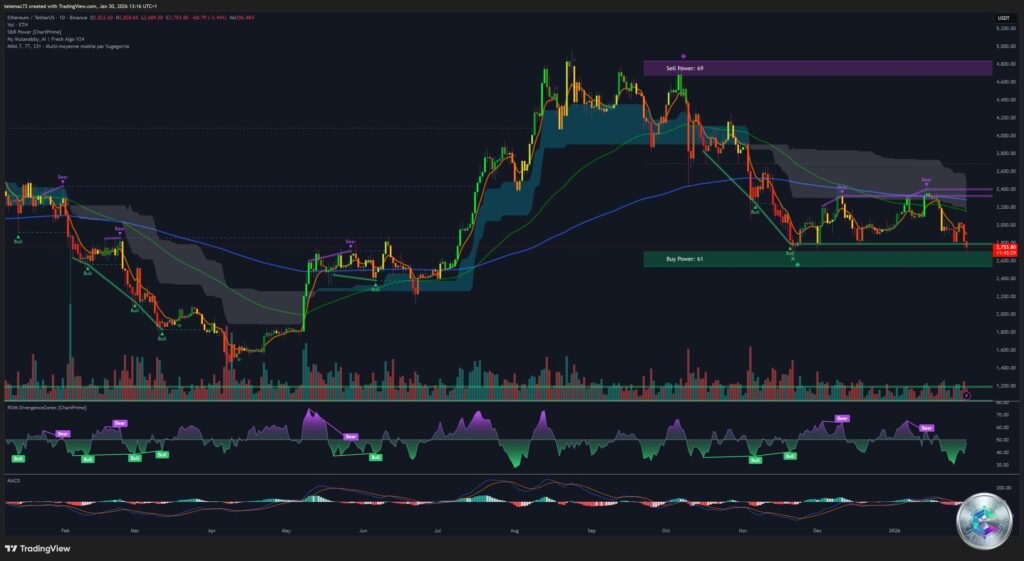
The daily chart places the current decline within a broader consolidation context that began in early 2026. ETH is navigating in a range between $2,700 and $3,100. The January 30 candle is particularly aggressive, erasing the previous week’s gains and testing the lower limit of this consolidation channel.
A major macroeconomic support sits around $2,400 – $2,500, a level corresponding to a historical accumulation zone observed in 2025. Analysts note that if market conditions continue to deteriorate, a pullback toward the $1,800 – $2,000 zone could not be excluded in a prolonged bearish market scenario.
Liquidity Mapping: Critical Zones Identified

The Heatmap analysis reveals crucial friction zones where the price is likely to react strongly. A significant concentration of buy orders (green zones) appears just below $2,600, forming a substantial liquidity barrier. This zone represents an institutional liquidity cluster detected in deep order books.
Conversely, a major psychological barrier sits between $3,000 and $3,100, corresponding to the « max pain » point of current options. This zone concentrates strong resistance with moderate to high intensity of sell orders, making any immediate bullish breakthrough difficult without a significant fundamental catalyst.
Ethereum ETFs: Disappointing January Performance
January 2026 has been marked by a stark dichotomy between the resounding success of Bitcoin ETFs and the difficulties encountered by Ethereum ETFs. While Bitcoin products attracted more than $2.3 billion in January, flows toward Ethereum remained fragile and often negative.
BlackRock’s ETF (ETHA) recorded a net outflow of 19,644 ETH on January 29, approximately $55.22 million, despite robust trading volume of $1.2 billion. On January 23, net outflows already stood at $41.74 million, marking the fourth consecutive day of outflows.
This underperformance is explained by several factors: Ethereum’s intrinsic complexity (smart contracts, frequent updates), the absence of an integrated staking mechanism in ETFs, and high fees applied by certain issuers like Grayscale’s ETHE trust.
Signs of Institutional Accumulation Despite the Decline
Despite massive ETF outflows, some signs of stabilization emerged on January 28 with a modest net inflow of $28.1 million. More significantly, on-chain data reveals that « whales » are taking advantage of the decline to accumulate. One wallet notably acquired 29,665 ETH, while another withdrew 3,207 ETH from an exchange platform to stake them.
Long positions on Bitfinex reached a seven-month high, suggesting the most informed investors are betting on a medium-term rebound from current levels. The total amount of staked ETH reached a record 36.5 million ETH, over 30% of total supply, locking up supply and limiting potential long-term selling pressure.
Fundamental Catalysts: Fidelity and 2026 Upgrades
Beyond price action, Ethereum network fundamentals continue to strengthen. Fidelity, an asset manager weighing $5.9 trillion, announced the creation of its own stablecoin, FIDD, on the Ethereum network. This technical choice is far from trivial: Ethereum currently controls 56% of the stablecoin market and dominates the real-world assets (RWA) sector with 60% of total value locked.
FIDD’s arrival should inject massive liquidity onto the chain, increase daily transaction volume already approaching the historical record of 2.8 million, and accelerate the « supply squeeze » mechanism with more burned fees potentially reducing the total ETH supply in circulation.
2026 Roadmap: Glamsterdam and Heze-Bogota
Ethereum is preparing for a major technological transformation in 2026, with two « hard forks » planned to radically increase network capacity:
- Glamsterdam (mid-2026): Introduction of parallel transaction processing, propelling theoretical throughput from 21 TPS to over 10,000 TPS. Increasing the Gas Limit to 200 million per block will accommodate much more data, drastically reducing Layer 1 fees.
- Heze-Bogota (end 2026): Strengthening censorship resistance via Fork Choice Inclusion Lists (FOCIL), guaranteeing no central entity can arbitrarily block transactions. The goal is to achieve « provable 128-bit security » making the network invulnerable to next-generation attacks.
Outlook and Scenarios for Coming Weeks
Multi-timeframe technical analysis suggests the current period between $2,600 and $2,800 represents a strategic consolidation zone. Key levels to monitor are:
- Immediate support: $2,700 – $2,725 (current technical rebound zone)
- Major support: $2,600 (institutional liquidity cluster)
- Central pivot: $2,800 (equilibrium point between buyers and sellers)
- Moderate resistance: $2,900 – $2,950 (recent rejection point)
- Strong resistance: $3,000 – $3,100 (psychological barrier and « max pain » zone)
The derivatives market shows interesting positioning with positive funding rates at +0.37% (approximately 50% annualized APR), indicating long position holders continue to pay a premium to maintain their positions. The long/short ratio has widened to 2.82x on ETH, confirming traders are betting on an imminent technical rebound.
The risk of additional decline toward $2,200 should not be neglected if the dollar continues its unbridled run. Nevertheless, the convergence of technological developments planned for mid-2026 and increasing involvement of mega asset managers suggests the foundations of a new major bull cycle are being laid.
Conclusion: Short-Term Storm, Solid Fundamentals
The in-depth analysis of Ethereum as of January 30, 2026 reveals a situation of tension between short-term macroeconomic pressure and exceptionally solid technological and institutional fundamentals. Kevin Warsh’s potential nomination to the Fed constitutes the main current headwind, strengthening the dollar and weighing on capital flows toward digital assets.
However, this pressure seems to be offset in the long term by massive institutional adoption illustrated by Fidelity’s FIDD stablecoin and the record staking of 36.5 million ETH. The 2026 technological roadmap is the most ambitious in the network’s history, with Glamsterdam and Heze-Bogota upgrades promising to finally solve the scalability problem.
For investors and analysts, close monitoring of the $2,800 pivot and official White House announcements regarding the Fed will be crucial to anticipate the asset’s next directional movement.
Disclaimer: This article is provided for educational and informational purposes only. It does not constitute investment, financial, or trading advice in any way. Cryptocurrency markets are extremely volatile and carry significant risks. Any investment decision should be made after consulting with a qualified financial advisor and according to your personal situation. The author and cryptoinfo.ch disclaim any responsibility for financial losses arising from the use of information contained in this article.