
The Ethereum (ETH) market is currently navigating a critical transition phase, marked by a convergence of global macroeconomic factors, institutional restructuring, and major protocol upgrades. As of February 16, 2026, the asset is trading in a strategic decision zone around $1,977, reflecting a fragile balance between speculative capitulation and long-term fundamental accumulation.
🌐 Macroeconomic Landscape and Market Psychology
The global digital asset environment in early 2026 is characterized by an « Extreme Fear » regime, with the Fear & Greed index oscillating between 9 and 12 out of 100. This sentiment is exacerbated by persistent macroeconomic pressures tied to global interest rate trajectories. While recent U.S. CPI data shows signs of deceleration — pulling short-term Treasury yields toward their lowest levels since 2022 — the cryptocurrency sector remains on the defensive.
Ethereum is experiencing a broader narrative crisis, hovering around the psychological $2,000 threshold. The asset has shed approximately 60% of its value from its all-time high reached in August 2025, yet on-chain indicators suggest unprecedented structural resilience. The staking rate has hit a record 30.5%, locking over 36 million ETH and drastically reducing liquid supply on exchanges.
| Market Indicator | Current Value |
|---|---|
| Reference Price (ETH/USDT) | $1,977.11 – $1,979.54 |
| Fear & Greed Index | 9 – 12 (Extreme Fear) |
| Global Staking Rate | 30.5% (Historic Record) |
| Market Capitalization | ~$238B – $253B |
| 30-Day Volatility | 16.15% |
| Ethereum Dominance | 10.1% |
📅 Daily Chart Analysis (1D): The Long-Term Framework
The daily chart reveals a dominant bearish trend initiated after the massive rejection from the $4,000–$4,400 zone during the previous cycle. The price is trading below a cloud of exponential moving averages (EMAs), confirming the absence of bullish momentum in the short to medium term.
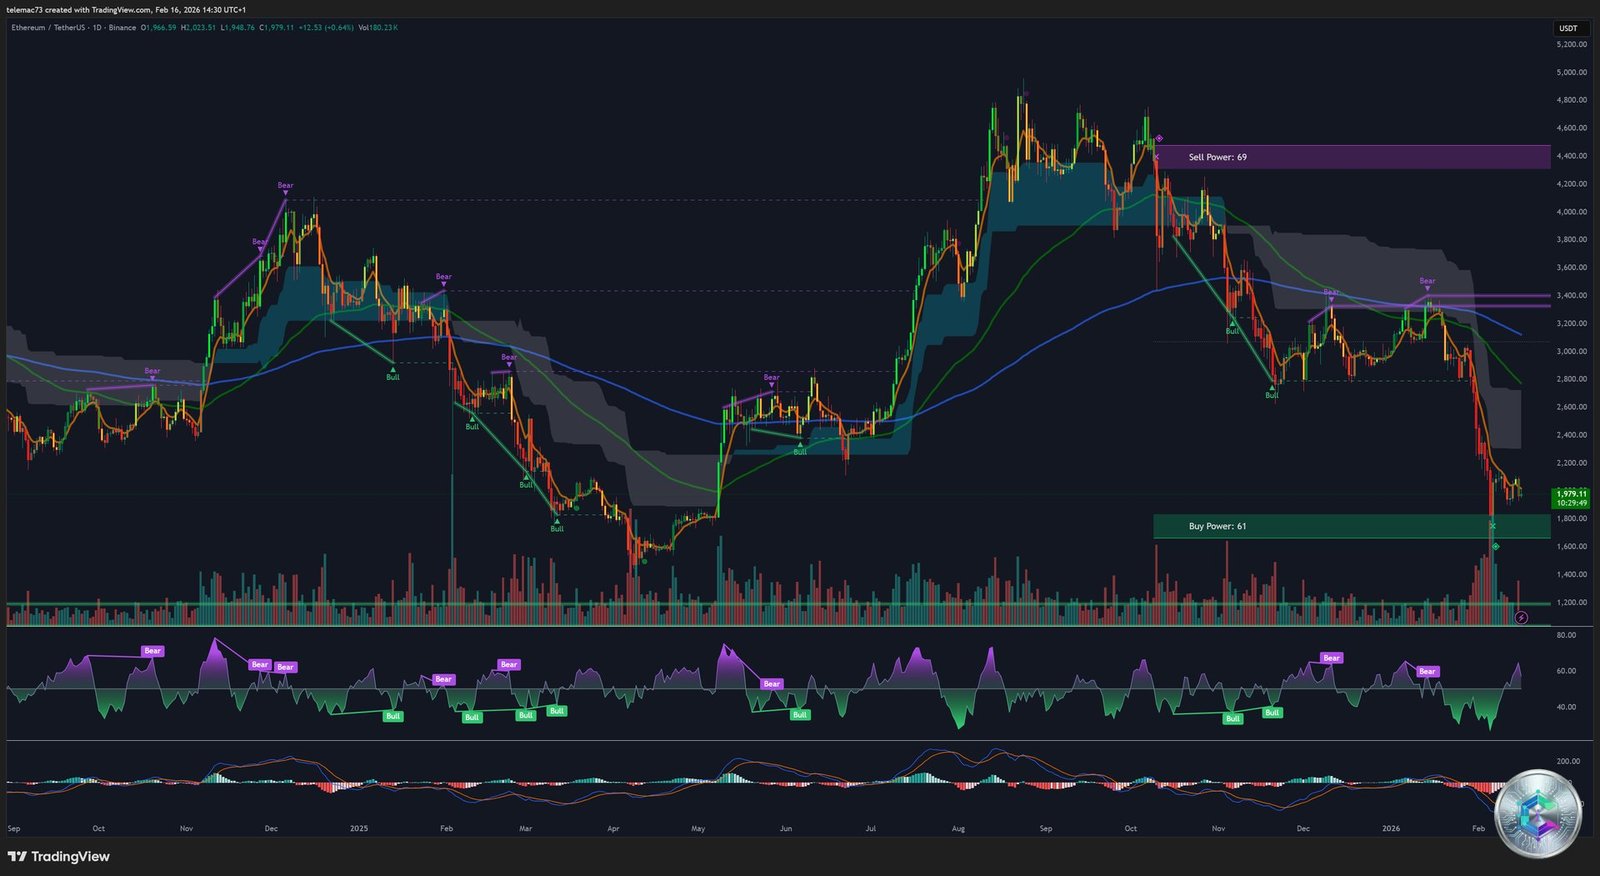
The Sell Power indicator reads 69, surpassing Buy Power at 61. This imbalance shows sellers maintaining relative control, though the gap is narrowing — signaling a possible floor-seeking phase. The market structure displays a succession of lower highs and lower lows, typical of a Wyckoff-style redistribution or accumulation phase.
A major support zone is identified between $1,600 and $1,800, corresponding to historical demand levels where institutional investors previously demonstrated significant buying interest.
URPD (Unrealized Realized Price Distribution) data shows approximately 5.86% of supply clustered at $2,822 and 6.15% at a similar level, creating considerable « overhead » resistance. These clusters represent holders sitting at unrealized losses who may seek to exit at breakeven during any rally.
| Support Zone (1D) | Resistance Zone (1D) |
|---|---|
| $1,600 – $1,800 (Institutional Demand) | $3,400 – $4,400 (Massive Supply) |
| $1,237 (Potential Cycle Bottom) | $2,822 (URPD Cluster) |
⏱️ 4-Hour Chart Analysis (4H): The Intermediate Pivot
The 4H chart provides a more nuanced view of recent price action. Ethereum, trading around $1,977, is showing signs of compression. The Sell Power on this timeframe is particularly high at 70, reflecting stronger immediate selling pressure than on the daily chart.

The MACD histogram is beginning to show shorter bars, indicating a deceleration of selling momentum. A sustained close above $2,016–$2,050 on the 4H timeframe would be the first sign of strength needed to target an extension toward the $2,057 pivot.
| Technical Metric (4H) | Value | Implication |
|---|---|---|
| Sell Power | 70 | Strong intraday selling pressure |
| RSI | ~40 (Neutral-Low) | Room for bounce or further decline |
| MACD | Negative (contracting) | Fading selling momentum |
| Recent Rejection Level | $2,050 – $2,080 | Confirmed immediate resistance |
🔬 15-Minute Chart Analysis (15m): Micro-Structure and Liquidity
The 15-minute chart allows observation of fine price mechanics. After a sharp drop from the $2,100 zone, Ethereum has formed a precarious consolidation base around $1,950–$1,977.
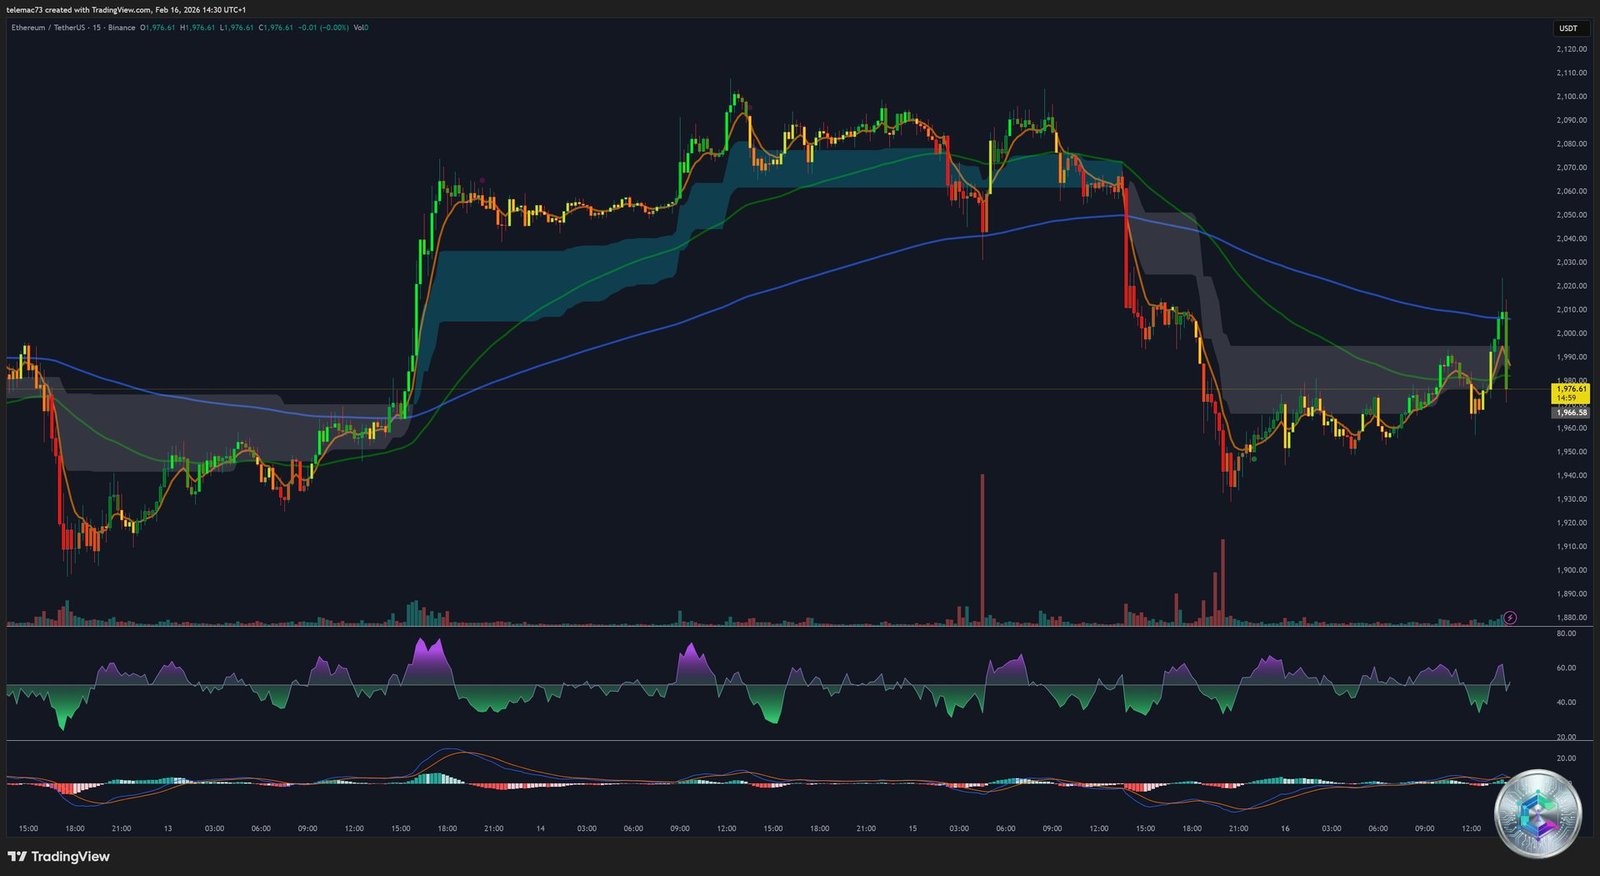
A notable volume spike is visible on recent bearish candles, signaling a local capitulation of weak hands. Markets in « chop » phases like this one exhibit rapid transitions between bullish and bearish zones. On this timeframe, the key pivot to watch is the last local high at $2,016: a break above with volume could trigger a short squeeze.
🔥 Liquidation Heatmap: The Battlefield Map

The Binance order book heatmap reveals where real institutional orders are positioned:
- Support Zones (Green/Blue): Massive buy order concentration toward $1,928–$1,950, with an extremely dense liquidity zone around $1,750 and down to $1,650.
- Resistance Zones (Red/Orange): Significant sell walls at $2,016, $2,100 (2,316 ETH), $2,200, and $2,400, blocking any rapid recovery.
⚡ Liquidation Imbalance and Short Squeeze Potential
Derivatives data reveals a crucial asymmetry: if Ethereum breaks through $2,057, nearly $928 million in short positions would be liquidated across major platforms. Conversely, a drop below $1,863 would trigger « only » $454 million in long liquidations.
This configuration suggests the path of least resistance at medium term could paradoxically be upward. An « overly short » market is vulnerable to a violent bounce that would force sellers to cover their positions, fueling the rally.
| Price Level | Size / Intensity | Strategic Significance |
|---|---|---|
| $2,057 | $928M (Shorts) | 🚀 Massive Short Squeeze Threshold |
| $2,016 | Major sell wall | Psychological and technical resistance |
| $1,928–$1,950 | Order book support | Likely bounce zone |
| $1,863 | $454M (Longs) | ⚠️ Liquidation Cascade Threshold |
🔧 Fundamentals and Governance: The 2026 Roadmap
30.5% Staking Rate: A Double Signal
The record 30.5% staking rate is a powerful dual signal. On one hand, it demonstrates unwavering confidence from long-term holders. On the other, it creates a structural supply crunch: ETH available on exchanges is at historically low levels. Such configurations have historically preceded parabolic moves when demand returns.
Glamsterdam (H1 2026) & Hegota (H2 2026)
🏙️ Glamsterdam – H1 2026
This upgrade focuses on immediate scalability. It introduces Enshrined Proposer-Builder Separation (ePBS), reducing censorship risks and proposing a potential gas limit increase from 60M to 200M — enabling significantly more transactions directly on L1.
🌿 Hegota – H2 2026
Even more ambitious, this upgrade targets the integration of Verkle Trees. Nodes will become « stateless, » massively reducing storage requirements. Decentralization is strengthened, enabling individuals to run nodes on modest hardware.
🏦 Institutional Flows and ETF Dynamics
The introduction of spot Ethereum ETFs has transformed ETH into a regulated financial asset. Although the week ending February 13, 2026 saw net outflows, key players are accumulating: Grayscale recorded inflows of $13.8 million on February 10th, breaking a selling spiral.
| ETF | Issuer | Approximate AUM |
|---|---|---|
| ETHA | BlackRock (iShares) | $6.2 Billion |
| ETHE | Grayscale Staking | $3.46 Billion |
| FETH | Fidelity | $1.34 Billion |
| ETH | Grayscale Mini | $1.27 Billion |
🎯 Synthesis and Market Scenarios
Key Structural Levels
| Type | Level | Significance |
|---|---|---|
| 🟢 Immediate Support | $1,928 – $1,950 | Heatmap order clusters |
| 🟢 Major Support | $1,700 – $1,800 | Daily Buy Power zone |
| 🟢 Cycle Support | $1,237 | Ultimate capitulation floor |
| 🔴 Immediate Resistance | $2,016 – $2,050 | Binance sell walls |
| 🔴 Short Squeeze Pivot | $2,057 | ~$928M shorts to liquidate |
| 🔴 Structural Resistance | $2,800 – $3,000 | URPD cluster and rally target |
Three Market Scenarios
🚀 Bullish Scenario
Consolidation above $1,950 → Break of $2,057 → Short Squeeze toward $2,500–$2,800. Supply scarcity (30.5% staking) acts as a multiplier.
⚖️ Neutral Scenario
Range-bound oscillation between $1,800 and $2,100 for several months. Building a solid base mirroring the 2021–2022 fractal, before a new sustained bull cycle.
🔻 Bearish Scenario
Loss of $1,863 support → Liquidation cascade toward $1,650–$1,700. Considered by many analysts as a « generational » buying opportunity ahead of the 2026 upgrades.
📌 Conclusion
The multidimensional analysis of Ethereum on February 16, 2026 indicates a market in a final leverage flush phase. While prices face apparent downward pressure, on-chain and institutional foundations are stronger than ever. The upside potential toward $4,500–$10,000 by end of 2026 remains intact if the Glamsterdam and Hegota upgrades are successfully deployed.
Ethereum’s current situation is not that of a declining asset, but rather a technological infrastructure undergoing re-pricing. Monitoring ETF flows and the liquidation heatmap at $2,057 will be the primary indicator for identifying the start of the next expansion phase.
⚠️ Disclaimer: This article is written for educational and informational purposes only. It does not constitute investment advice, or a recommendation to buy or sell digital assets. Cryptocurrencies are highly volatile and speculative assets. Investing involves the risk of capital loss, potentially up to the total amount invested. Please consult a licensed financial advisor before making any investment decisions.