
Ethereum (ETH) is navigating one of the most complex phases of its history in February 2026. The world’s second-largest cryptocurrency by market cap — approximately $238 billion — is trading around the $1,945–$1,970 zone, down 30% since January 2026 and 40–50% from recent local highs. Yet technological and institutional fundamentals have never been stronger. A complete breakdown.
A Paradoxical Market Context
The Fear & Greed Index is flashing an alarming score of 11/100, signaling generalized behavioral capitulation. The ETH/BTC pair has dropped 22.5% over six months, highlighting Ethereum’s relative underperformance against Bitcoin. Yet this price deterioration masks a fundamentally different reality: the Ethereum network has never been so heavily used or so coveted by traditional financial institutions.
Glamsterdam: The Protocol Revolution of 2026
The most powerful fundamental catalyst for Ethereum’s long-term appreciation is the planned H1 2026 deployment of the major upgrade dubbed Glamsterdam. This update is not a mere incremental software iteration — it represents a visceral transformation of the Ethereum Virtual Machine (EVM), aiming to turn the network into a high-frequency global computing infrastructure.
Glamsterdam’s key innovations include:
- Parallel transaction execution: the gas limit is expected to exceed 100 million per block by processing independent operations simultaneously, eliminating historical bottlenecks.
- Native Proposer-Builder Separation (PBS): to democratize block construction, reduce MEV centralization, and ensure fairer execution for end users.
- Native Account Abstraction: removing private key complexity, enabling gasless transactions and social account recovery — a revolution for the Web3 user experience and mass adoption.
- Post-quantum security and ZK-proof integration for AI: anticipating future threats while opening unprecedented possibilities for the machine economy.
These improvements are already translating into real metrics: the network hit an all-time high of 17.3 million weekly transactions with median fees at just $0.008 — a 3,000× reduction from 2021 peak congestion costs. Ethereum maintains its dominance in DeFi with 57% of global TVL, and Real World Assets (RWA) tokenized on its blockchain grew 315% year-over-year, surpassing $17 billion.
Institutional Dynamics: The Staking ETF War
Understanding February 2026 price action is inseparable from analyzing capital flows in U.S. spot ETFs. The institutional ecosystem is undergoing a complex rebalancing period, generating apparently contradictory signals:
| Date | Net ETF Flows (USD) | Dominant Actor | Implication |
|---|---|---|---|
| Feb 17 | + $48.63M | BlackRock ETHA: +$22.89M | Strategic accumulation — Total NAV: $11.46B |
| Feb 18 | – $42.50M | BlackRock ETHA: -$30.60M | Portfolio rotation — No ETF in positive flow |
| Feb 19 | – $41.82M | BlackRock ETHA: -$29.93M | Confirmed transition toward yield-bearing products (ETHB) |
These massive outflows should not be interpreted as institutional flight. They actually reflect a tactical rotation toward BlackRock’s new ETHB ETF — the first U.S. fund structured to directly redistribute staking rewards to investors (~82% of yields). Leading institutions including Harvard Management Company and Abu Dhabi’s sovereign wealth fund Mubadala are reallocating, liquidating classic ETFs to position in this new hybrid product resembling a « perpetual digital bond. »
On-Chain Analysis: Silent Accumulation by Smart Money
On-chain data reveals a striking behavioral dichotomy. Despite a 30%+ correction since January, metrics show:
- 2.5 million ETH withdrawn from centralized exchanges to cold storage addresses in February — one of the fastest accumulation rates ever recorded.
- Accumulation address balances rose from 22 to 26.7 million ETH since the start of 2026.
- 37.22 million ETH locked in staking contracts (over 30% of total circulating supply), with 3.82 million more in the activation queue.
- Bitmine acquired 45,759 ETH in a single week.
This structural contraction of the liquid float creates conditions ripe for a supply shock: any resurgence in demand could propel prices violently upward with no sellers available at current prices.
Warning signal: whales recently transferred over $500 million in ETH to Binance — an exchange inflow that historically precedes either structured spot liquidations or short-hedging strategies on derivatives markets.
Microstructure and Liquidity Heatmap

The TapeSurf heatmap exposes a critical order book asymmetry around the current price (~$1,945):
- To the downside: ~$1 billion in long liquidations clustered around $1,800.
- To the upside: over $2 billion in massive short positions above $2,200, thickening toward $2,300–$2,400.
This 1:2 asymmetry in favor of the upside is the perfect breeding ground for a short squeeze. If price breaks $2,100, forced covering of these $2 billion short positions would trigger a bullish feedback loop capable of catapulting ETH toward $2,400–$2,600 mechanically and irrationally.
Aggregate open interest has collapsed to $11.2 billion (from ~$30 billion at the August 2025 peak), confirming the purge of overleveraged positions. Paradoxically, 73% of active derivatives accounts are positioned long, yet net taker volume on Binance remains negative since January — a handful of aggressive institutional sellers against a multitude of passive retail buyers.
Multi-Timeframe Technical Analysis
15-Minute Chart — Intraday Algorithmic Compression
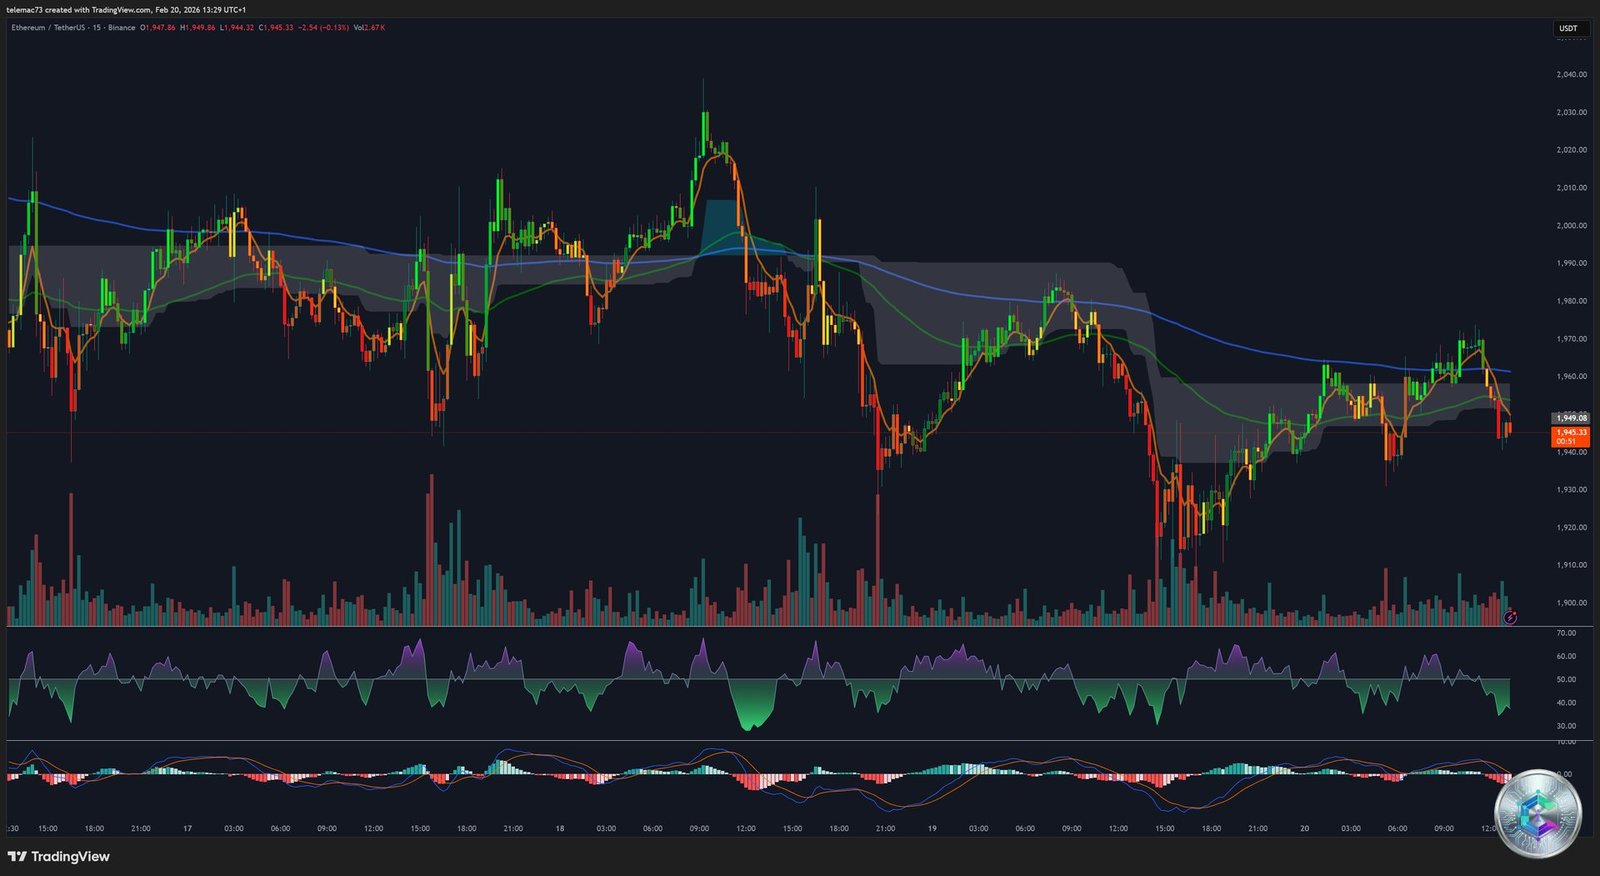
On the 15-minute timeframe, ETH oscillates in a micro-range of $1,948–$1,970. Every bullish attempt is immediately smothered by intraday moving averages. Volume only spikes during panic selling waves. The short-term RSI cycles through oversold territory without ever reaching overbought — signature of algorithmic preemptive accumulation. This volatility strangulation (squeeze) invariably precedes a cataclysmic directional expansion.
4-Hour Chart — « Adam and Eve » Reversal Pattern

On the 4H timeframe, selling pressure remains dominant (Sell Power 68 vs Buy Power 52), but a major reversal pattern is forming: the « Adam and Eve Bottom ». A first panic V-shaped crash (Adam) followed by a prolonged U-shaped consolidation (Eve) evidences institutional absorption of sell-side supply.
The critical neckline sits at $2,150, confluencing with the 20-day EMA. A close above validates the pattern and targets an extension toward $2,473–$2,634. A rejection validates the bearish channel and sends ETH back toward $1,909.
Daily Chart — Bearish Structure with Fractal Hope
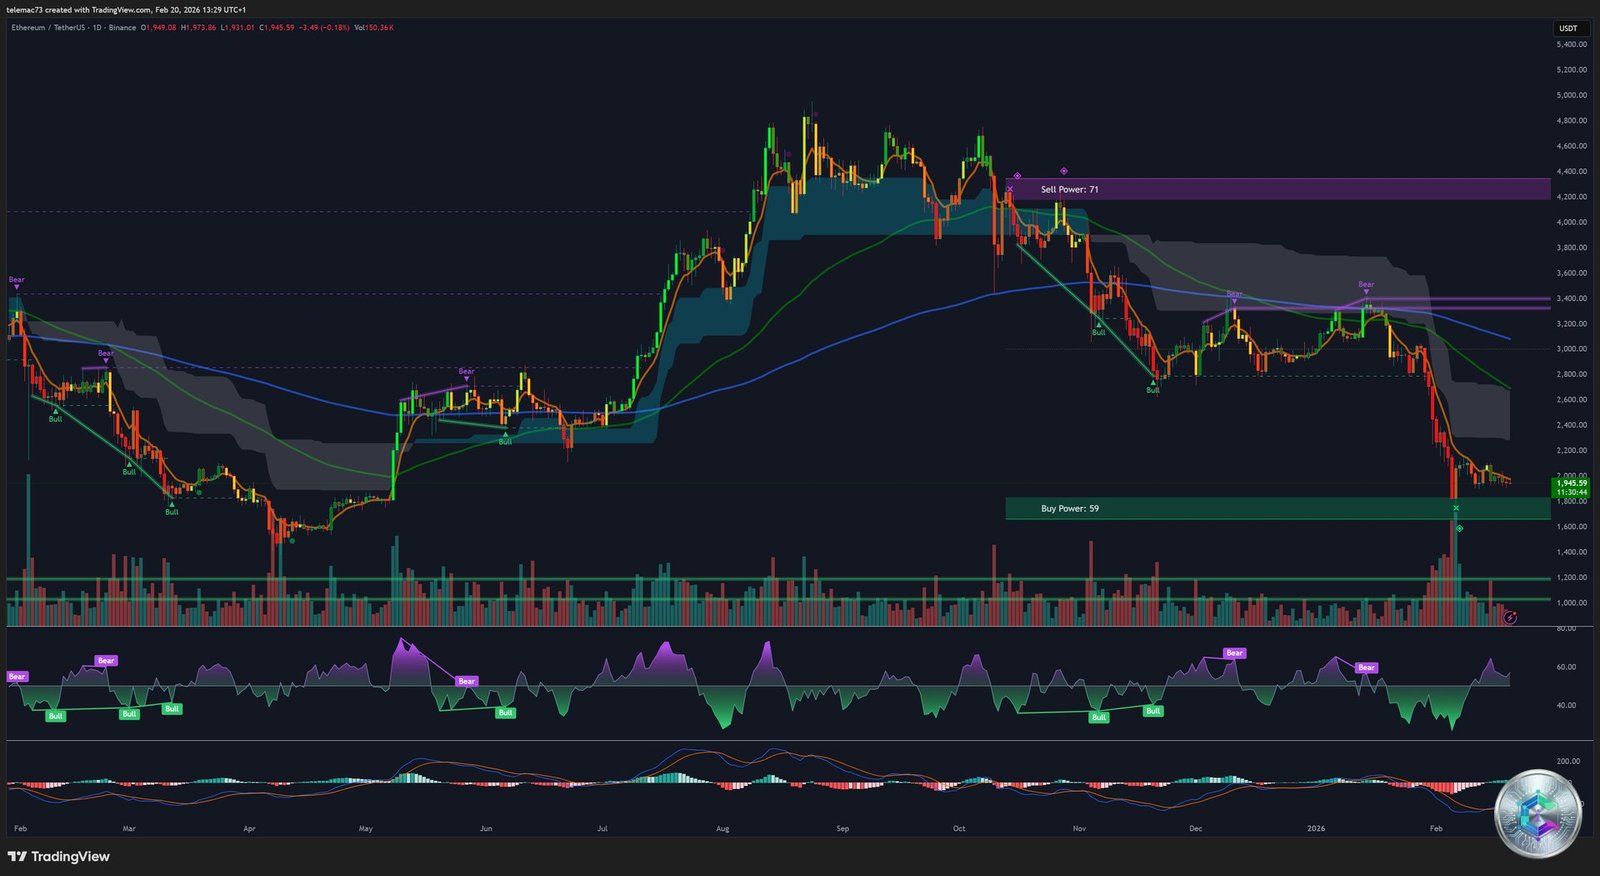
The daily chart displays a systemic corrective dynamic: descending channel with lower highs and lower lows, Sell Power at 71 vs Buy Power at 33, MACD at -1.070 and RSI around 33. The 20-day EMA at $2,157 acts as a dynamic glass ceiling. The $2,100–$2,300 historical support has flipped into a institutional resistance zone.
Nevertheless, advanced fractal analysis (Trader Tardigrade firm) identifies the formation of a « rectangular consolidation box » mirroring the compression seen before the late 2025 ETH rally. This structure — bounded by $1,800 support and $2,100 resistance — suggests a Wyckoff accumulation phase: potential energy building for a future aggressive markup phase.
Key Level Mapping
| Level | Zone (USD) | Significance |
|---|---|---|
| Max bullish target | $2,473 – $2,634 | Adam & Eve validated extension target |
| Secondary resistance | $2,388 – $2,400 | Original breakdown area |
| Intermediate resistance | $2,230 | First quantitative post-breakout resistance |
| 🎯 Master pivot | $2,150 – $2,157 | Adam & Eve neckline + 20D EMA — decisive level |
| Structural ceiling | $2,100 – $2,107 | Upper boundary of current consolidation |
| Current neutral zone | $1,945 – $1,970 | Market’s center of gravity |
| S1 / bearish breakdown trigger | $1,909 – $1,910 | Breach = bearish acceleration |
| 🛡️ Macro fortress | $1,800 | ~$1B in pending long liquidations |
| Ultimate capitulation | $1,524 – $1,550 | Final purge in case of systemic panic |
Directional Scenarios: Two Possible Outcomes
🚀 Bullish Scenario (Higher Probability): Short Squeeze and Wyckoff Markup
The $1,800–$1,900 zone holds as a rampart. Smart money on-chain accumulation (2.5M ETH pulled from exchanges), the floating supply contraction (37M ETH in staking), and the potential sovereign fund inflow into BlackRock’s ETHB constitute the fuel for an explosive bullish resolution. A break of the 20D EMA at $2,157 would trigger automatic execution of $2 billion in shorts, propelling ETH toward $2,400–$2,600 initially, then reopening the path toward $5,000 by end-2026.
📉 Bearish Scenario (Lower Probability): Capitulation and Final Purge
Repeated failure to reclaim $2,000 in a context of apathy and dominant sell volume could trigger a $1,909 support break, setting off the purge of $1 billion in long positions at $1,800. Amplified by the potential dumping of the whales’ $500M ETH sitting on Binance, this scenario would send the asset toward the ultimate capitulation zone of $1,524–$1,550. A painful purge, but one that would definitively cleanse the market.
Macroeconomic Influence
Ethereum is now a « high-beta » asset correlated to global liquidity dynamics. On this Friday, February 20, 2026, the eurozone, Japan, and the UK are simultaneously releasing PMI and business sentiment indicators. Economic weakness in these regions would strengthen the dollar (DXY), applying additional downward pressure on crypto. Conversely, better-than-expected data could serve as the macroeconomic catalyst for a decisive technical breakout.
Prediction markets (Robinhood, Feb 20 midnight EST expiry) assign only a 5-cent probability to a close above $1,960 — confirming institutional expectation of lethargic consolidation in the very short term.
Conclusion: A Historic Informational Asymmetry
Ethereum currently crystallizes one of the most pronounced informational asymmetries of the decade. On one side: a technology in full revolution (Glamsterdam), unprecedented institutional adoption (ETFs, RWA tokenization, institutional staking), and structural contraction of the liquid float. On the other: lethargic charts, generalized panic sentiment, and relentless algorithmic selling pressure.
The directional breakout — bullish or bearish — will be all the more violent the longer this compression phase lasts. Key levels to watch: $2,150 as the bullish Rubicon, $1,909 as the bearish trigger. The informed observer will focus attention on volumes, ETF flows, and on-chain publications in the coming days.
⚠️ Disclaimer: This article is written for exclusively educational and informational purposes. It does not constitute investment advice or a recommendation to buy or sell digital assets. Cryptocurrency markets are extremely volatile and carry the risk of total capital loss. Please consult a licensed financial advisor before making any investment decision.