
The cryptocurrency market is navigating a critical transition phase in mid-February 2026. Ethereum, the sector’s second-largest asset by market cap, finds itself at the confluence of major macroeconomic pressures and unprecedented technological developments. Trading between $1,920 and $1,970, ETH displays a persistent bearish structure across all timeframes — yet several signals suggest a major inflection point may be approaching.
Macroeconomic Context: A Hostile Environment for Risk Assets
The 2026 macroeconomic environment is shaped by persistent uncertainty around Federal Reserve monetary policy. The latest FOMC minutes reveal ongoing inflation concerns, fueling dollar strength and broad risk aversion. As a high-beta asset, Ethereum is suffering steeper corrections than Bitcoin during these institutional risk-off phases.
The ETHZilla Treasury Model Collapse
A major confidence shock rattled the Ethereum ecosystem in early 2026: ETHZilla, positioned as the MicroStrategy equivalent for ETH, saw its stock collapse by 97% after Peter Thiel’s Founders Fund liquidated its entire stake of 11.59 million shares in late 2025. On February 18, 2026, the company officially abandoned its Ethereum treasury model to pivot into commercial aerospace, selling its crypto reserves to reduce debt. This strategic reversal signals that the institutional « buy and hold » accumulation thesis for ETH may be losing steam against the current volatility backdrop.
Spot ETF Flows: Record Outflows
Ethereum spot ETFs are recording massive capital outflows. On February 18, 2026, net outflows reached $41.8 million, dragging total assets under management down to approximately $1.02 billion from $1.06 billion the day prior. Led by BlackRock’s ETHA fund, these outflows reflect a large-scale institutional rebalancing toward more stable assets or Bitcoin.
| Ethereum ETF Metric | Value (Feb. 19, 2026) |
|---|---|
| Daily Net Outflows | $41.83M |
| 24h Trading Volume | $18.82B |
| Assets Under Management | $1.02B |
| ETH Market Cap | $232.74B |
Daily Chart Analysis (1D): Confirmed Bearish Structure
On the daily chart, Ethereum presents a clearly bearish market structure, characterized by a series of lower highs and lower lows since early February. The asset has broken several major historical support levels, with trend indicators confirming near-total seller dominance.
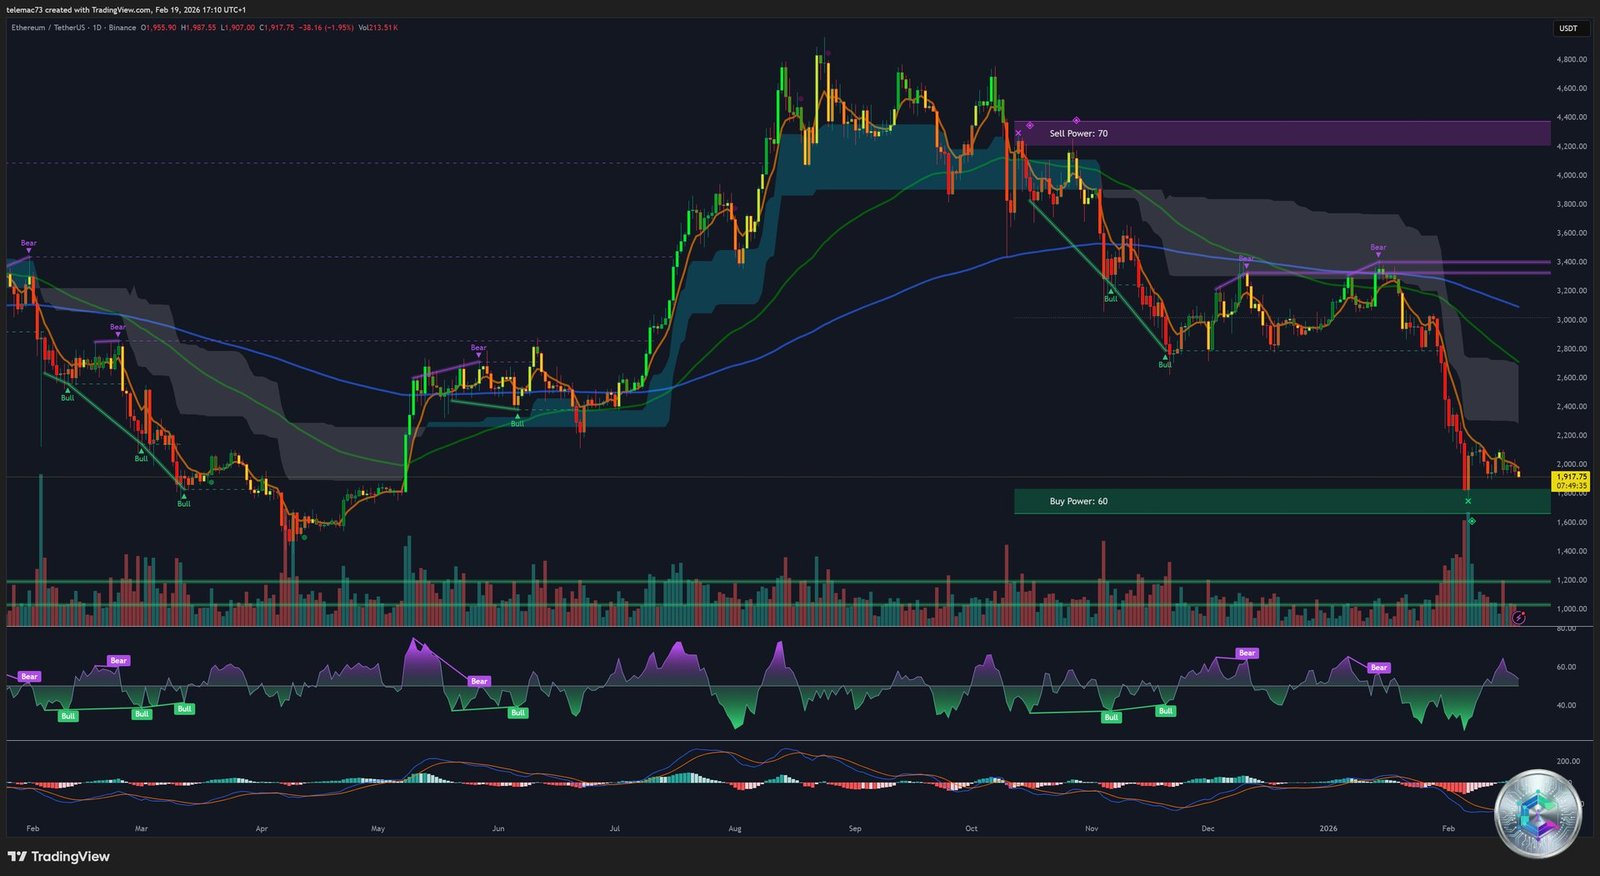
Moving Averages: A Wall of Resistance
ETH is trading well below all its key exponential moving averages (EMAs). The 20-day EMA at $2,223 acts as immediate resistance, capping any recovery attempt. Above that, the 50-day ($2,514), 100-day ($2,836), and 200-day ($3,071) EMAs form a formidable technical and psychological barrier. A durable trend reversal would require a weekly close above the 50-day EMA — a scenario that appears unlikely in the short term given the negative slope of these indicators.
RSI and MACD: Persistent Bearish Momentum
The RSI (14) is holding between 31 and 33, placing ETH in oversold territory without yet triggering a final capitulation signal. The MACD remains anchored in negative territory. While a slight narrowing of the histogram bars suggests weakening immediate selling pressure, no bullish crossover is visible on the daily chart.
| Daily Indicator | Current Status |
|---|---|
| RSI (14) | 31–33 (Oversold) |
| 20-Day EMA | $2,223 (Resistance) |
| 200-Day EMA | $3,071 (Long-Term Pivot) |
| MACD | Negative (Bearish Momentum) |
Crucially, Ethereum is currently resting on a structural support line dating back to 2020, coinciding with the $2,000 psychological zone. A definitive break below $1,500 would mark the entry into a prolonged bear market similar to 2022.
4-Hour Chart Analysis (4H): Compression Inside a Decision Triangle
The 4-hour timeframe reveals a tight compression structure, with ETH trapped between a support at $1,800 and resistance between $2,380–$2,400. This pattern can be interpreted as a bearish pennant — a sharp decline followed by a converging consolidation range with diminishing volume.
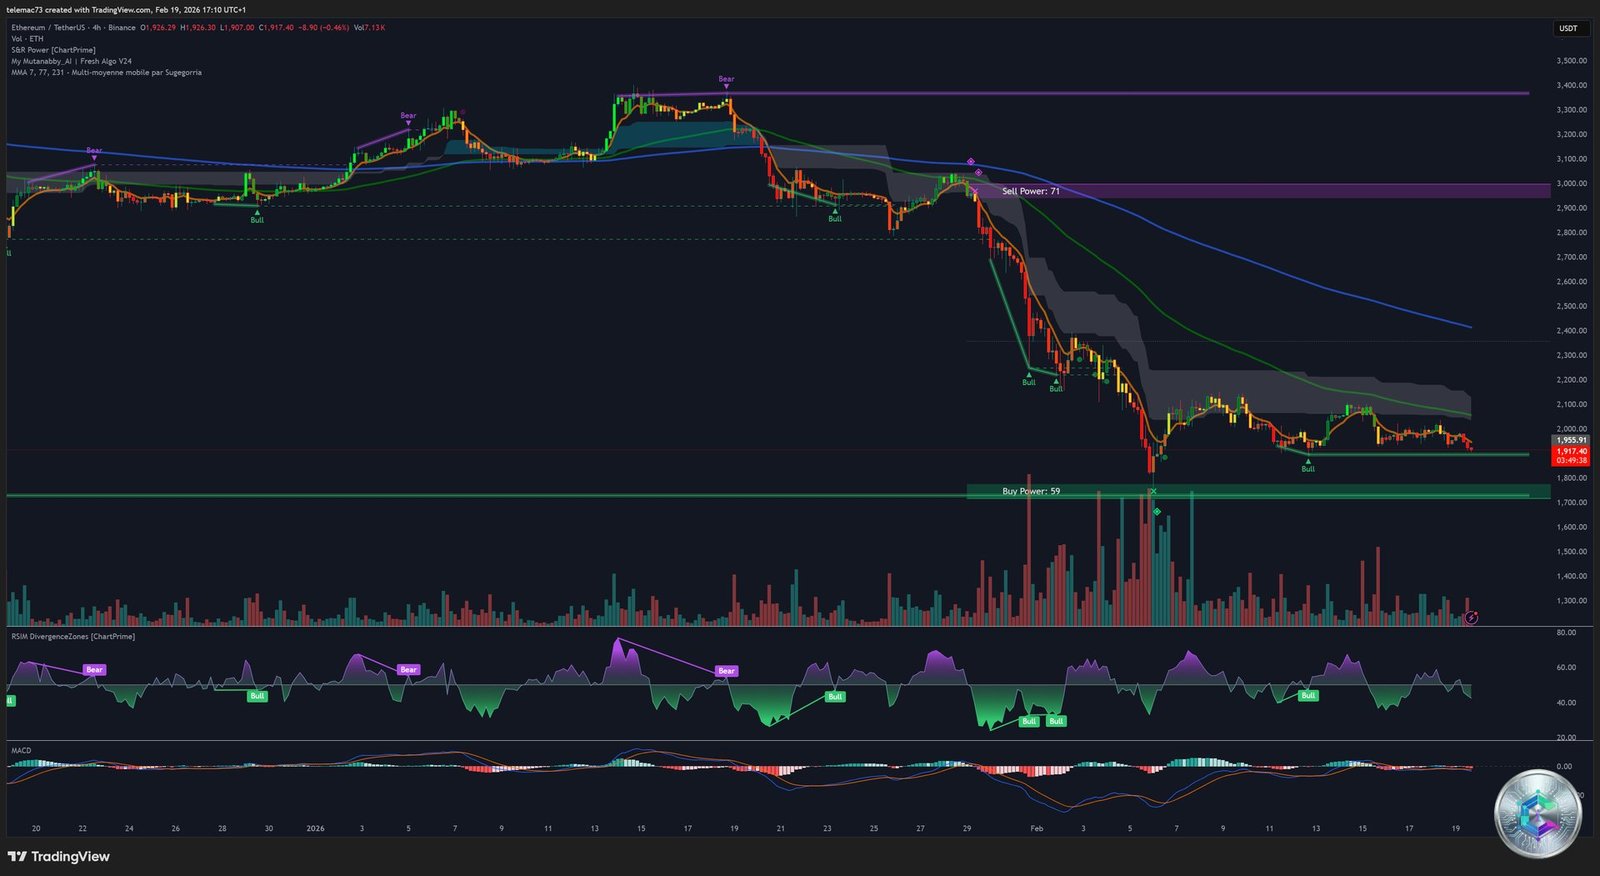
A breakdown below $1,950 could accelerate the move toward the major demand zone at $1,740. Conversely, some analysts note a sequence of slightly higher lows within the triangle, suggesting discrete institutional accumulation. For a bullish scenario to validate, ETH must break $2,125 with significant volume.
| Key 4H Level | Price (USDT) | Significance |
|---|---|---|
| Major Resistance | $2,380–$2,400 | Top of compression range |
| Immediate Resistance | $2,125 | Last failed bounce high |
| Tactical Support | $1,950 | Triangle low |
| Demand Support | $1,800 | Buyer defense threshold |
15-Minute Intraday Analysis (15M): Liquidity Hunts and Price Zones

The 15-minute chart reveals a highly volatile scalping environment marked by frequent liquidity hunts. The intraday market is dominated by the filling of Fair Value Gaps (FVGs) left by sharp moves in previous sessions.
An intraday demand zone has been identified at $1,941, with secondary support at $1,900. Traders are using bounces toward the $1,988–$2,014 zone as opportunities to enter short positions, anticipating continued structural weakness.
The Whale Trap at $1,930
An on-chain analysis of Hyperliquid positions reveals a massive $80 million long position opened at approximately $2,039 with 20x leverage. The liquidation price of this position is mathematically located around $1,930 — suggesting the market could gravitate toward this level to force the liquidation before any potential reversal attempt.
| Intraday Level (15M) | Price (USDT) | Action |
|---|---|---|
| Sell Zone | $1,988–$2,014 | Watch for short on bounce |
| Downside Target 1 | $1,941 | Partial profit-taking |
| Downside Target 2 | $1,930 | Whale liquidation zone |
| Stop Loss | $2,040 | Bearish bias invalidation |
Liquidation Heatmap: $1.4 Billion in Play
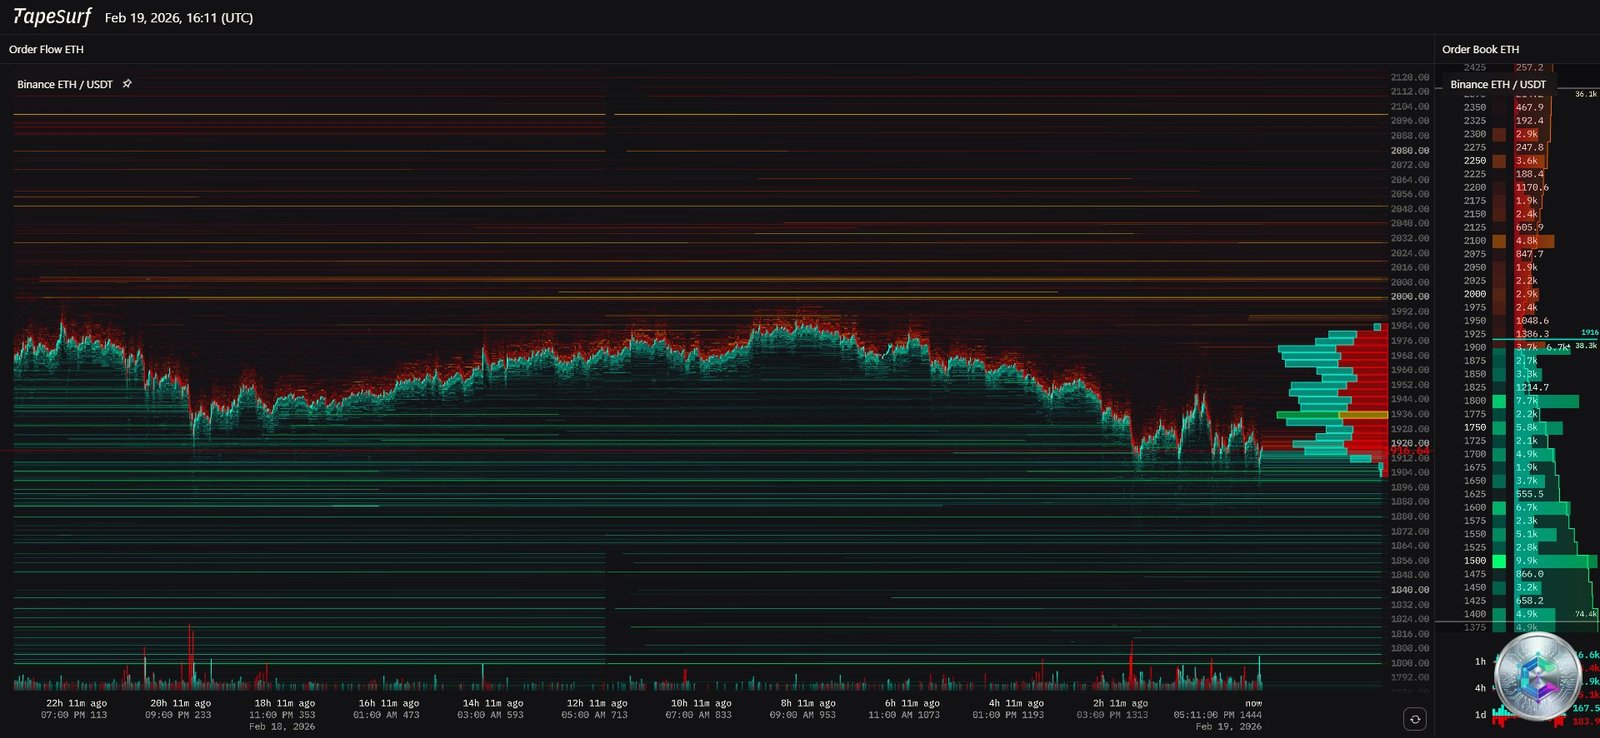
The derivatives market structure is coiled like a spring, with nearly $1.4 billion in leveraged positions ready to be liquidated. The Coinglass heatmap identifies two major walls that will define the direction of the next violent move:
- Upside Wall at $2,057: $928 million in short positions would be liquidated. Breaking this level would trigger a violent short squeeze, potentially launching ETH toward the $2,200 zone very quickly.
- Downside Wall at $1,863: $454 million in long positions would be liquidated, triggering cascading forced sells and testing the $1,800 psychological support.
The current asymmetry favors « upside pain » — the short liquidation pool is more than twice the size of the long pool, giving market makers a financial incentive to push the price toward $2,057 to capture that liquidity.
| Liquidation Zone | Estimated Intensity | Potential Effect |
|---|---|---|
| Resistance ($2,057) | $928M (Shorts) | Violent Short Squeeze |
| Support ($1,863) | $454M (Longs) | Forced Sell Cascade |
2026 Fundamentals: Glamsterdam and Hegota — The Upgrades That Change Everything
Despite the price turmoil, Ethereum’s 2026 technology roadmap remains ambitious and represents the primary long-term investment thesis.
Glamsterdam (Mid-2026): Layer 1 Efficiency
Scheduled for the first half of 2026, Glamsterdam brings three major innovations:
- ePBS (EIP-7732): Formal separation of block builder and block proposer roles at the protocol level, reducing MEV centralization and enhancing censorship resistance.
- Parallel Block Processing (EIP-7928): Nodes will be able to use multiple CPU cores to validate transactions simultaneously — targeting a throughput of up to 10,000 TPS over time.
- Block Space Optimization: Reducing wasted block space and eliminating execution pipeline bottlenecks for more predictable gas fees.
Hegota (Late 2026): Decentralization and Privacy
Hegota tackles the structural challenges of data growth and node decentralization:
- Verkle Trees: Drastically reducing the data nodes must store to verify network state, making running an Ethereum node much lighter and promoting greater decentralization.
- FOCIL: Guaranteeing that all valid transactions are included on-chain, even if block builders attempt to delay or censor them.
- Encrypted Mempool & Quantum Resistance: Protecting user privacy at the network level and introducing quantum-resistant signature schemes.
| Upgrade | Estimated Date | Key Innovations |
|---|---|---|
| Glamsterdam | Mid-2026 | ePBS, Parallel Processing, EIP-7732 |
| Hegota | Late 2026 | Verkle Trees, FOCIL, Encrypted Mempool |
| Pectra (Past) | Mid-2025 | Account Abstraction, EIP-7702 |
On-Chain Analysis: Whales Accumulate, Retail Sells
Since February 4, 2026, wallets holding between 10,000 and 100,000 ETH have accumulated approximately 840,000 ETH during price dips — a strong signal that large investors view the $1,900 zone as a long-term value opportunity. Meanwhile, smaller wallets (100–10,000 ETH) have resumed a distribution phase, selling holdings out of fear of a prolonged downturn.
However, ETH reserves on exchanges have increased by 180,000 ETH over five days — a traditionally bearish signal indicating preparation to sell in case of volatility. The Ethereum network remains structurally sound: 966,000 active validators and 3.8 million ETH queued for staking, acting as a long-term price stabilizer.
Comparative Analysis: ETH vs BTC and SOL
| Asset | Price (Feb. 19, 2026) | 24h Change | Sentiment |
|---|---|---|---|
| Bitcoin (BTC) | $67,250 | -2.5% | Cautious Consolidation |
| Ethereum (ETH) | $1,928 | -3.85% | Distress / Oversold |
| Solana (SOL) | $81 | -4.2% | Corrective Pullback |
Ethereum continues to underperform Bitcoin. Analysts agree that ETH cannot begin a meaningful recovery until it stabilizes relative to BTC. Solana, while also correcting toward $80, remains perceived as a faster and cheaper alternative, diverting speculative liquidity away from the Ethereum ecosystem.
Summary: Key Strategic Levels to Watch
The central pivot is set at $2,040. A daily close above this level would invalidate the immediate bearish bias and open the door to a test of $2,125–$2,160. Below it, the trend remains firmly bearish.
| ETH/USDT Level | Price (USD) | Importance |
|---|---|---|
| Resistance 3 | $2,388 | Descending channel midline |
| Resistance 2 | $2,125 | Last failed bounce high |
| Resistance 1 | $2,057 | Short Squeeze Threshold |
| Central Pivot | $2,040 | Bull/Bear Dividing Line |
| Support 1 | $1,941 | VWAP / Intraday Demand |
| Support 2 | $1,863 | Long Liquidation Threshold |
| Support 3 | $1,800 | Psychological & Historical Floor |
Conclusion: At a Critical Crossroads
Ethereum on February 19, 2026 is an asset at a critical crossroads. The technical structure is undeniably bearish across all significant timeframes, and massive ETF outflows signal partial institutional capitulation, amplified by the ETHZilla treasury model collapse.
Yet several signals suggest the market is approaching an inflection point. Continued whale accumulation in the $1,900 zone, the massive liquidation heatmap asymmetry ($928M in shorts to squeeze above $2,057), and the compression within the 4H triangle create the conditions for a potentially violent relief bounce. For long-term investors, the robustness of staking and the imminent Glamsterdam and Hegota upgrades provide solid fundamental underpinning, suggesting the network’s intrinsic value continues to grow despite the price depreciation. The rational strategy: watch the triangle break — above $2,040 for a recovery phase, below $1,800 for a potential return toward $1,400.
⚠️ Disclaimer: This article is written for educational and informational purposes only. It does not constitute investment or financial advice of any kind. Cryptocurrency markets are highly volatile and speculative. Only invest what you can afford to lose, and consult a licensed financial advisor before making any investment decisions.