
As we enter January 2026, Ethereum finds itself at a major inflection point. Trading within a narrow range between $3,050 and $3,200, the world’s second-largest cryptocurrency is capturing the attention of professional traders and institutional investors alike. This in-depth technical analysis dissects the market microstructure, critical liquidation zones, and macroeconomic catalysts that will determine ETH’s trajectory in the coming weeks.
The Macroeconomic Context: The CPI Sword of Damocles
The cryptocurrency market remains suspended on the release of the U.S. Consumer Price Index (CPI) on January 13, 2026. This data is crucial as it will dictate the Federal Reserve’s monetary policy and, by extension, appetite for risk assets like Ethereum. Consensus expectations anticipate stable inflation at 2.7% year-over-year, but any surprise could trigger explosive volatility in crypto markets.
A reading above expectations would validate the « Higher for Longer » scenario (elevated rates for an extended period), mechanically penalizing assets without guaranteed yields. Conversely, a surprise inflation drop could revive hopes for rate cuts and propel ETH to new heights.
The Troubling Divergence in ETF Flows
A concerning structural phenomenon for Ethereum investors is emerging at the start of this year: divergence in exchange-traded product (ETF) flows. Recent data reveals that Ethereum ETFs recorded net outflows of $116 million in one week, while Solana attracted $32 million and XRP $45 million.
This trend suggests a sector rotation where Ethereum is losing its status as the exclusive proxy for smart contract exposure. Institutional investors are diversifying their portfolios toward alternative blockchains, calling into question ETH’s historical dominance in the smart contracts segment.
Multi-Timeframe Technical Analysis
The Multi-Year Ascending Triangle (Daily Chart)
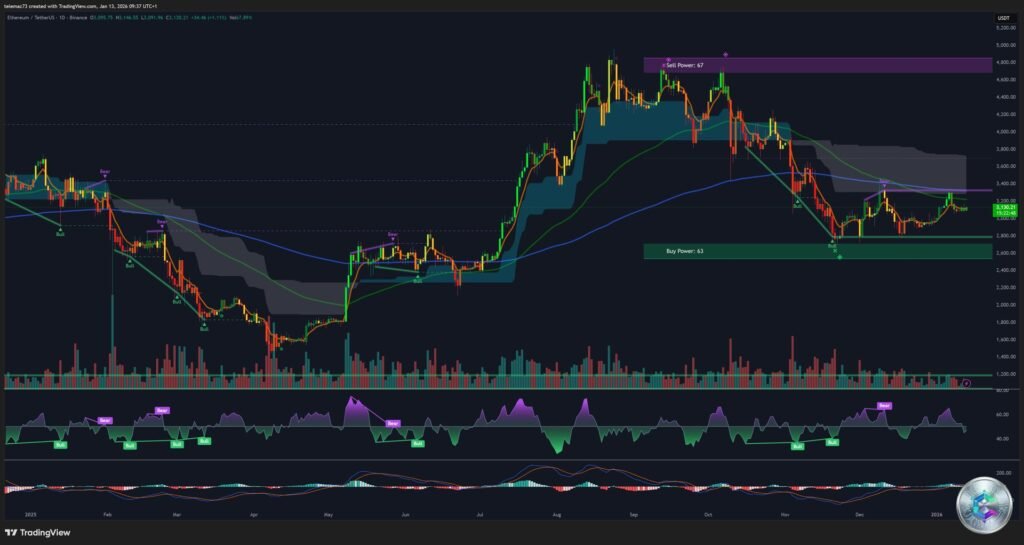
On the daily chart, Ethereum is trading within a massive ascending triangle with a base dating back to 2020. The bullish trendline supporting this structure currently passes through the $2,800 – $2,900 zone. As long as the price closes above this zone on a weekly basis, the long-term bullish thesis remains technically valid, with a theoretical target beyond $20,000.
The price is currently struggling below the 50-day Simple Moving Average (SMA 50), which acts as dynamic resistance around $3,220. The stochastic indicator is approaching the overbought zone (80%), suggesting that recent bullish momentum is waning and that a correction or consolidation is likely in the short term.
Trends and Divergences (4-Hour Chart)
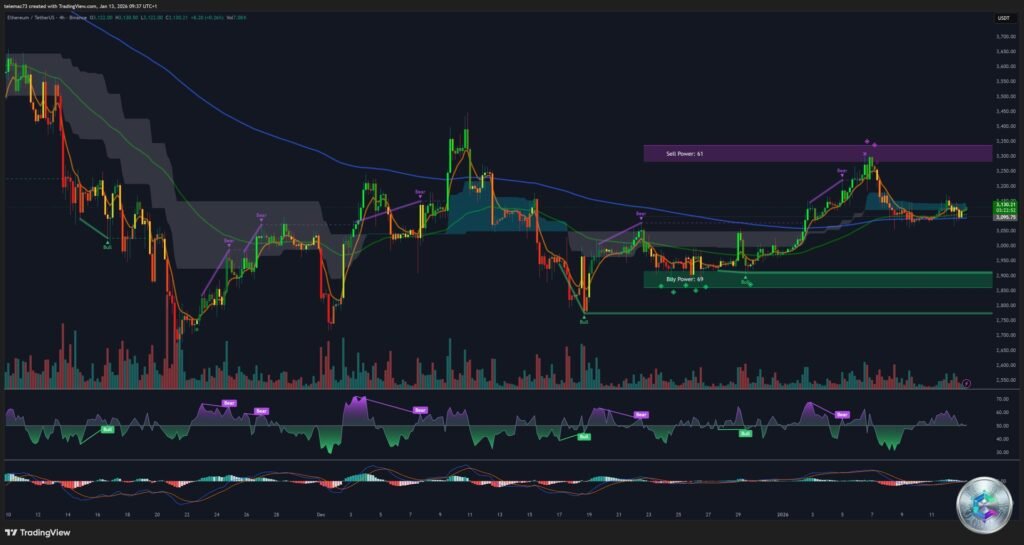
The 4-hour chart reveals a more nuanced structure with Bollinger Bands tightening, indicating a drop in volatility. Historically, such compression precedes an explosive move. Technical analysts have identified « hidden bearish divergences » on the H4 RSI, where the price forms lower highs while the oscillator forms higher highs during bounces, suggesting that the bounces are corrective in nature and that the underlying bearish trend remains dominant.
Intraday Pivot Points (15-Minute Chart)
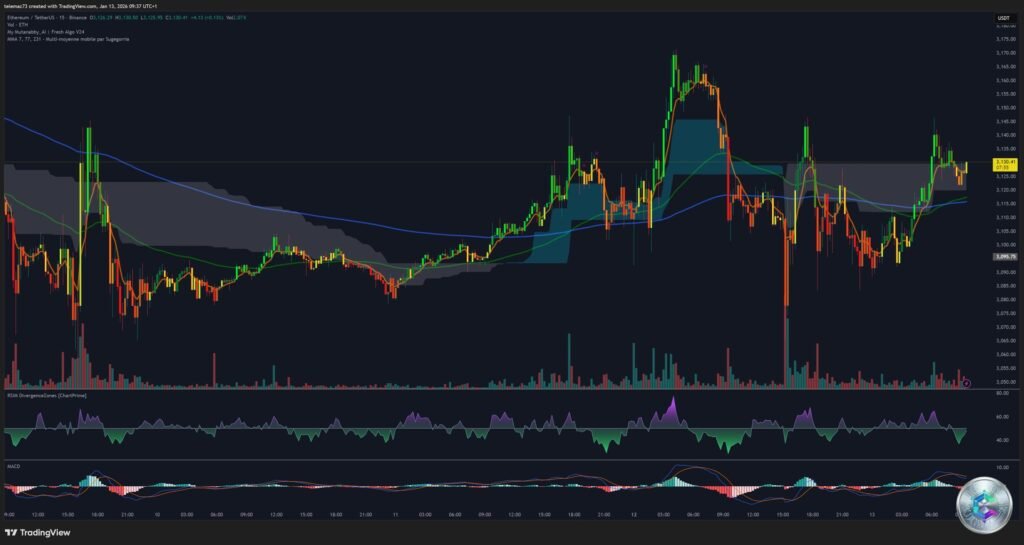
For intraday traders, the 15-minute chart offers essential granularity. The central pivot point sits at $3,170, acting as a tipping point: above it, the bias is bullish; below it, bearish. Key resistances are located at $3,189 (R1), $3,203 (R2), and $3,213 (R3), while supports are identified at $3,157 (S1), $3,126 (S2), and $3,090 (S3).
The Risk of Massive Liquidation
An alarming data point characterizes the current market: the estimated leverage ratio for the ETH/USD pair on major exchanges has reached a record level of approximately 0.8. This concentration of leveraged positions makes the market extremely vulnerable to shocks. A minimal price variation (1-2%) can be enough to trigger a cascade of liquidations.
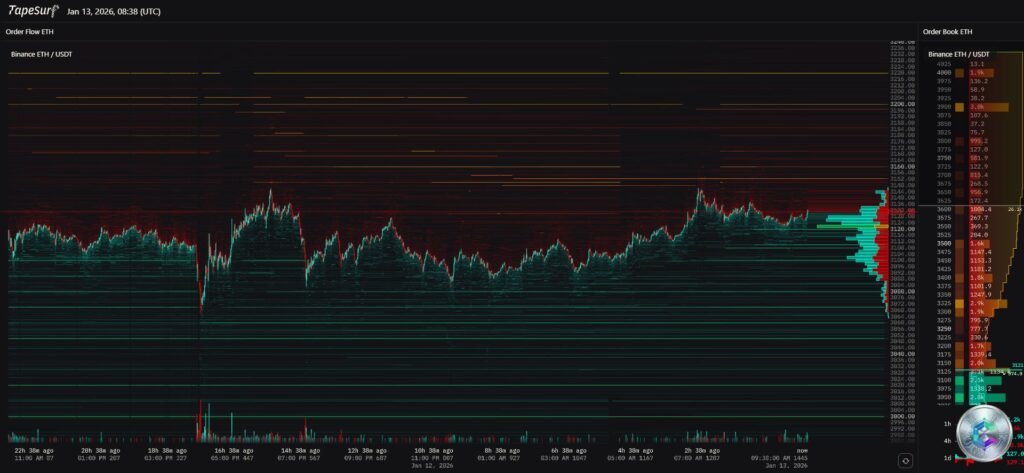
Analysis of liquidation heat maps reveals two critical zones:
- Downside: A first wall of liquidations of approximately $784 million sits below $2,900. Lower, around $2,800, lies a massive deposit of $3 billion. This is the « death zone » where capitulation would be maximal.
- Upside: Approximately $923 million in short liquidations are identified above $3,100. The zone between $3,185 and $3,236 is particularly critical. A break beyond $3,236 would trigger a forced short covering loop (short squeeze) propelling the price toward $3,350.
Regulatory Risk: The Bank of Italy Study
A new fundamental element has emerged in the analytical landscape: the publication by the Bank of Italy of a study titled « What if Ether Goes to Zero? How Market Risk Becomes Infrastructure Risk in Crypto. » This document introduces the notion of « infrastructure risk, » arguing that Ethereum’s security intrinsically depends on the value of its native token.
The negative spiral mechanism described is simple but concerning: if ETH price falls below a certain threshold, validators could massively disconnect from the network to avoid operating at a loss. A decrease in the number of validators would reduce the network’s cryptographic security, exposing the blockchain to potential attacks. For financial institutions considering using Ethereum as a settlement layer, this represents a major operational risk.
Three Strategic Scenarios
Scenario 1: The « Liquidation Flush » (45% Probability)
Trigger: CPI higher than expected or technical break of $3,050 without volume.
Mechanism: Loss of $3,000 support, cascade of liquidations at $2,900, acceleration toward $2,800.
Opportunity: Placement of staggered buy orders between $2,750 and $2,850 to capture the capitulation wick.
Scenario 2: The Bullish « Squeeze » (35% Probability)
Trigger: CPI lower than expected or unexpected positive regulatory announcement.
Mechanism: Recapture of pivot at $3,170 with volume, seller coverage, triggering of short liquidations at $3,236.
Target: Rapid acceleration toward $3,350 – $3,400.
Scenario 3: Sideways Attrition (20% Probability)
Trigger: Neutral macro data, absence of catalyst.
Mechanism: Oscillation between $3,080 and $3,180, erosion of trader patience and option time value.
Recommendations for Professional Traders
- Immediate Caution: Avoid excessive leverage before CPI publication. Volatility is likely to be bilateral and violent.
- Key Levels to Monitor:
- Vital Support: $2,800. A weekly close below this level would invalidate the long-term bullish thesis.
- Reversal Pivot: $3,236. This is the trigger for a short-term trend change.
- Risk Management: Favor spot accumulation on deep pullbacks ($2,800 zone) rather than chasing bullish breakouts in this fragmented liquidity context.
Conclusion
Ethereum stands at a strategic crossroads where technical, macroeconomic, and regulatory signals are contradictory. The long-term structure remains potentially very bullish, but short-term flows are negative and the risk of massive liquidation is real. The market is seeking to « clean out » excessive leverage before being able to initiate a true directional trend.
In this environment, patience and precision in execution around identified liquidity zones will be the savvy trader’s best assets. The coming days will be decisive for Ethereum’s trajectory in Q1 2026.
Disclaimer: This article is published for educational and informational purposes only. It does not constitute investment advice or a buy or sell recommendation under any circumstances. Cryptocurrency markets are extremely volatile and carry significant risks of capital loss. Always conduct your own research (DYOR – Do Your Own Research) and consult a qualified financial advisor before making any investment decision. Leveraged trading carries high risks and is not suitable for all investors.