
The digital asset market is navigating a complex transitional period in early 2026, marked by a notable disconnect between retail sentiment indicators and institutional capital flows. While the Fear & Greed Index reads at an extreme 10, signaling panic among retail investors, Ethereum is displaying technical resilience that points to sophisticated accumulation by long-term players. This report delivers a comprehensive analysis of ETH’s situation on February 17, 2026, drawing on order flow data, multi-timeframe charts, and the latest fundamental developments.
Macro-Economic Dynamics and the Institutional Pivot
The total cryptocurrency market capitalization holds at $2.43 trillion, with Bitcoin commanding a 56.43% dominance versus Ethereum’s 9.88%. Despite this apparent stability, tectonic shifts are occurring beneath the surface.
The most significant development this quarter is the strategic pivot by Harvard Management Company, which reduced its Bitcoin ETF exposure to establish a major position of 3,870,900 shares in BlackRock’s iShares Ethereum Trust (ETHA), valued at approximately $86.8 million. This move is not isolated; it reflects a broader institutional diversification trend toward Ethereum, viewed not merely as a financial asset but as essential technological infrastructure for decentralized finance (DeFi) and real-world asset (RWA) tokenization.
This transition is fueled by growing regulatory clarity, particularly as the Clarity Act is being examined in the U.S. Senate. Its potential passage in Q1 2026 could remove the final barriers for corporate treasuries. As a result, U.S. Ethereum ETF net flows have resumed growth, recording $10.26 million in inflows on February 13th, reversing a massive outflow trend seen earlier in the month.
| Institutional Indicator | Value / Detail |
|---|---|
| ETH ETF Net Flows (Feb 13, 2026) | +$10.26M |
| Cumulative ETH ETF Inflows | $11.65B |
| Total ETF Assets Under Management | $11.72B |
| Harvard Position (ETHA) | 3.87M shares (~$86.8M) |
| ETH Market Dominance | 9.88% |
Daily Chart Technical Analysis
The daily chart reveals a descending wedge market structure — a typically bullish reversal pattern that forms as price records progressively lower highs and lows, with converging trendlines signaling exhaustion of selling pressure. Ethereum has been under sustained pressure since its 2025 peaks, losing approximately 7% in January 2026, which starkly contrasts with its historical seasonal tendency to post a median gain of 32% in that month.
Price is currently trading below its main moving averages, notably the EMA 231, confirming long-term bearish control. However, a recent liquidity sweep below the $1,800–$2,000 zone was followed by an aggressive reclaim, suggesting buyers identified significant value in this demand area. The « Buy Power » indicator reads 61, signaling latent buying pressure, while the daily RSI stabilizes around 37, displaying a nascent bullish divergence as RSI no longer follows new price lows.
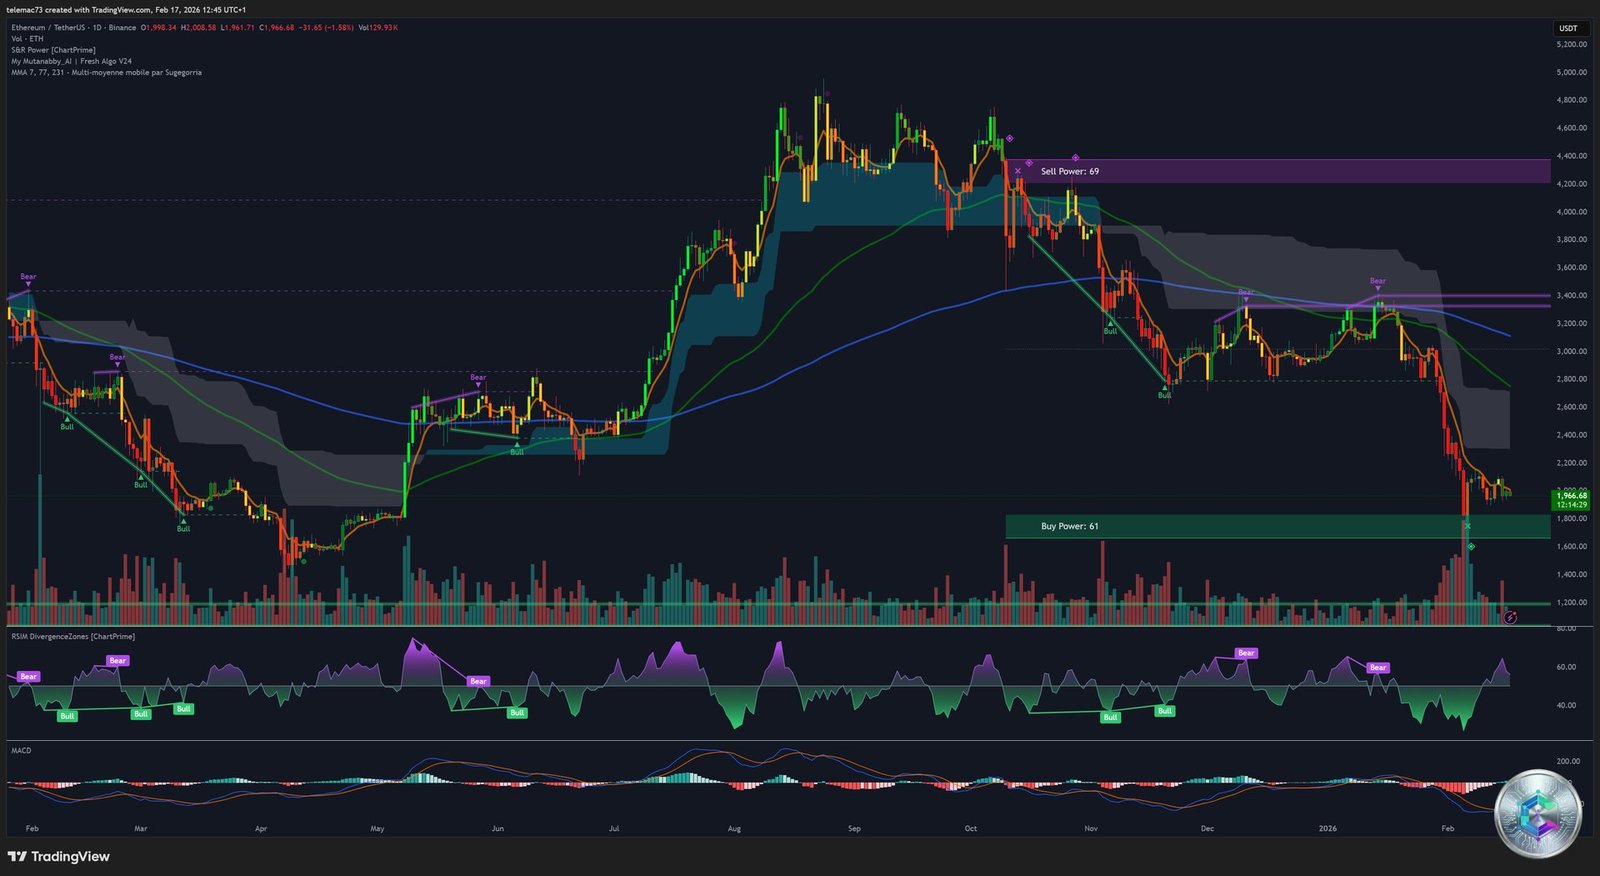
| Level (Daily) | Price (USD) | Technical Characterization |
|---|---|---|
| Critical Resistance | $3,447 | Tipping point for a bullish trend reversal |
| Psychological Resistance | $3,000 | Major distribution threshold |
| Momentum Pivot | $2,100–$2,300 | Former support turned major resistance |
| Demand Support | $1,800–$1,900 | Whale accumulation zone |
| Macro Floor (2025) | $1,385 | Last line of defense before macro capitulation |
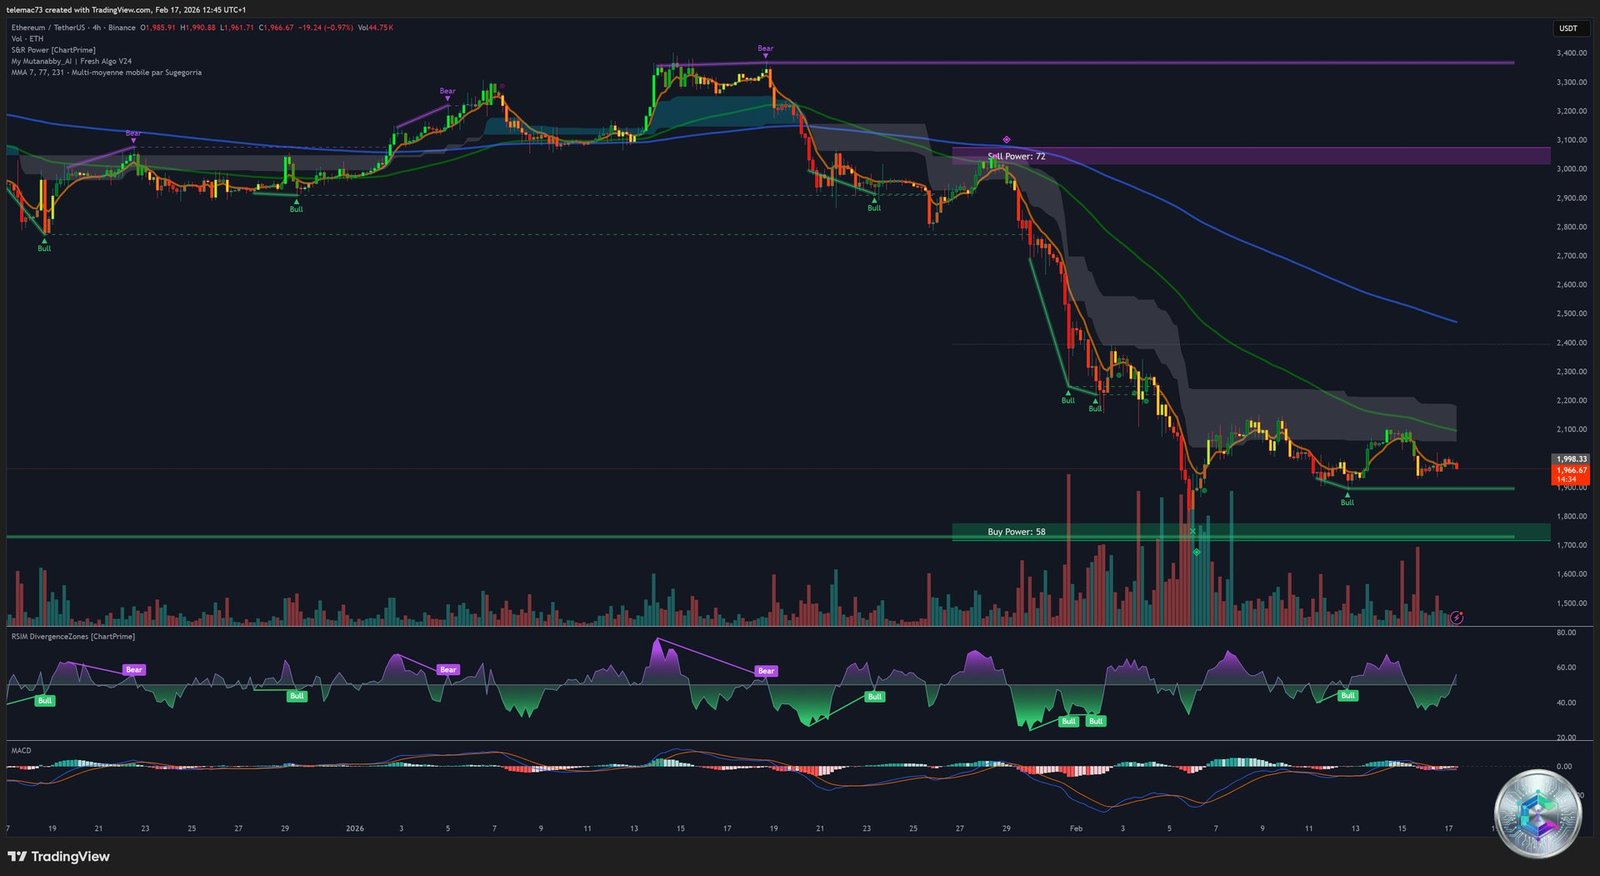
4-Hour Chart Technical Analysis (H4)
The 4-hour chart provides a more granular view of rejection and absorption zones. Two well-defined resistance zones are visible: the first between $3,000 and $3,100, and the second between $3,350 and $3,450. These zones were marked by « Sell Power » readings of 72 during prior tests, confirming heavy short-seller activity.
Conversely, the lower portion of the chart shows a green « Buy Power » zone at 58, just above the $1,750–$1,800 support, which served as the base for the current rebound toward $2,000. The 4-hour MACD is showing signs of bearish momentum exhaustion, with histograms starting to contract toward the zero line. A confirmed bullish crossover is still needed to validate an extension toward the $2,100 pivot.
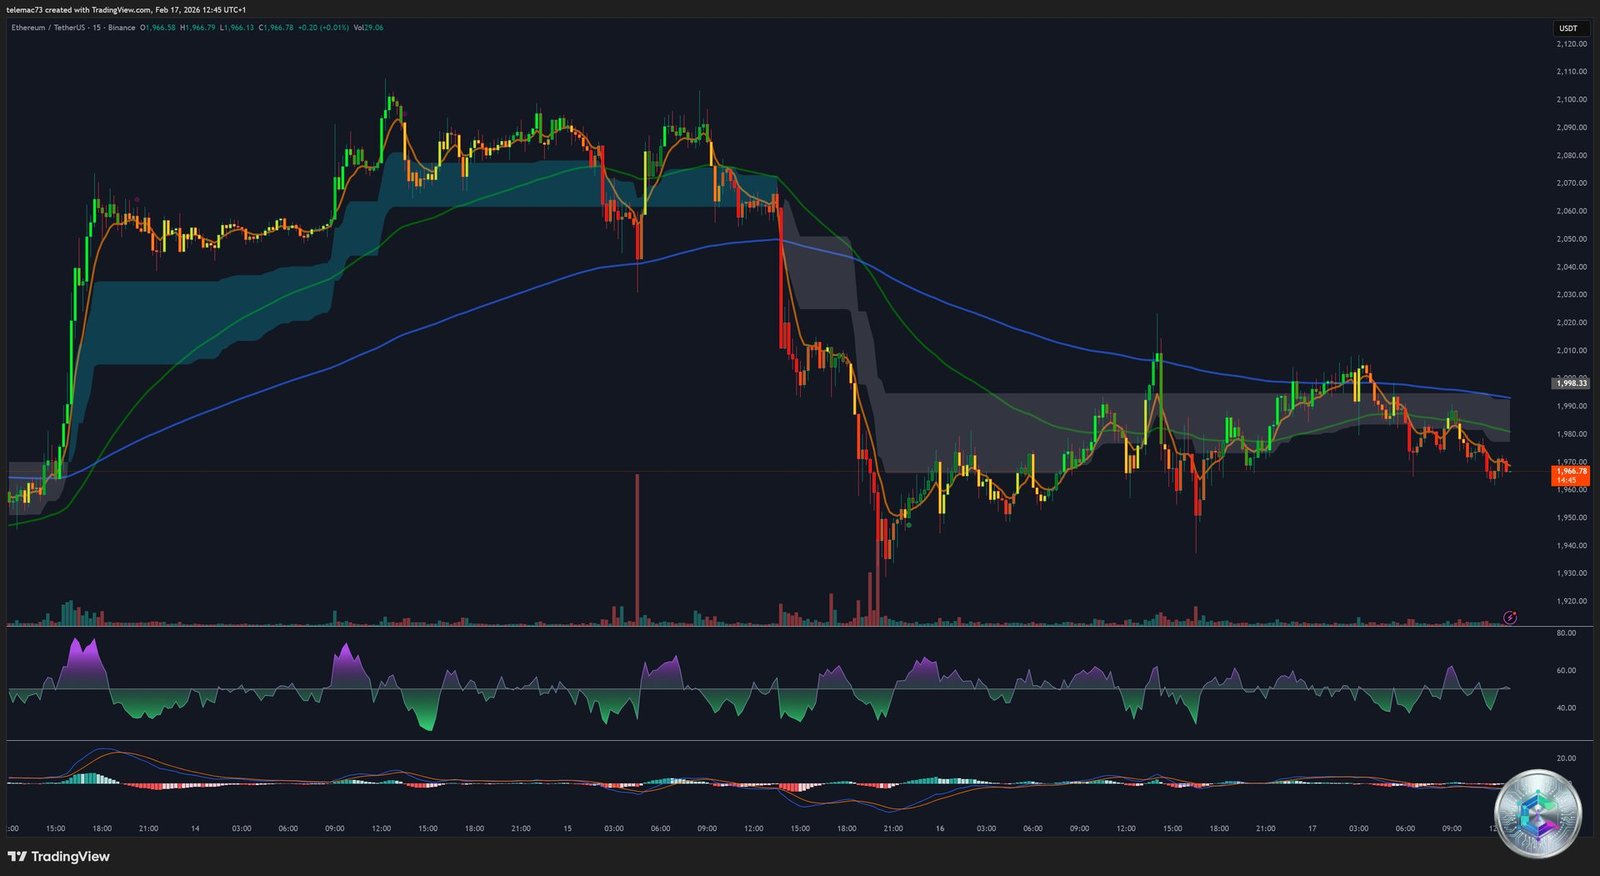
15-Minute Intraday Analysis (M15)
The 15-minute chart illustrates recent volatility and market indecision. Following a sharp drop, price has entered a tight consolidation phase between $1,960 and $2,020. RSI Divergence indicators flag several potential bounce points, suggesting that every dip below $1,980 is being treated as a short-term buying opportunity by algorithmic traders.
The neutral zone between $1,980 and $2,000 is characterized by low volume, reflecting broad market hesitancy ahead of the next macro announcement or network update. A break above $2,030 on this timeframe would be the first signal of intent to test the $2,100 resistance.
Heatmap and Order Flow Analysis
The Heatmap analysis provided by TapeSurf is essential for understanding where real liquidity sits, beyond price candles. Warm colors (red and orange) represent concentrated sell order clusters, while cool colors (green and blue) indicate massive buy-side interest.
On Ethereum, a very dense sell wall between $2,050 and $2,150 explains the price’s difficulty in breaking through this level in recent days. Conversely, significant « buy walls » are visible at $1,900, $1,800, and $1,500, acting as price magnets on any dip but also as robust structural supports. Notably, whales have accumulated 840,000 ETH since February 4th, confirming a deliberate accumulation strategy on pullbacks.
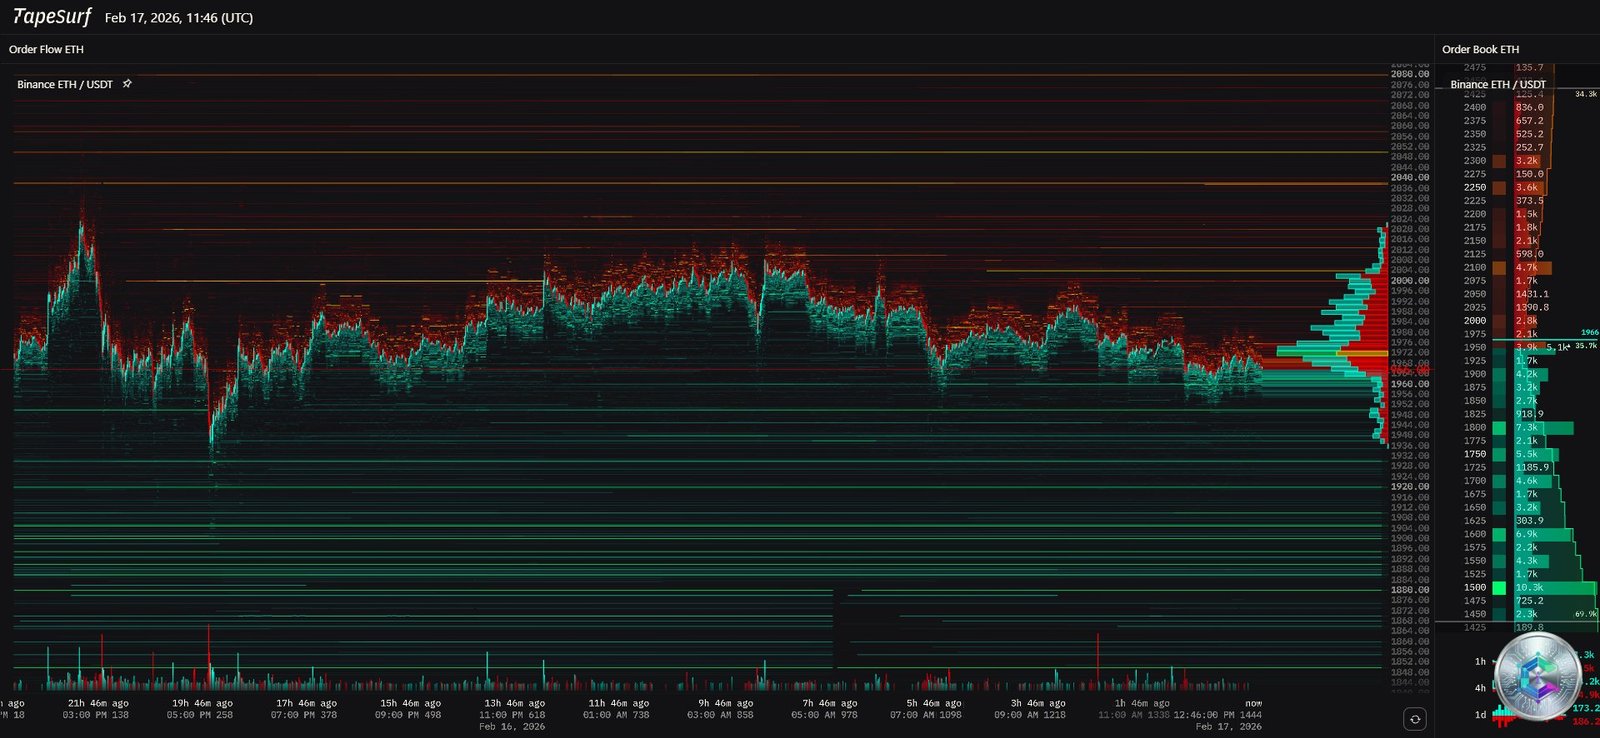
| Liquidity Zone | Order Type | Price Impact |
|---|---|---|
| $2,100–$2,200 | Massive sell (red walls) | Major resistance, rejection zone |
| $2,050 | Intermediate sell | Local resistance, profit-taking |
| $1,920–$1,950 | Intermediate buy | Local support, scalping zone |
| $1,800–$1,850 | Massive buy (green cluster) | Structural support, accumulation zone |
| $1,500 | « Capitulation » Support | Ultimate psychological and technical floor |
The Technology Roadmap: Glamsterdam and Hegota
One of the most powerful fundamental drivers for Ethereum in 2026 is its shift to a bi-annual upgrade cycle, designed to stabilize the network and provide technological visibility to institutional partners.
Glamsterdam (H1 2026)
Scheduled for May or June 2026, the Glamsterdam upgrade is a landmark step for Layer 1 (L1) efficiency. Its cornerstone is the implementation of EIP-7732, known as Enshrined Proposer-Builder Separation (ePBS). This native integration will reduce centralization risks and make the MEV (Maximum Extractable Value) market fairer and more transparent.
EIP-7928 will introduce Block-Level Access Lists (BALs), enabling parallel processing of non-conflicting transactions. The gas limit per block is expected to rise from 60 million to 200 million — an increase of over 230% — driving a structural reduction in transaction fees.
Hegota (H2 2026)
Hegota will focus on state management and long-term network sustainability. The headline feature is the introduction of Verkle Trees, which will drastically reduce storage requirements for validators, making it feasible to run nodes on less powerful hardware (statelessness). This upgrade will also include history expiry mechanisms (EIP-4444), ensuring the network doesn’t become too heavy as it ages.
| 2026 Upgrade | Key Features | Expected Impact |
|---|---|---|
| Glamsterdam (H1) | ePBS, Parallel Execution (BALs), Gas Increase | MEV Transparency, Enhanced L1 Scalability |
| Hegota (H2) | Verkle Trees, History Expiry, Statelessness | Greater Decentralization, Node Lightweighting |
Network Fundamentals: Staking and Deflationary Supply
Despite price weakness, Ethereum’s on-chain fundamentals are at all-time highs. Over 30% of the total ETH supply is now staked, removing a massive volume of tokens from active circulation. The stablecoin ecosystem, projected to reach $500 billion in the coming year, continues to rely heavily on Ethereum as its base settlement layer. Each transfer generates fees, a portion of which is burned per EIP-1559, reinforcing Ethereum’s case as ultra-sound money whose total supply shrinks during periods of high activity.
Adoption of Layer 2 solutions such as Arbitrum, Optimism, and Base has exploded, with total value locked (TVL) surpassing $47 billion, reinforcing ETH’s utility as a collateral and gas payment asset across the entire modular ecosystem.
2026 Price Scenarios
🟢 Bull Case
Championed by Standard Chartered, this scenario targets $7,500 by year-end. Catalysts include mass adoption by corporate treasuries following the Clarity Act, a successful Glamsterdam upgrade, and accelerating demand for ETH as a yield-bearing asset (staking yield). Some aggressive models even target $12,000 on a longer horizon.
🟡 Neutral / Consolidation Case
This scenario sees price rangebound between $2,100 and $3,200 for most of the year. Persistent retail weakness and the absence of an immediate « euphoria catalyst » could limit price appreciation even as fundamentals improve. ETH may continue to underperform Bitcoin until an altcoin season is triggered by a significant Fed rate cut.
🔴 Bear Case
A weekly close below the $1,750–$1,800 support would be a major structural failure signal. In this scenario, Ethereum could revisit 2025 lows at $1,400 or even $1,385. This would materialize in the event of a major security breach during a network upgrade or an unexpected macro shock triggering a flight to liquidity.
| Analyst / Institution | 2026 Price Target | Time Horizon |
|---|---|---|
| Standard Chartered | $7,500 | End of 2026 |
| Citi | $5,440 | 12 months |
| InsideBitcoins | $3,600 | Near-term (Q1) |
| Technical Bear Scenario | $1,400 | Medium-term |
Summary and Operational Conclusions
The technical and fundamental analysis of Ethereum on February 17, 2026 suggests we are at a major inflection point. The descending wedge structure on the daily chart, combined with aggressive accumulation by whales and institutions, indicates that the downtrend initiated in late 2025 is likely nearing its end. The market has been purged of weak hands, as evidenced by extreme fear readings, leaving behind a stronger and less leveraged investor base.
The $2,100–$2,300 pivot zone is the most critical area to monitor. A reclaim of this level would flip the market structure from bearish to bullish, likely triggering massive algorithmic buy orders. Near-term, the $1,900 support appears to be holding firmly, protected by visible buy walls on the liquidity heatmap.
In summary, Ethereum is transitioning from a speculative asset into a resilient, modular, institutional-grade financial infrastructure. The convergence of constrained supply, technological innovation (ePBS, parallelization), and growing interest from academic endowments like Harvard’s creates a powerful catalyst for a major asset re-rating over the coming quarters.
⚠️ Disclaimer: This article is written for educational and informational purposes only. It does not constitute investment advice, a recommendation to buy or sell, or a financial solicitation of any kind. Cryptocurrency markets are extremely volatile and carry significant risk of capital loss. Any investment in digital assets should be preceded by thorough personal research and, where appropriate, consultation with a qualified financial advisor. Only invest what you can afford to lose.