
This Wednesday, January 28, 2026, marks a decisive turning point for Ethereum as investors hold their breath ahead of the Federal Open Market Committee (FOMC) meeting. The market finds itself in a phase of extreme compression, trapped between contradictory technical forces and a macroeconomic environment laden with uncertainties. Let’s dive into a comprehensive multi-timeframe analysis that reveals the hidden dynamics of the ETH market.
The Macroeconomic Context: A Sword of Damocles Hanging Over Crypto
The market shows a 99.6% probability that the Fed will maintain rates in the 3.50% to 3.75% range. Yet it’s Jerome Powell’s speech that crystallizes all attention. The Trump administration is intensifying political pressure on the central bank, creating a significant risk premium on all speculative assets.
Historically, FOMC meeting weeks have been synonymous with bearish pressure on Ethereum. In 2025, the asset recorded declines after seven of the eight annual meetings, a pattern that raises legitimate questions about the market’s post-announcement reaction.
The US dollar is currently testing a critical support level that’s 17 years old, while precious metals capture most of the protective flows, leaving Ethereum in an uncomfortable consolidation zone below the psychological threshold of $3,000.
Daily View: The Struggle for Bull Cycle Survival

The daily chart reveals a precarious situation. Ethereum closed the last four months of 2025 in the red and threatens to complete a fifth consecutive month of decline in January 2026, an unprecedented losing streak since the 2018 bear market.
Currently stabilized around $3,021, the price shows a modest 24h gain of 3.19% but remains down 4.80% year-over-year. Structural analysis reveals two critical zones:
- « Buy Power » Zone: Between $2,600 and $2,750, serving as a rampart during recent bearish attacks
- « Sell Power » Zone: Massively anchored between $3,800 and $4,000, constituting the current glass ceiling
The primary trend remains technically bearish, with Ethereum trading below its major moving averages. A weekly close above $3,350 is necessary to invalidate this descending tops structure and restore sustainable bullish momentum.
4-Hour Horizon: Consolidation Before the Storm

The 4-hour chart offers a more granular view of immediate liquidity zones. We observe the price passing through the Ichimoku cloud, signaling total market indecision. Momentum indicators show signs of weakening, consistent with a pre-major event consolidation period.
Key levels identified:
- Major resistance: $3,350 (local top and strong selling pressure zone)
- Central pivot: $2,977 (current market equilibrium zone)
- Major support: $2,760 – $2,800 (strong institutional demand zone)
« Sell Power » at 72 on this timeframe indicates that selling pressure remains dominant as soon as the price approaches $3,400. Conversely, « Buy Power » at 53 shows buying force is present but still insufficient to initiate a true « short squeeze ».
Micro-Structure: 15-Minute Intraday Analysis
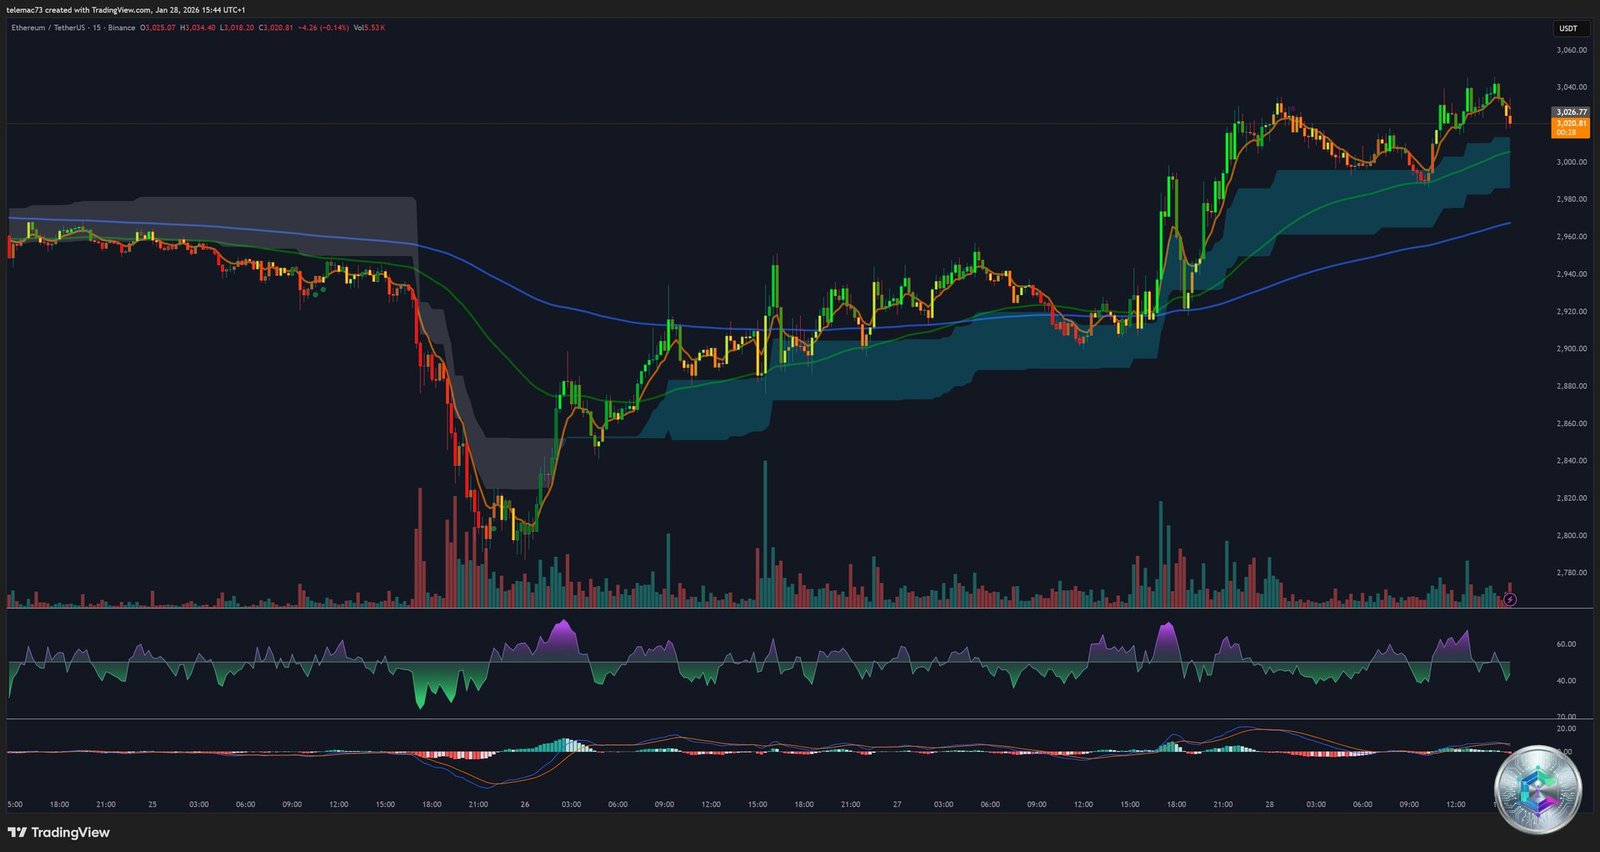
The 15-minute chart reveals a bullish micro-trend within the consolidation range, with the $3,015 level serving as the intraday pivot. Intense high-frequency trader activity manifests through multiple « Bull » and « Bear » signals generated by trend-following algorithms.
Price compression in a symmetrical triangle is a harbinger of imminent violent expansion. Realized volatility over 7 days has fallen to 31%, a level described as a « low regime » compared to the 90-day median of 59.4%. Historically, such periods of calm precede movements of 10 to 15% within 48 hours.
Order Flow: Decoding the Heatmap
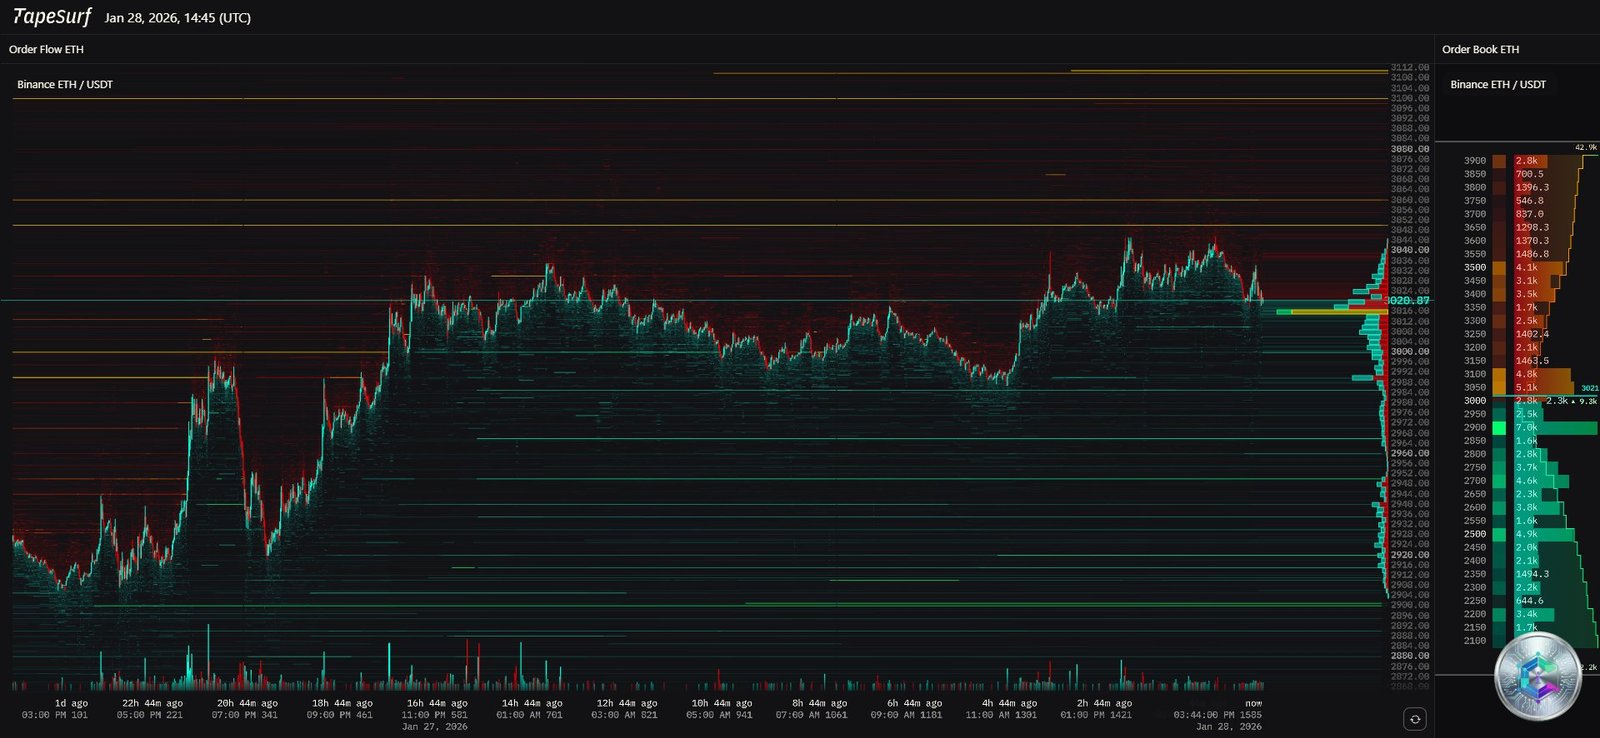
The Binance order book heatmap provides crucial information on institutional positioning. We observe a massive concentration of sell orders starting from $3,050 up to $3,200. These order walls act as physical barriers requiring a powerful external catalyst to be breached.
Below the current price, a dense support zone at $2,800 appears as January’s « institutional floor ». The presence of these orders suggests large holders are ready to accumulate in case of a pullback caused by FOMC volatility.
The « Taker Buy/Sell » ratio has shown extreme volatility in recent days, jumping from 0.86 on January 25 to 1.16, its highest level since February 2021. This brutal reversal indicates aggressive buyers are taking control, seeking to anticipate a bullish breakout from consolidation.
Record Leverage: A Double-Edged Sword
One of the major points of vigilance is the state of debt in Ethereum’s derivatives market. The « Estimated Leverage Ratio » on Binance has reached an all-time high with a 7-day moving average of 0.632. This means the proportion of debt-financed positions is at its peak.
Total Open Interest in the futures market stands at $84.13 billion, of which $22.95 billion is for Ethereum alone. A sharp price variation could expose between $5 and $8 billion in positions to forced liquidation, mechanically amplifying any directional movement.
Paradoxically, the Long/Short ratio has decreased to 1.74x despite recent price gains. This data is positive as it suggests traders have taken profits rather than persisting in overcrowded positions, reducing the risk of massive flushing.
Institutional Flows: Demand Returns via ETFs
The ETF channel has become the main influence vector for Ethereum’s price in 2026. During the second week of January, Ethereum ETFs recorded their largest inflows in three months, attracting $479 million. BlackRock’s ETHA fund captured $219 million alone.
Since the beginning of the year, net inflows to Ether ETFs amount to $584.9 million. Analysts emphasize that the majority of these flows represent conviction buying positions rather than arbitrage strategies, suggesting institutions are positioning ahead of increased regulatory clarity.
However, recent sessions have shown more erratic flows. On January 26, ETFs recorded a net inflow of $110 million after four consecutive days of outflows, driven by Fidelity’s FETH fund (+$137M), while BlackRock recorded redemptions.
2026 Outlook: Major Technological Updates
Beyond short-term considerations, Ethereum enters a pivotal technological year with two major planned updates:
« Glamsterdam » Update (First Half)
- ePBS (Enshrined Proposer-Builder Separation): Moving block construction logic directly into the protocol to reduce power concentration and limit censorship risks
- Gas Optimization: Introduction of block-level access lists to stabilize transaction fees
« Hegota » Update (Second Half)
- Verkle Trees: Reduction of node storage requirements by nearly 90%, enabling lighter and more decentralized nodes
- Post-Quantum Security: Integration of cryptographic primitives resistant to future quantum computers
This technological maturity constitutes a strong argument for institutional investors, consolidating Ethereum as a sustainable public financial infrastructure.
Scenarios for the Next 48 Hours
Bullish Scenario: The Institutional Short Squeeze
If Jerome Powell adopts a more accommodative tone than expected, Ethereum could:
- Absorb selling liquidity between $3,050 and $3,150
- Trigger forced liquidations of short positions thanks to high leverage
- Target the major resistance of $3,350, opening the way to $3,800 medium-term
Bearish Scenario: Leverage Capitulation
If the Fed maintains restrictive rhetoric and political uncertainties intensify:
- Support at $2,900 would give way, triggering a cascade of liquidations
- Price would seek the strong demand zone between $2,760 and $2,820
- A break below $2,700 would open the way to 2025 lows ($2,500 – $2,600)
Conclusion: Tense Stasis Before Unlocking
Ethereum finds itself in a phase of « tense stasis ». The technical structure is fragile, weighed down by excessive leverage, but institutional support via ETFs and the clarity of the technological roadmap offer a substantial safety net.
The central pivot level at $2,977 remains to be closely monitored during Jerome Powell’s press conference. The ability to maintain this level despite volatility would be a major signal of strength for the rest of the quarter. Conversely, any prolonged incursion below $2,900 would sound the death knell for hopes of an immediate bullish reversal.
Traders must exercise extreme vigilance over the next 48 hours as the market prepares to exit this compression with a potentially violent movement in one direction or another.
Disclaimer: This article is provided solely for educational and informational purposes. It does not constitute financial, investment, or trading advice in any way. Cryptocurrency markets are extremely volatile and carry significant risks. Any investment decision should be made after consulting with a qualified financial advisor and according to your personal situation. The author and cryptoinfo.ch cannot be held responsible for financial losses resulting from decisions made based on this article.