


Introduction: An Asset Caught Between Two Worlds
On May 16, 2026, Ethereum (ETH) stands at a critical crossroads. While its protocol reaches unprecedented technological milestones, its price — oscillating between $2,177 and $2,336 — tells a starkly different story: an asset crushed beneath a cascade of bearish signals, record liquidations, and relentless macro headwinds. This report dissects all the forces at play — macroeconomics, on-chain fundamentals, microstructure, and multi-timeframe technical analysis — to deliver a comprehensive situational assessment for traders and informed investors.
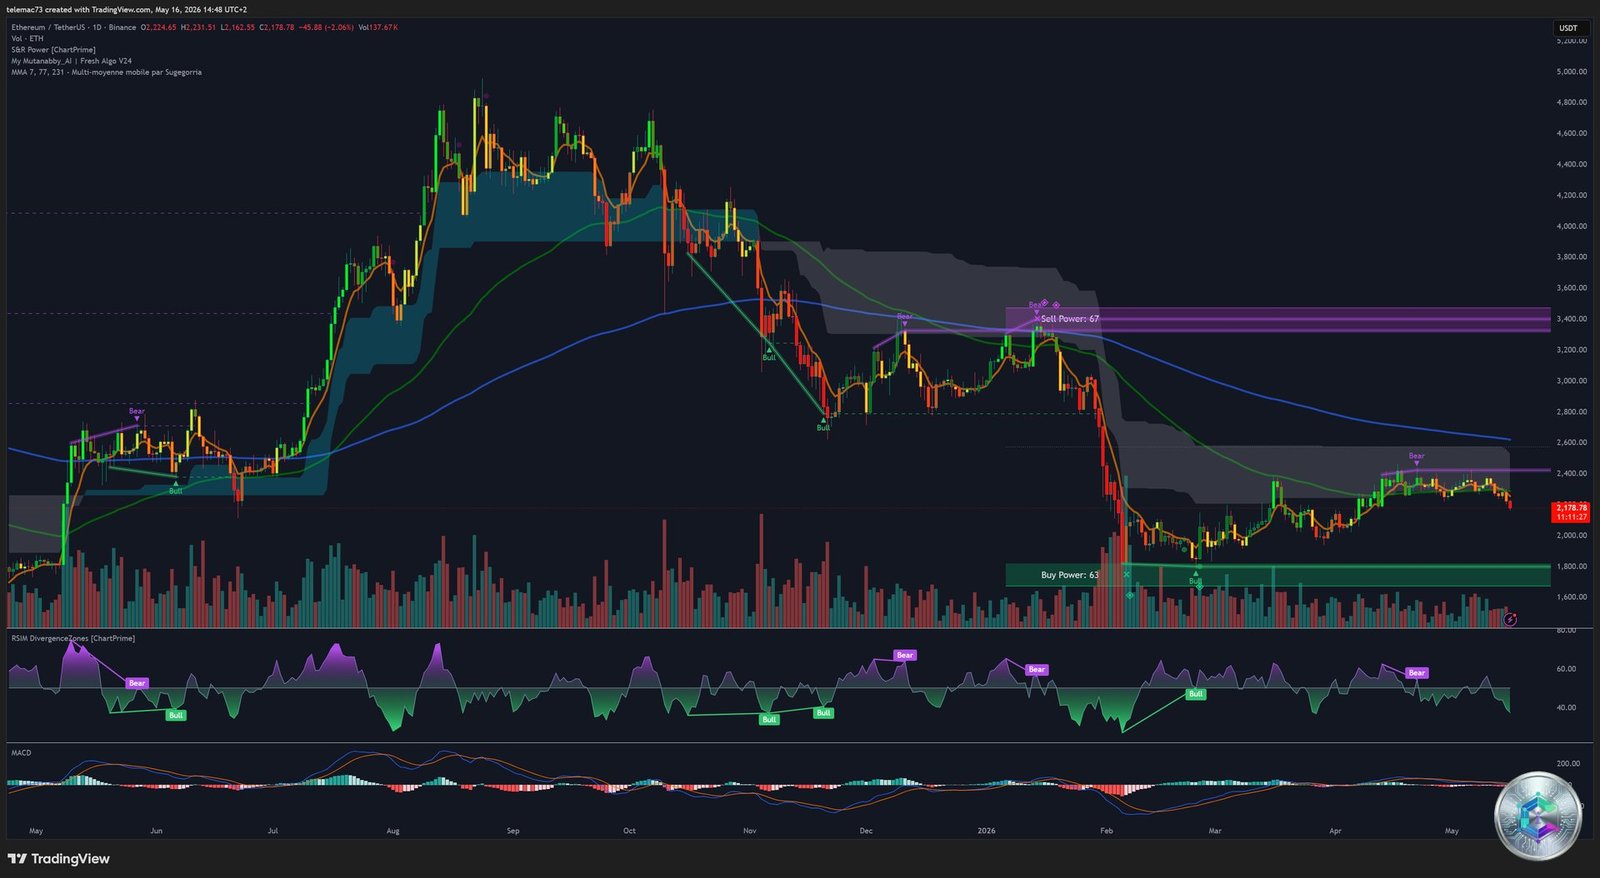
I. Macroeconomic Context: Generalized Risk-Off Sentiment
Geopolitical Tensions and Risk Aversion
The mid-May 2026 environment is dominated by a palpable risk-off sentiment across global markets. Diplomatic friction stemming from the Trump-Xi summit continues to fuel uncertainty, prompting institutional portfolio managers to reduce exposure to volatile assets in favor of dollar liquidity and government bonds. The Nasdaq registers an intraday decline of approximately 1.2%, dragging Ethereum lower in its wake as a high-beta asset. The Fear & Greed Index sits at 42/100 — neutral to slightly fearful — reflecting widespread hesitancy to deploy fresh capital into risk assets.
The CLARITY Act and the « Sell the News » Mechanism
On May 14, 2026, the U.S. Senate Banking Committee formally approved the CLARITY Act, a long-awaited regulatory framework for institutional digital assets. Paradoxically, this legislative breakthrough triggered a wave of profit-taking — the classic « Sell the News » dynamic. Institutional players who had accumulated positions in anticipation of the ruling exploited the resulting buyer-driven liquidity to offload holdings. Ethereum, structurally weaker than Bitcoin, bore the brunt of this selloff, exhibiting a sharper decline structure and more abrupt momentum deceleration.
Q2 Seasonality: An Ambiguous Historical Template
Historical Q2 performance for Ethereum reveals an extremely polarized return distribution over the past five years:
| Year | Q2 Return | Key Context |
|---|---|---|
| 2021 | +17.90% | Bull market, DeFi and NFT explosion |
| 2022 | -67.60% | Terra/Luna collapse, 3AC liquidation |
| 2023 | +6.12% | Shapella upgrade, post-crisis repair |
| 2024 | -5.80% | Restrictive rates, market apathy |
| 2025 | +36.50% | Pectra euphoria, post-weak Q1 rebound |
| Average | -2.58% | Disproportionate weight of 2022 black swan |
As of mid-May 2026, ETH registers a modest gain of approximately 5% since the start of the quarter — a fragile performance struggling against the weight of current macroeconomic headwinds. Seasonality alone cannot be invoked as a sufficient bullish catalyst to offset the ongoing technical deterioration.
II. Fundamentals: The Upgrades Shaping Ethereum’s Future
Glamsterdam (H1 2026): The Architectural Revolution
The landmark « Glamsterdam » upgrade introduces Enshrined Proposer-Builder Separation (ePBS, EIP-7732), formally separating block construction from validation at the consensus layer. This innovation eliminates MEV-driven distortions, democratizes validator revenues, and enables gas limits to surpass 100 million per block without imposing unsustainable hardware burdens on nodes. Expanded « blob » parameters further cement Ethereum’s rollup-centric roadmap, ushering in a new era of profitability for Layer 2 solutions.
Hegotá (H2 2026): Solving State Bloat
The « Hegotá » upgrade tackles the chronic problem of blockchain state inflation through Verkle Trees, a revolutionary cryptographic structure replacing Merkle Patricia Tries. These trees generate minuscule cryptographic « witnesses, » paving the way for stateless clients: anyone will be able to run a validation node on a standard laptop. The implementation of Fork-Choice Enforced Inclusion Lists (FOCIL, EIP-7805) provides structural censorship resistance, making Ethereum immutable even under regulatory pressure — a decisive argument for long-term institutional adoption.
The Strawmap Vision 2029: Engineering Targets, Not Sci-Fi
By 2029, the Ethereum Foundation targets transaction finality reduced to 6-16 seconds, L1 scalability approaching 10,000 TPS, native privacy via Zero-Knowledge Proofs, and post-quantum cryptographic primitives. While these objectives remain neutral for near-term price action, they guarantee Ethereum faces no risk of technological obsolescence relative to its competitors.
III. On-Chain Analysis: Supply Contracts, Prices Don’t Follow
Ethereum’s available supply on centralized exchanges has fallen to an annual low of 14.9 million ETH, the combined result of the EIP-1559 burn mechanism and the massive migration toward staking contracts. Over 39 million ETH are now locked in Beacon Chain validation contracts, yielding 3.5% to 4.5% annually. Paradoxically, this structural supply contraction fails to arrest the price decline: May 15, 2026 data indicates that staking deposit growth has reached a plateau, signaling exhaustion of patient capital as investors conclude the yield no longer adequately compensates for drawdown risk relative to traditional alternatives.
On the institutional flow front, the rotation of $50 million from ETH to BNB by a historical whale on May 16, 2026 illustrates the prevailing tactical uncertainty. This is countered by Jane Street‘s declaration of significantly increased direct Ethereum holdings at the expense of its Bitcoin ETF exposure — a deep signal that sophisticated institutions now treat ETH as an autonomous yield-generating asset class, akin to a global technology bond.
IV. Microstructure: Massive Liquidations and the Liquidity Heatmap
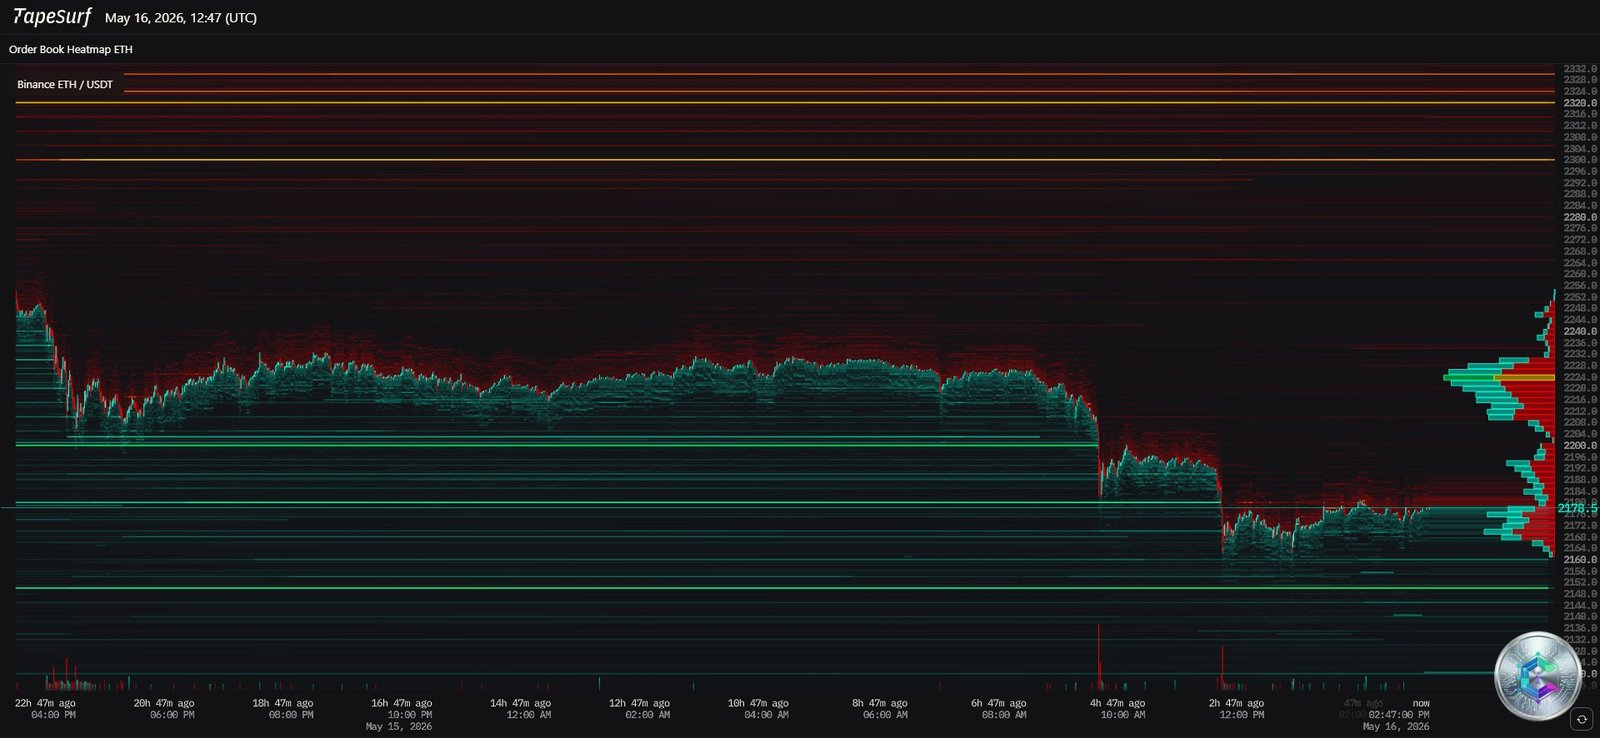
$57 Million Vaporized in 24 Hours: Anatomy of a Long Squeeze
Liquidation statistics over the 24 hours preceding May 16, 2026 are staggering. Across the entire crypto derivatives market, $324 million was liquidated across all assets. For ETH specifically, 3,240 accounts were wiped out, representing a total capital erasure of $57.52 million. The asymmetry of these liquidations reveals the market’s positioning error:
- 🔴 Long liquidations: $56.29M — leveraged buyers had their collateral swallowed
- 🟢 Short liquidations: $1.23M — sellers operate with absolute control
The climax of this purge was a single liquidation order of $9.28 million executed on Gate-ETH. This glaring imbalance diagnoses a classic Long Squeeze: leveraged buyers are themselves providing the liquidity required for the continued decline. The absence of any critical mass of over-leveraged short positions makes a short-squeeze recovery mathematically improbable in the near term — any rebound must be driven by organic spot demand, a rare commodity in the current risk-off environment.
V. Multi-Timeframe Technical Analysis
Daily Chart: The Death Cross Cements the Bear Market
The daily technical verdict is unambiguous: 12 sell signals from moving averages, zero buy signals. The composite sentiment score returns « Strong Sell. » Every moving average from MA 5 to MA 200 now acts as aggressive dynamic resistance:
| Moving Average (Daily) | SMA | EMA | Signal |
|---|---|---|---|
| MA 5 | $2,226 | $2,225 | 🔴 Sell |
| MA 10 | $2,225 | $2,225 | 🔴 Sell |
| MA 20 | $2,227 | $2,233 | 🔴 Sell |
| MA 50 | $2,256 | $2,248 | 🔴 Sell |
| MA 100 | $2,268 | $2,265 | 🔴 Sell |
| MA 200 | $2,294 | $2,285 | 🔴 Sell |
The most lethal technical event is the confirmed Death Cross: the MA 50 (~$2,249) crossing below the MA 200 (~$2,292). This signal confirms that short-term velocity has collapsed below the macroeconomic trend, triggering systematic liquidations from trend-following quantitative funds. Every price rally must be treated as a potential Dead Cat Bounce until the MA 200 is reclaimed with major expansionary volume.
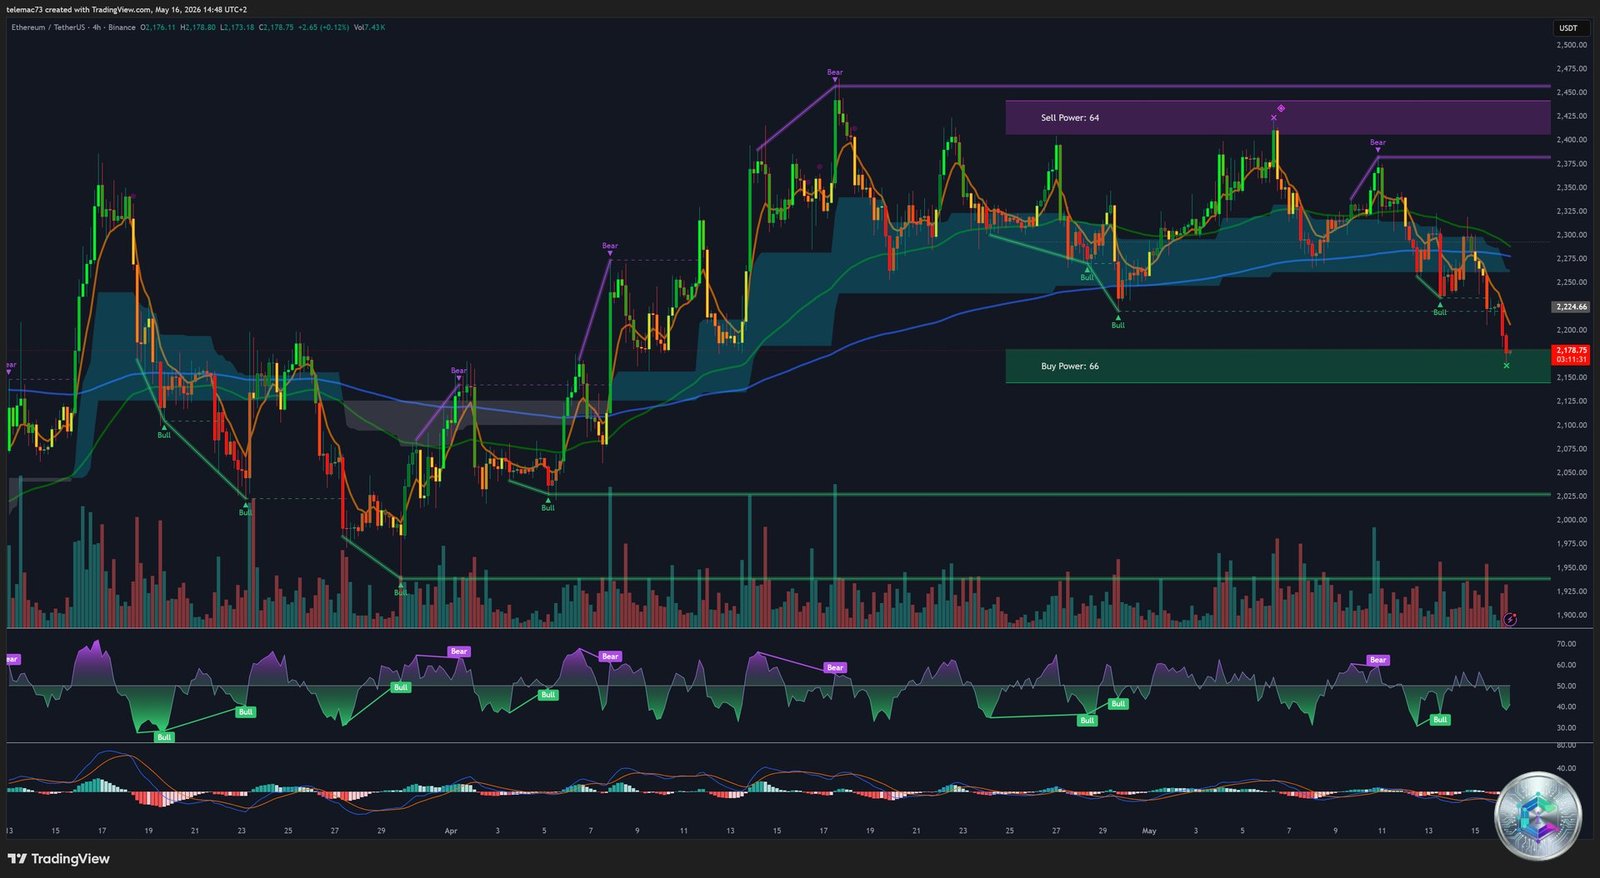
4-Hour Chart: The Glass Ceiling at $2,292-$2,300
On the H4 timeframe, Ethereum is imprisoned below a critical transition zone between $2,292 and $2,300. The Point of Control (POC) — the price level where the greatest volume of ETH has been exchanged — continuously drifts lower, evidencing ever-declining value acceptance by market participants. Ethereum’s chronic inability to initiate a clean structural repair — unlike Bitcoin, which staged sharper rebounds on May 14 — demonstrates persistently aggressive overhead supply. Until H4 candles begin closing and consolidating above this pivot level, any directional buying strategy remains equivalent to catching a falling knife.
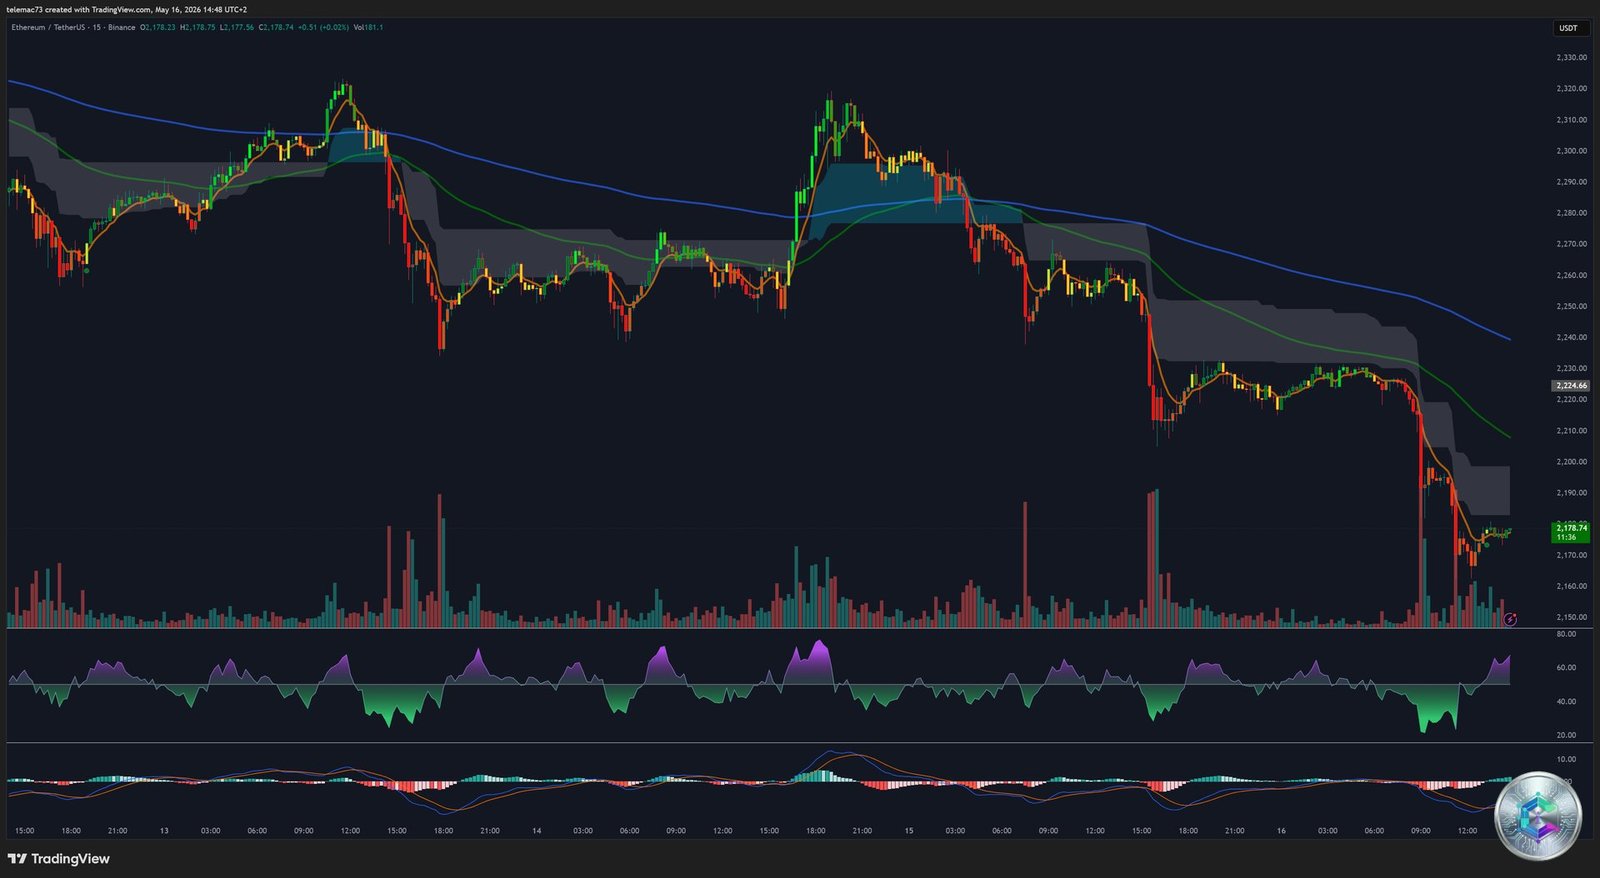
15-Minute Chart: Intraday Fracturing and Critical Levels
The M15 timeframe reveals the molecular mechanics of capitulation. Sell volume executed at the bid consistently overwhelms buy volume at the ask, widening the downside price range. Key levels to monitor:
- 🚫 Failed repair zone: $2,308-$2,310 — massive short-selling wall
- ⚠️ Short-term resistance: $2,275-$2,282 — must be reclaimed for any stabilization
- 🔴 Fractured zone: $2,266-$2,270 — former support converted to resistance
- 📉 Breakdown low: $2,240.5 — pivot triggering bearish acceleration
- 🆘 Daily abyss support: $2,227 — final bulwark before the technical void toward $2,000
VI. Momentum Oscillators: All Warning Lights Flashing Red
Every momentum indicator is flashing extreme oversold readings as of May 16, 2026. A critical caveat: in structurally downtrending markets, oscillators can remain « embedded » in oversold territory for weeks — they measure the speed of the decline, not the imminence of a reversal.
- Daily RSI (14): 19.32 — extreme oversold territory (threshold: 30). No bullish divergence detected on H4 or Daily.
- Daily MACD: reading between -8.61 and -18.77. Histogram expanding — bear momentum still accelerating.
- StochRSI (14): absolute value of 0 — total absence of buying propulsion over 14 periods.
- CCI (14): -218.37 — severe statistical deviation, far below the lower normality band (-100).
- Williams %R: -100 — absolute floor, pervasive seller dominance confirmed.
- Bull/Bear Power (13): -69.78 — crushing capitulation of buying power.
- ATR (14): 6.41-10.06 — low volatility. The market is grinding lower methodically, not panicking chaotically. V-shaped reversals are statistically improbable.
VII. Chart Patterns: From the Bullish Trap to Cascading Bear Flags
The May 5 Bull Flag Failure: Anatomy of a Bull Trap
Around May 5, 2026, Ethereum sketched a breakout from a classic Bull Flag pattern, with a technical projection toward $3,000. This breakout collided with a macroscopic descending trend line acting as the primary ceiling. The breakout transformed into a destructive Fakeout — a textbook Bull Trap. Breakout momentum traders found themselves instantly trapped in losing positions. Their forced capitulation, triggering a cascade of stop-loss orders, fueled the accelerated bearish decline that followed and directly explains the asset’s current structural degradation.
Cascading Bear Flags: The Geometry of Capitulation
The M15 and H4 landscape is dominated by the incessant formation of Bear Flags. Each vertical decline (flagpole) is followed by a lateral or slightly ascending consolidation (flag). This rebound phase is not healthy accumulation — it represents nothing more than a momentary easing of selling pressure allowing oscillators to cool, preparing the ground for the next distribution wave. The notable absence of compression triangles at cycle lows — structures indicating temporary equilibrium between buyers and sellers — confirms that sellers refuse to concede a single balance point. The market proceeds through successive vertical shocks, marking a unilateral capitulation of buy-side order flow.
VIII. Pivot Points and Objective Mathematical Levels
| Level | Classic Pivot | Camarilla Pivot | Woodie Pivot |
|---|---|---|---|
| R3 | $2,215.85 | $2,181.19 | $2,213.67 |
| R2 | $2,204.76 | $2,178.76 | $2,203.67 |
| R1 | $2,189.33 | $2,176.33 | $2,187.15 |
| Pivot Point (PP) | $2,178.24 | $2,178.24 | $2,177.15 |
| S1 | $2,162.80 | $2,171.46 | $2,160.62 |
| S2 | $2,151.72 | $2,169.03 | $2,150.63 |
| S3 | $2,136.28 | $2,166.60 | $2,134.10 |
Camarilla levels, tightly clustered between $2,166 (S3) and $2,181 (R3), define a hyper-local congestion zone suited for intraday scalping strategies. Standard deviation analysis confirms that the 1 SD range (68% probability) brackets prices between $2,175.16 (support) and $2,279.80 (resistance). A sustained close above the 3 SD resistance at $2,294.97 — nearly perfectly aligned with the daily MA 200 — would represent an absolute fractal regime change, instantly invalidating the entire current bearish thesis.
Conclusion: Absolute Patience and Clear Invalidation Levels
Ethereum in May 2026 is a deeply fragmented asset: architectural excellence on one side, mathematical price cruelty on the other. The Glamsterdam and Hegotá upgrades propel the protocol into an unrivaled league for high-security smart contract execution. Contracting circulating supply and progressive institutional adoption signals create a structurally supportive tension over the medium and long term.
However, the market currently defies fundamental logic. The toxic alignment of indicators — the daily moving average Death Cross, relentless bear flags on M15 and H4, and $56 million in long liquidations within 24 hours — categorically prohibits deploying directional long capital at this juncture. The technical invalidation level for the bearish thesis is precise and unambiguous: a high-volume, confirmed break above $2,292-$2,300 on the H4 chart, validated by multiple consecutive closes above that threshold. Absent this signal, gravitational risk toward $2,000 — and potentially $1,800 in an extreme macro deterioration scenario — remains the path of least resistance for an asset seeking total capitulation and structural rebirth.
⚠️ Disclaimer: This article is published for informational and educational purposes only. It does not constitute investment advice, a recommendation to buy or sell, or an inducement to take positions in financial markets. Cryptocurrencies are highly volatile assets carrying significant risk of capital loss. Always conduct your own research (DYOR) and consult a licensed financial advisor before making any investment decision.

