
As Bitcoin breaks through $96,000 and tests $98,000 for the first time in three months, the crypto ecosystem is going through a decisive turning point. This in-depth analysis combines multi-timeframe technical data, on-chain indicators, and macroeconomic catalysts to decode BTC’s trajectory toward the psychological threshold of $100,000.
Market Context: A Convergence of Bullish Signals
January 2026’s rebound is not merely a technical bounce. It results from a systemic convergence of several major catalysts profoundly transforming the market structure.
Macroeconomic Normalization
Recent U.S. economic data confirms a reassuring disinflationary trend. Overall inflation stabilized at 2.7% year-over-year, while core CPI declined to 2.6%. This dynamic validates expectations of Federal Reserve monetary easing during 2026, traditionally favorable for scarce assets like Bitcoin.
Regulatory Clarity: The CLARITY Act
The Digital Asset Market CLARITY Act represents a historic legislative breakthrough in the United States. By proposing to classify certain decentralized digital assets as « digital commodities » under CFTC supervision, the bill significantly reduces regulatory risk that previously hindered massive institutional adoption.
While procedural tensions persist – notably with Coinbase’s temporary withdrawal of support – the mere existence of advanced legislative debate signals the maturation of the crypto asset class.
Aggressive Institutional Accumulation
MicroStrategy recently acquired an additional 13,627 BTC for $1.25 billion, bringing its holdings to record levels. Meanwhile, Bitcoin Spot ETFs recorded net inflows of $1.7 billion over a short period in mid-January. This dual buying pressure creates a genuine supply shock mechanically supporting prices.
Multi-Timeframe Technical Analysis
Daily Perspective: Reversal Confirmation
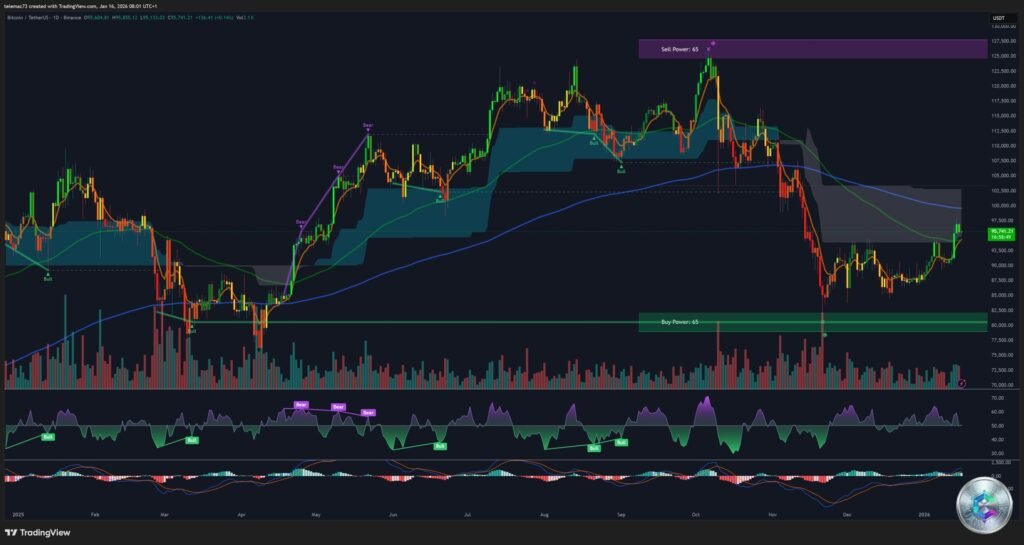
On the daily timeframe, Bitcoin has validated a decisive market structure shift. After testing deep support levels in late 2025, BTC broke the succession of lower highs by surpassing the pivot zone at $94,820. The chart now displays a classic uptrend configuration with ascending highs and lows.
Moving averages confirm this reading: price is trading above the 20 EMA, 50 SMA, and 100 SMA. The convergence of short-term averages around $95,000 – $96,000 creates a robust dynamic support zone, acting as a safety net for buyers.
The RSI indicator sits in positive territory without reaching extreme overbought levels, leaving room for an extension toward $100,000 before a necessary technical correction.
4-Hour Horizon: Sustained Momentum
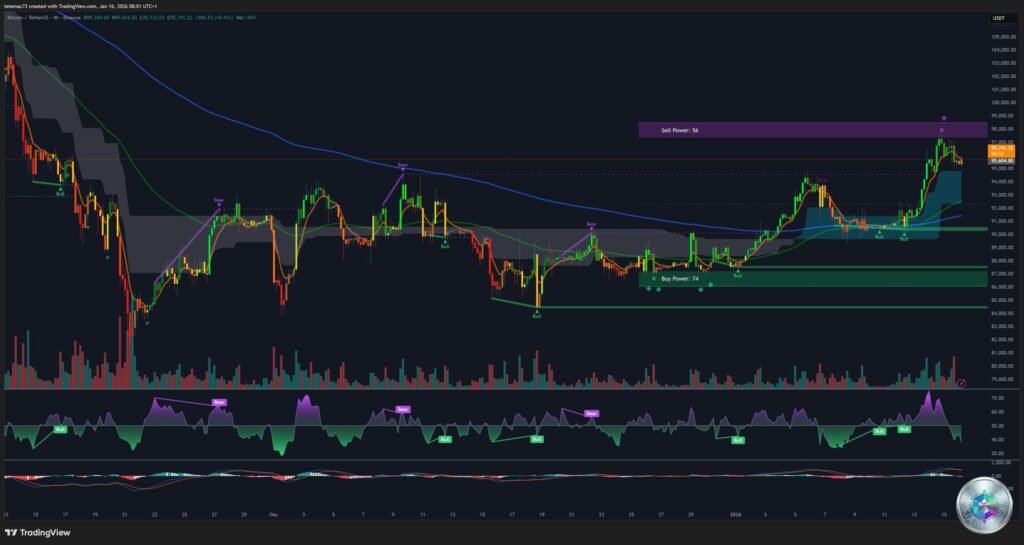
The 4-hour analysis reveals a perfectly defined bull channel since early January. A crucial technical element is the market’s ability to transform former resistance into support. The $95,000 zone, which acted as a ceiling in early January, has been successfully tested as a floor during recent pullbacks.
This « Support/Resistance Flip » phenomenon constitutes a strong marker of trend health. The price maintaining above $97,000 for several candles demonstrates market « acceptance » at these levels, forcing short sellers to cover positions and further fueling the rally.
Intraday Tactics: Battle in the $96,400 – $97,500 Range
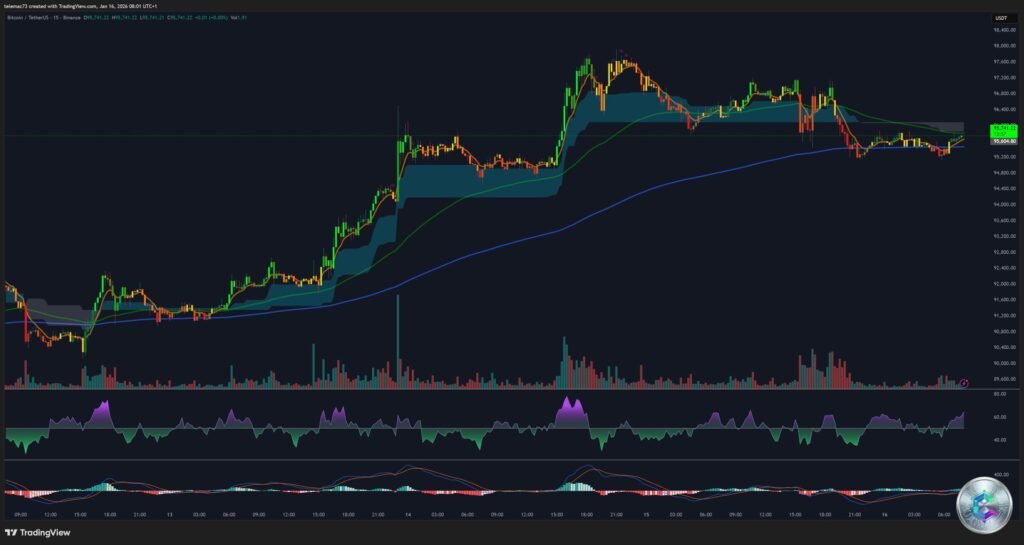
On the very short term (15 minutes), the market oscillates in a consolidation channel between $96,400 and $97,500. Candlestick wick analysis reveals immediate buying presence whenever price dips toward $96,400 – $96,500, indicating highly active buy-the-dip algorithms.
A confirmed breakout above $97,550 with significant volume increase would constitute the intraday technical signal of momentum resumption toward $98,200 then recent highs. Conversely, losing $96,200 could trigger a quick correction toward $95,500 via stop-hunting of leveraged long positions.
Market Depth and Liquidity Mapping
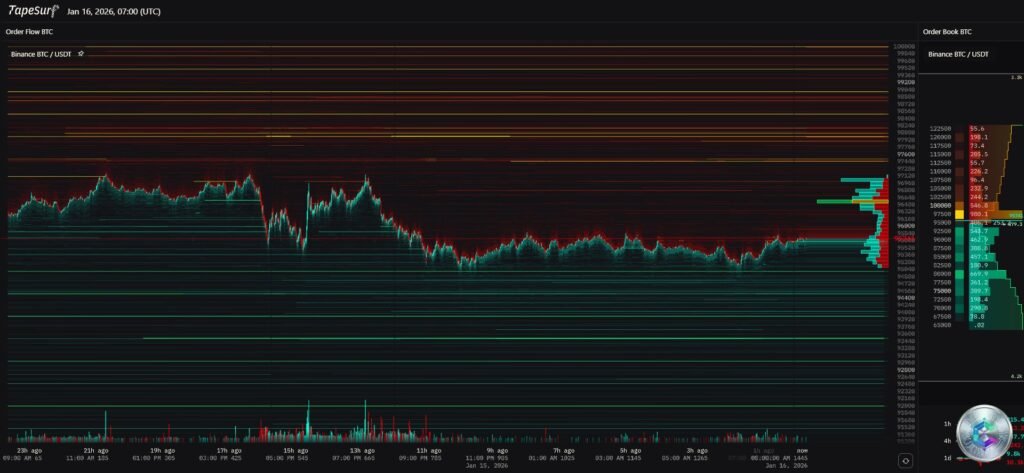
Liquidation data reveals the precise geography of risks for leveraged traders:
- Above Price: Massive liquidity concentration from short seller stop-losses accumulates toward $98,500 and intensifies considerably at the psychological threshold of $100,000. Breaking through $98,500 could trigger a violent « Short Squeeze » propelling price through the $99,000 zone to $100,000.
- Below Price: Clusters of highly leveraged long position liquidations are identifiable in the $95,000 – $94,200 zone. Breaking current support could trigger temporary bearish acceleration to « clean » excessive leverage before resumption.
Order Book Structure
Analysis of buy and sell walls confirms the trend’s structural solidity:
- Resistance: Resistance is relatively thin above $97,000, requiring little volume to cross this zone. However, a massive sell wall is positioned at $100,000, corresponding to convergence of institutional profit-taking and options barriers.
- Support: Significant limit buy orders are staggered around $95,000 and strengthen considerably toward $92,000. These buy walls act as shock absorbers in case of bearish volatility.
On-Chain Indicators: HODLers Aren’t Selling
The Value Days Destroyed (VDD) indicator sits at a historically low level of 0.53. This crucial metric indicates long-term holders aren’t taking advantage of the rise toward $98,000 to liquidate positions. The market is dominated by « young » coin exchange, while strong hands maintain their positions.
This HODLer retention reduces available supply and strengthens the underlying bullish structure. The Fear & Greed Index displays a score of 61 (Greed), signaling healthy but not yet euphoric optimism.
Key Levels to Monitor
| Type | Price | Analysis |
|---|---|---|
| Psychological Resistance | $100,000 | Major target. Massive sell wall. High volatility zone likely. |
| Intermediate Resistance | $98,500 | Potential Short Squeeze trigger. |
| Immediate Resistance | $97,500 | Intraday range high. Volume validation required. |
| Pivot Zone | $96,000 – $97,000 | Current acceptance and consolidation zone. |
| Key Support | $95,000 | Former breakout high. Moving average convergence. Critical support. |
| Structural Support | $92,000 – $92,500 | 200-day MA. Institutional reloading zone. |
| Critical Support | $90,000 | Psychological threshold. Invalidation if broken on close. |
Forecast Scenarios
Scenario A: The Push to 100K (Probability: 60-65%)
Current dynamics, supported by institutional buying and regulatory optimism, maintain pressure on sellers. Breaking $97,500 with volume would trigger short seller stops, propelling price toward $98,500 then $100,000 via retail investor FOMO effect.
Validation signal: H4 close above $97,500.
Scenario B: Liquidity Shakeout (Probability: 35-40%)
The market could be locally overextended. Leveraged long positions accumulated below $96,000 become a tempting target for algorithms. Failure to break $97,500 could trigger a tactical sell wave toward $93,800 – $94,200, cleaning excessive leverage before resumption.
Alert signal: H4 close below $95,000.
Operational Conclusion
Bitcoin’s technical profile on January 16, 2026 is resolutely bullish. The break of late 2025 corrective structures, validated by solid fundamentals, favors trend continuation toward $100,000. The $95,000 support remains the decisive pivot level: as long as it holds, the path to six figures remains open.
However, traders must maintain rigorous risk management facing expected volatility approaching this historic threshold. The $92,000 – $94,000 zone represents an excellent accumulation opportunity in case of healthy technical correction.
⚠️ Important Disclaimer
This article is published for strictly educational and informational purposes. It does not constitute investment advice, a buy or sell recommendation, or an incitement to trade. Crypto-asset markets present extreme volatility and significant capital loss risks. Any investment decision must be made after consulting a professional financial advisor and based on your personal situation, risk tolerance, and financial objectives. The author and cryptoinfo.ch disclaim all responsibility for potential losses resulting from the use of information contained in this article.