


On May 4, 2026, Bitcoin (BTC) is trading around $78,560, having briefly pierced the critical psychological threshold of $80,000 to reach a peak of $80,039. This bullish breakout ends weeks of painful consolidation and outlines a potential new expansion cycle. Paradoxically, the Fear & Greed Index remains anchored in cautious territory (40–45), revealing the deep fracture between retail market psychology and the silent action of institutional capital — the true engine powering this market.
🌍 Macroeconomic Context: The Stagflation Threat
The macroeconomic environment of May 2026 is dominated by the specter of stagflation — persistent inflation coupled with slowing growth. Geopolitical escalation in the Middle East has propelled WTI crude oil beyond $126 per barrel, feeding inflationary pressure that the Federal Reserve struggles to contain. The US CPI settled at 3.3%, forcing the Fed to adopt a firmly restrictive stance: the probability of a rate cut in June 2026 has collapsed to just 3.6%, with the consensus overwhelmingly (88.5%) favoring rates staying elevated until at least July.
In this theoretically hostile environment for risk assets, Bitcoin displays remarkable counter-intuitive resilience, trading above $78,000 despite dollar strength. The IMF has revised its 2026 global growth forecasts downward — and it is precisely this fragility of fiat fundamentals that reinforces Bitcoin’s narrative as a decentralized, immutable store of value, decoupled from monetary policy errors. Bitcoin’s historical correlation with the Nasdaq 100 is beginning to fracture, with the asset capturing an unprecedented asymmetric risk premium.
🏦 Institutional Accumulation: The Silent Supply Shock
The true explanation for Bitcoin’s resilience lies in a structural transformation of demand. US spot Bitcoin ETFs recorded net inflows of $2.44 billion in April 2026 — the best month since October 2025 — with BlackRock’s iShares Bitcoin Trust (IBIT) leading the charge, siphoning available liquidity from traditional exchanges. Block Inc. (Jack Dorsey) announced the acquisition of an additional 114 BTC in Q1 2026, bringing its total reserves to nearly 9,000 BTC (≈ $691M).
More significant still: according to Capriole Investments’ quantitative analysis, institutions are currently absorbing more than 500% of the daily mining supply. For every Bitcoin created by the protocol, five institutional buyers compete for ownership. This mathematical disproportion creates a structural supply shock whose historical effects have systematically preceded average gains of approximately 24%, theoretically projecting the price toward $96,000. Additionally, approximately 41,000 BTC were withdrawn from exchanges over the past two weeks, reinforcing Spot market illiquidity.
🔥 Market Microstructure: Reading the Liquidity Heatmap
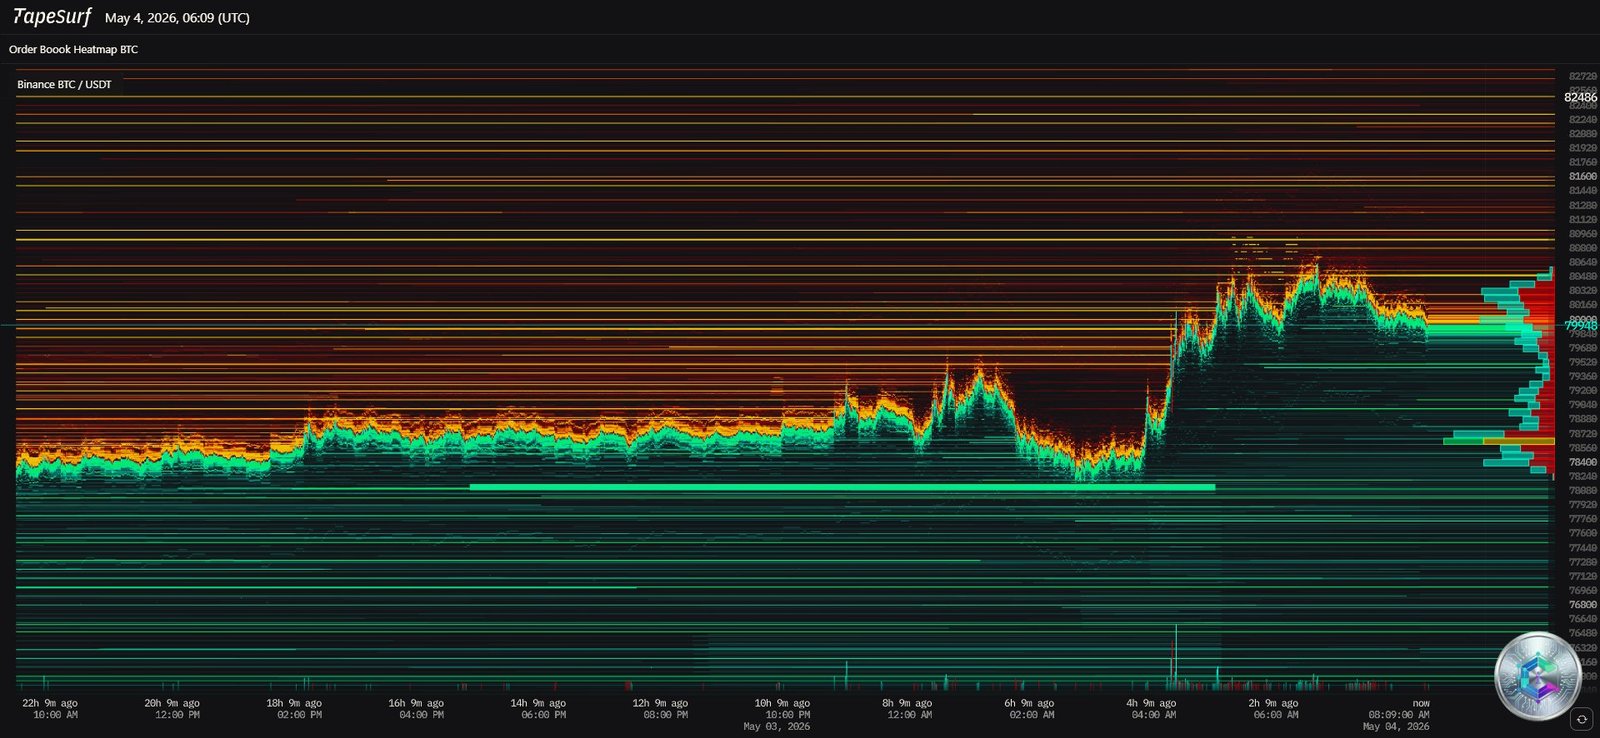
The liquidity heatmap provides a real-time X-ray of operator psychology. In the $77,800 – $78,400 zone, a thick bright green floor materializes a massive institutional Buy Wall, acting as an algorithmic safety net against any selling pressure. Conversely, the $80,000 – $82,000 range is striped with dense reddish bands representing significant Sell Walls ready to absorb any upside breakout attempt.
It is the explosive interaction between these opposing forces that generated the recent $80,039 peak and triggered a devastating Short Squeeze. Prior to this move, 62.8% of futures positions on Binance were oriented downward, with clusters of short liquidations (50x and 100x leveraged positions) concentrated just above $79,500 and $80,000. Piercing these levels forced short positions to cover by buying at market, feeding a mechanical and relentless upward spiral. Substantial sell-side liquidity pockets persisting above $80,400 make another liquidation cascade plausible on a sustained breakout.
📊 Multi-Timeframe Chart Analysis (Top-Down)
Daily Chart (1D): The Macro Structure
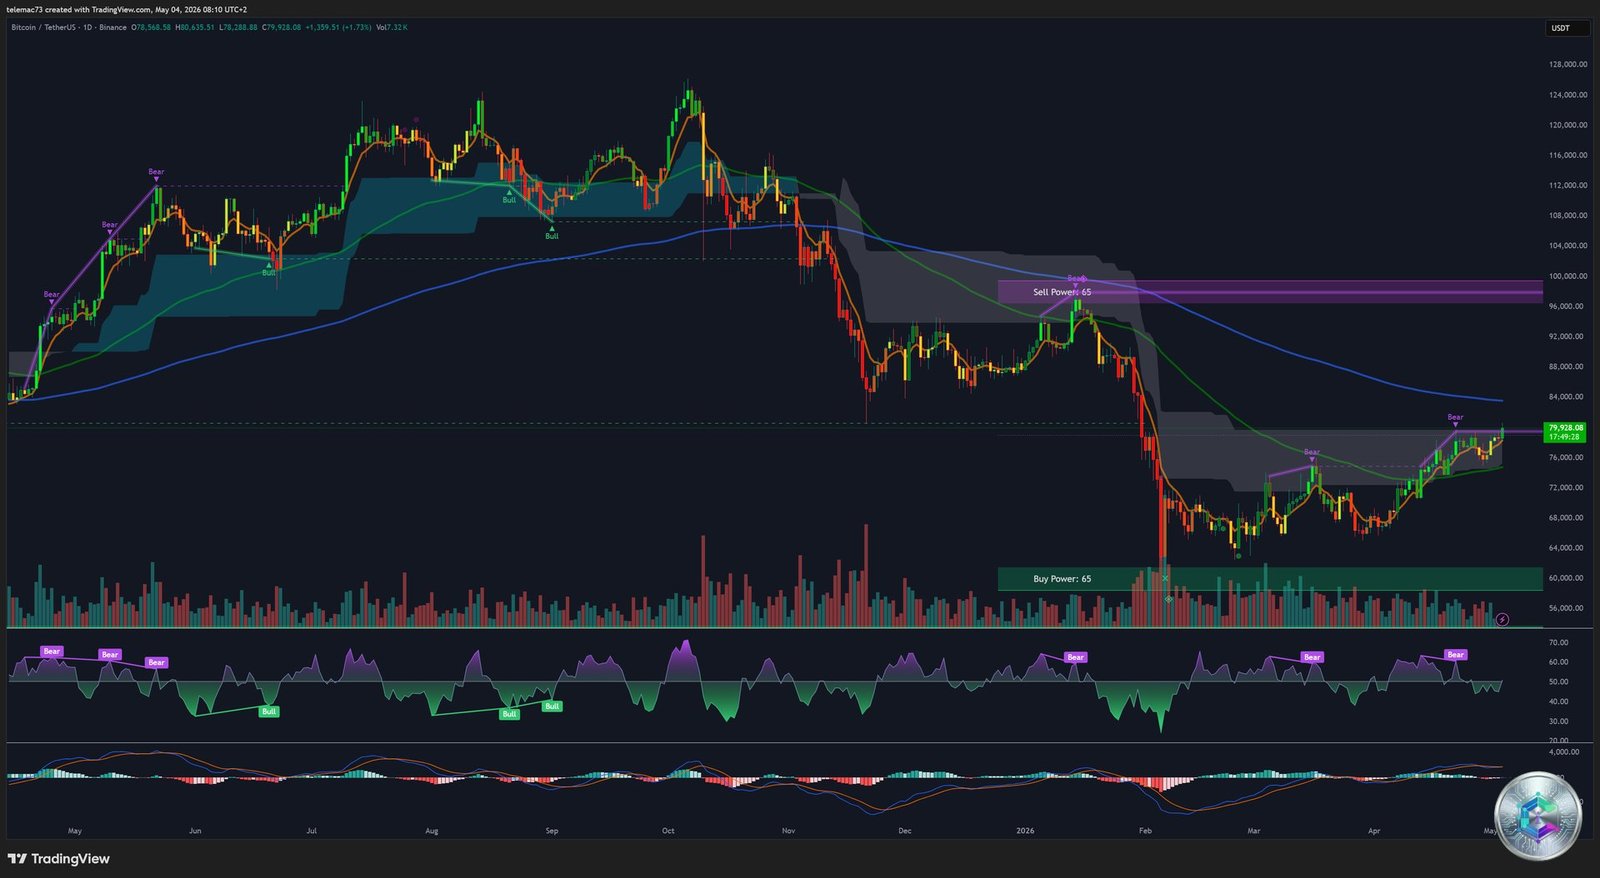
The daily chart reveals a large-scale bullish reversal structure. After a devastating bear market that found its capitulation floor around $60,000, Bitcoin is tracing a characteristic U-Bottom recovery. The price has just broken free from the macro descending resistance and is now approaching the top of the Ichimoku Cloud (Kumo) — a macro equilibrium zone whose conquest confirms the transition from a bearish to a bullish accumulation regime.
The daily MACD displays growing green histograms above the zero line, with a macro oscillatory Golden Cross in progress — an undeniable robustness signal. The daily RSI hovers between 55 and 65, far from overbought territory, leaving considerable room for organic appreciation. The recent breakout above $75,000 has mechanically invalidated the widely-followed Bear Flag pattern, transforming a weakness figure into a bullish propellant through the classic « Failed Pattern » phenomenon.
4-Hour Chart (H4): Intermediate Dynamics
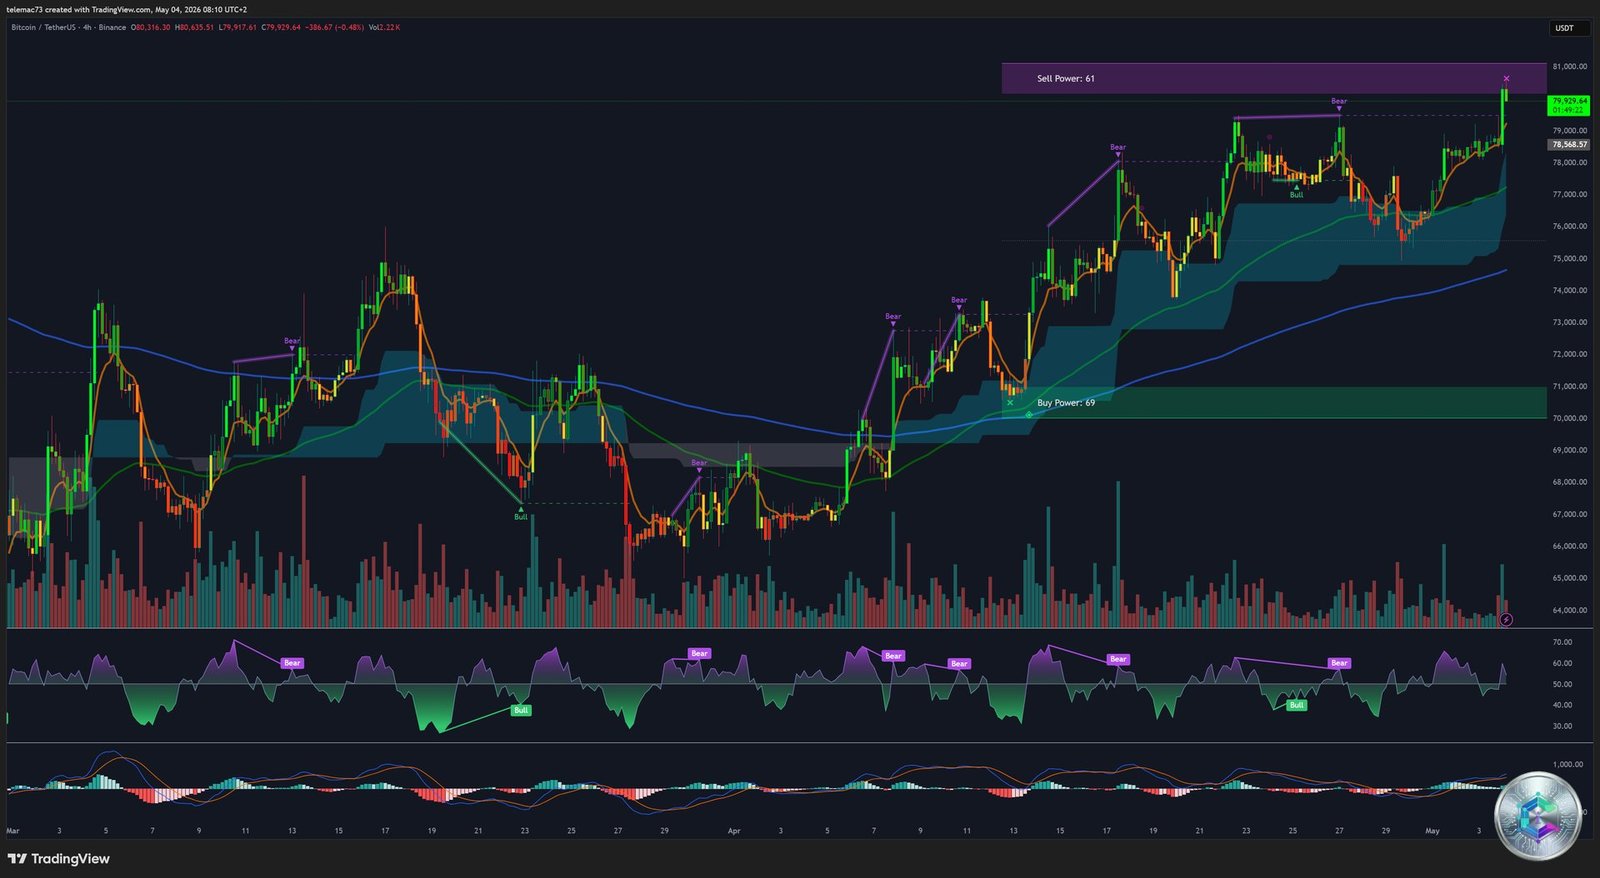
On the H4 timeframe, the ascending channel is peppered with violent « shake-outs » typical of institutional stop-hunting. Clear polarity zones structure the market: a « Buy Power: 69 » block solidly protects the $70,000 zone, while a « Sell Power: 61 » block caps the $80,000 level. The decisive battle for market direction unfolds between these two liquidity magnets.
Successive compression triangles preceded the last bullish impulse. The current structure — a slight lateral-downward drift following the $80,000 peak — closely resembles a local Bull Flag: an impulse mast followed by an oblique consolidation. A bullish breakout of the flag’s resistance line would signal the resumption of the directional trend. The H4 MACD shows flattening (temporal digestion) and the H4 RSI navigates toward 60: price correction through time, not price — classic signature of a healthy bull market.
15-Minute Chart (M15): Intraday Microstructure
On the M15 timeframe, the violence of the last bullish leg is eloquent: massive green candles accompanied by significant volume spikes confirm this rally is not a low-liquidity artifact. The M15 Ichimoku Cloud, thick and green, forms a dynamic support cushion — as long as price bounces off its upper surface, the ultra-short-term bias remains firmly bullish.
During the initial push, the M15 RSI pierced 80 (extreme overbought) before normalizing toward 50, accompanied by an M15 MACD Death Cross. This short-term signal reflects intraday profit-taking by scalpers — but must be interpreted in context: a bearish MACD and normalized RSI while price holds at $78,500 demonstrates anemic real selling pressure. The correction is mechanical and temporary, a prelude to a probable renewed assault on the highs.
📐 Key Levels Matrix: Supports and Resistances
| Technical Level | Price ($) | Significance & Implication |
|---|---|---|
| Ultimate Resistance (R3) | $81,917 | Target in case of generalized Short Squeeze — Price Discovery zone |
| Major Resistance (R2) | $80,415 | H4/D1 close above = validated paradigm shift, massive algo buying |
| Intermediate Resistance (R1) | $79,323 | First intraday ceiling — squeeze trigger if broken |
| Central Pivot | $77,821 | Center of gravity — structural bullish bias while price holds above |
| Primary Support (S1) | $76,729 | Dynamic safety net — base of H4 Bull Flag |
| Critical Support (S2) | $75,228 | Loss = Bull Flag invalidation and structural deterioration |
| Floor Support (S3) | $74,135 | Last short-term stronghold — liquidation panic if reached |
| Macro Pivot Zone | $72,400 | Daily MA50 alignment — vital medium-term line |
| Structural Macro Support | $65,670 | Foundation of the global bullish recovery structure since early 2026 |
🔮 Predictive Scenarios
✅ Bullish Scenario (Central Probability): The Short Squeeze
If price preserves the pivot at $77,821 and breaks R1 ($79,323), the market will enter an acceleration phase driven by forced short liquidations. A 4H or daily close above $80,415 (R2) would open the path toward $81,917 (R3), then price exploration at $85,000. Capriole Investments’ macro target, based on the 500% mining absorption rate, projects the price toward $96,000 over the medium term.
⚠️ Bearish Scenario (Tail Risk): The Macro Fake-Out
If upcoming US CPI/PPI data (mid-May) surprises to the upside and forces the Fed to further harden its rhetoric, a Fake-Out (false breakout) becomes possible. The warning signal would be a loss of the pivot at $77,821, followed by a bearish MACD crossover on H4 and cascading long liquidations (Long Squeeze). Bearish targets would then be S1 ($76,729), S2 ($75,228) and, in a capitulation scenario, the daily MA50 at $72,400 — marking a return to prolonged uncertainty.
Conclusion
May 4, 2026 marks a pivotal moment in Bitcoin’s valuation journey. The asset demonstrates remarkable structural maturity by stoically absorbing one of the most hostile macroeconomic environments of the decade. This resilience is explained by a fundamental paradigm shift: the transition toward inelastic institutional demand (ETFs, corporate treasuries) that permanently alters the supply/demand balance.
The Bear Flag invalidation, sustained hold above the central pivot, and extreme asymmetry in the derivatives market (62.8% short) constitute the catalysts for a potentially devastating Short Squeeze against short sellers. The decisive levels to monitor: preservation of $77,821 as the tactical floor, and successive conquest of $79,323 then $80,415 as necessary conditions for a parabolic rally toward new all-time highs.
⚠️ Disclaimer: This article is written exclusively for educational and analytical purposes. It does not constitute investment advice or a recommendation to buy or sell any financial asset. Cryptocurrency markets are highly volatile and carry significant risks of loss, potentially including the total loss of invested capital. Only invest what you can afford to lose entirely, and consult a licensed financial advisor before making any investment decision.

