


Bitcoin is navigating one of the most tense periods of its recent history this July 2026. Having shed more than half its value since its all-time high of $126,198 reached in October 2025, the top crypto asset has stabilized around $63,974 — caught between a relentless macroeconomic squeeze and the first signs of returning institutional appetite. Between restrictive monetary policy, a geopolitical shock in the Middle East, and a sweeping regulatory overhaul in the United States, here is a full breakdown of the forces shaping Bitcoin’s trajectory for the second half of 2026.
An unyielding Fed facing inflation that refuses to fade
Hopes for a rapid easing cycle — the same hopes that lifted risk assets through 2024 and 2025 — have run into stubborn statistical reality. The PCE index, the Fed’s preferred inflation gauge, reaccelerated to 4.1% in June 2026, well above the 2% target. As a result, the federal funds rate has stayed locked between 3.50% and 3.75% for four consecutive FOMC meetings.
Kevin Warsh’s arrival at the helm of the Fed has hardened the tone further. In testimony before Congress on July 14 and 15, he dismissed any notion of raising the inflation target and pledged that price increases would not be « permanent on my watch » — a stance bond markets immediately read as a commitment to keeping rates higher for longer, with half the committee even signaling room for a further hike before year-end.
Notably, one driver behind this stubborn inflation is the global rush into AI infrastructure. Massive data-center investment has sent electricity and component demand soaring, forcing manufacturers like Apple, Microsoft, and Dell to pass rising costs on to consumers. For Bitcoin, a yield-free asset, this tight monetary policy mechanically raises the opportunity cost of holding it versus US Treasuries — and squeezes miner profitability, already strained by surging operating costs.
The geopolitical shock: risk-off takes the wheel
In mid-July, military escalation between Iran and the United States added another layer of nervousness. Brent crude broke above $85, reviving fears of energy-driven imported inflation after a similar episode earlier in the year. On July 16, as Bitcoin tried to hold above $65,000, news of the strikes triggered a broad risk-off panic across financial markets, knocking the price back to $64,000.
This reaction highlights an important truth about the current cycle: facing the risk of open conflict, institutional capital still doesn’t treat Bitcoin as a safe haven comparable to gold. Instead, high-beta assets — crypto and tech stocks alike — remain the first to be liquidated during risk-off episodes.
The GENIUS Act: stablecoins go mainstream
July 18, 2026 marks the statutory deadline set by the GENIUS Act, which now governs the issuance of payment stablecoins in the United States. Six federal agencies — the OCC, FDIC, NCUA, Treasury, FinCEN, and OFAC — are finalizing a framework requiring strict capital standards and rigorous licensing for permitted issuers.
In the short term, this regulatory transition could create liquidity friction on exchanges, since stablecoins form the backbone of most trading pairs. In the medium term, however, the legitimacy conferred by this federal framework should ease the integration of stablecoins into the traditional banking system and pave the way for larger institutional capital flows into the crypto ecosystem, Bitcoin included.
Bitcoin ETFs: the end of a historic outflow streak?
The second quarter of 2026 will be remembered as one of the worst in the history of spot Bitcoin ETFs. After $2.4 billion in net outflows in May, June set an all-time record with $4.51 billion in net redemptions — a nearly $6.9 billion exodus in two months, the primary driver behind the price collapse toward $58,000 in late June.
But the tide appears to be turning. Led by BlackRock’s iShares Bitcoin Trust, the ETF complex logged three consecutive days of net inflows between July 14 and 16, totaling $368 million — a streak that ended eight straight weeks of outflows. Particularly encouraging: the $79.2 million that flowed in on July 16 came even as the market absorbed the shock of the Iranian strikes, suggesting institutional commitment that goes beyond short-term reaction.
Institutionalization is also diversifying: on July 16, T. Rowe Price launched its first actively managed multi-asset crypto ETF (TKNZ), deliberately underweight Bitcoin (40.75%) in favor of Ethereum, Binance Coin, and the Hyperliquid token — a sign that traditional managers are now hunting for alpha beyond Bitcoin alone.
On the whale side, a wallet dormant for 8.5 years moved 5,908 BTC ($383 million) on July 15 to an unknown address unconnected to any known exchange — more likely a custody restructuring than an imminent sale. Meanwhile, MicroStrategy paused its Bitcoin sales after shoring up its cash reserves, removing a significant source of selling pressure from the market.
Technical read: mapping the liquidity
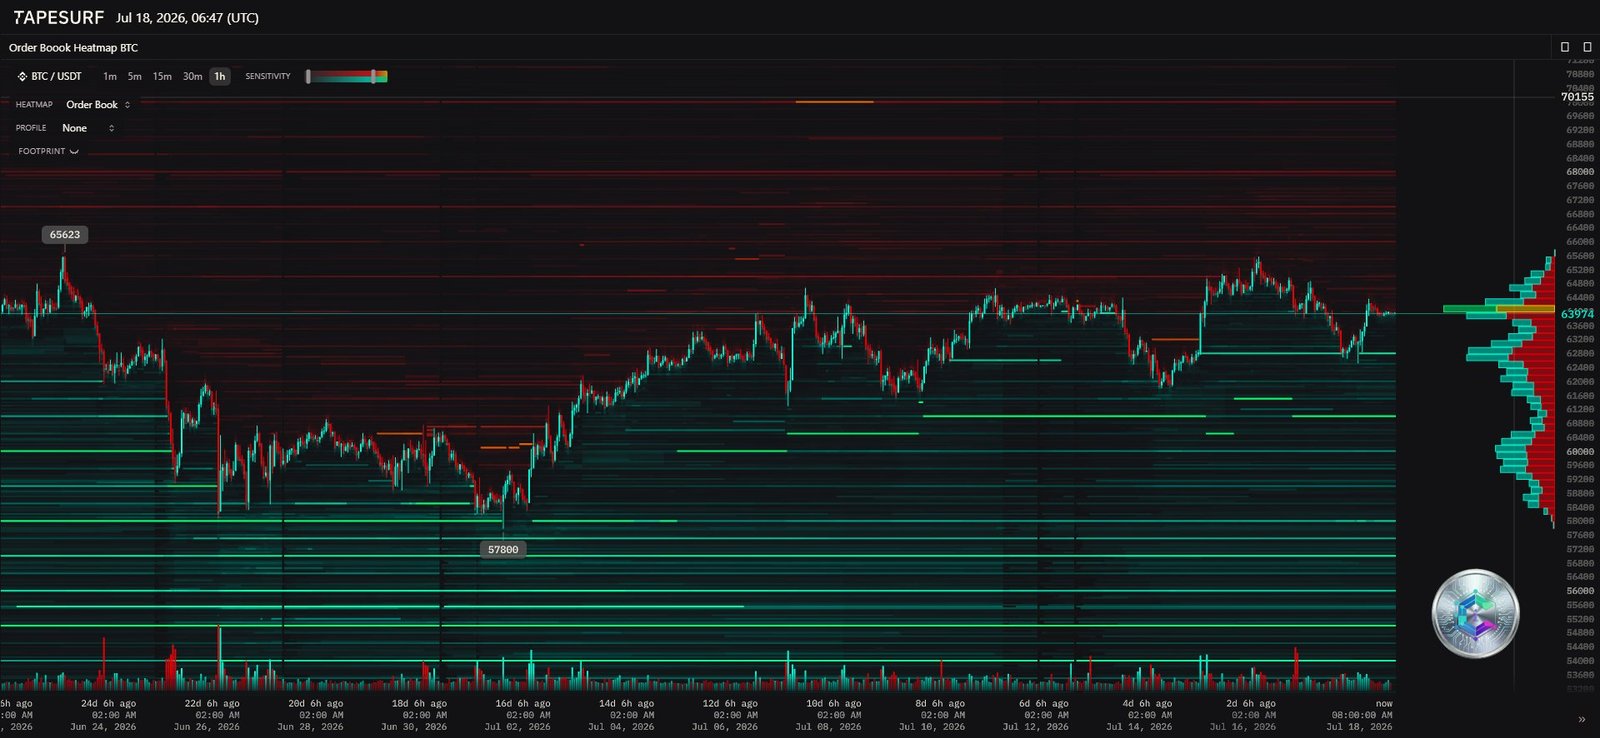
The order-book heatmap paints a clear picture: a dense wall of sell-side liquidity stretches from $65,000 to nearly $70,000, with an extreme concentration of sell orders at $65,623 — the level responsible for the recent double rejections. Buy-side liquidity below the current price is more diffuse, but a solid buying pole is visible at $57,800, matching precisely the 21-month low recorded in late June.
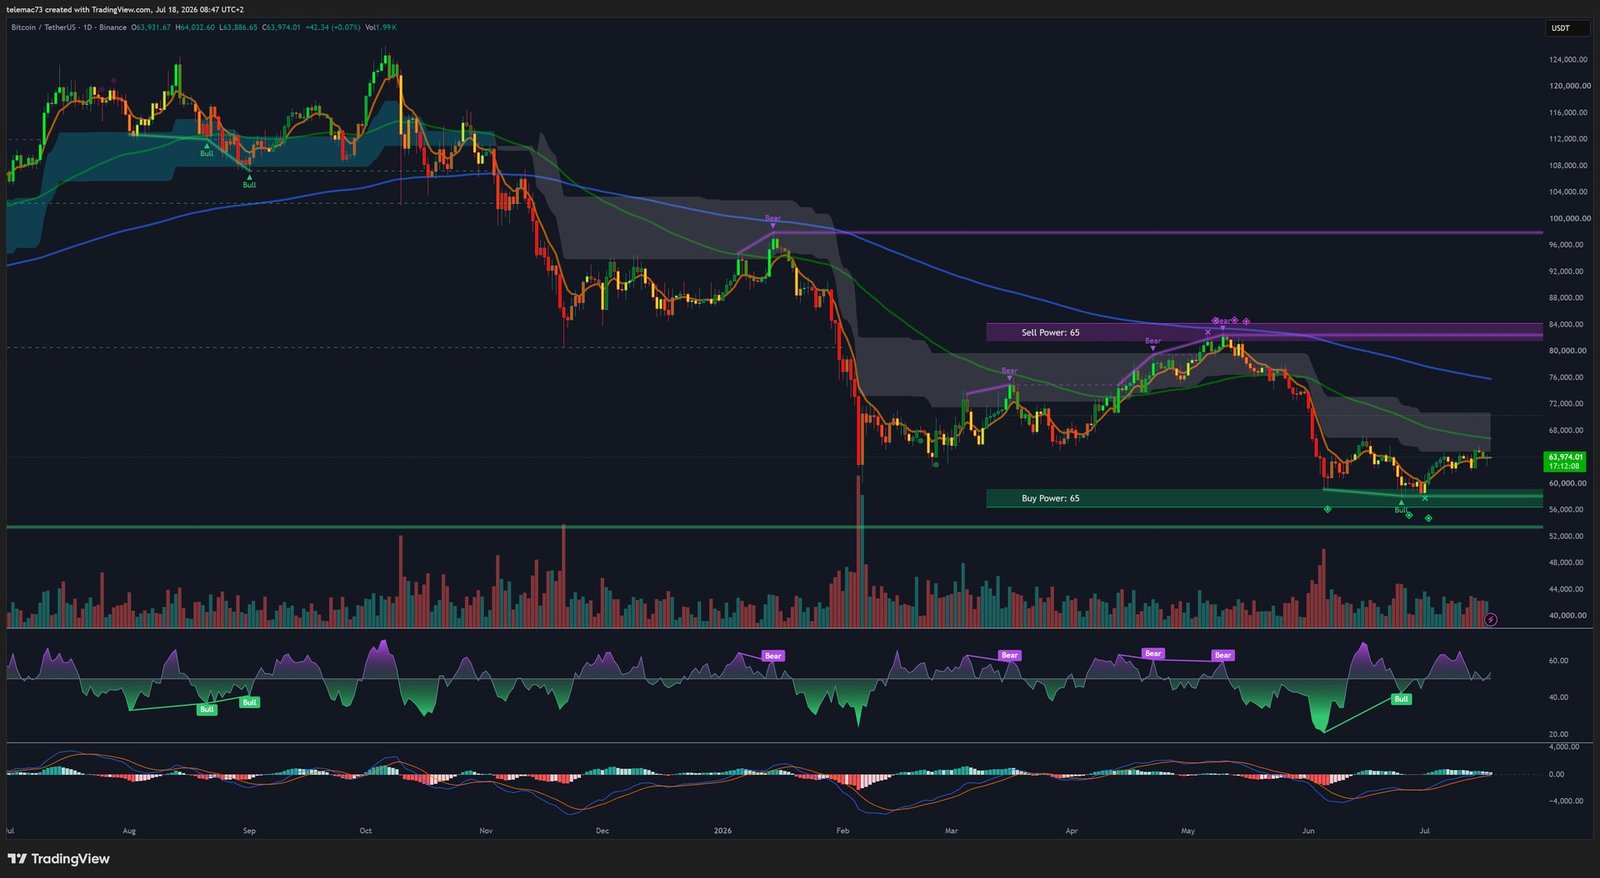
Daily chart: RSI purge and an attempt at recovery
On the daily timeframe, the underlying trend remains bearish, marked by a thick resistance cloud the price is only just beginning to emerge from. The RSI, after plunging into extreme oversold territory (20-30) during the test of $58,000, is now showing a bullish divergence and climbing back toward 45-50. The MACD, still negative, shows a histogram turning progressively less red — a sign of fading selling pressure and a possible bullish crossover ahead.
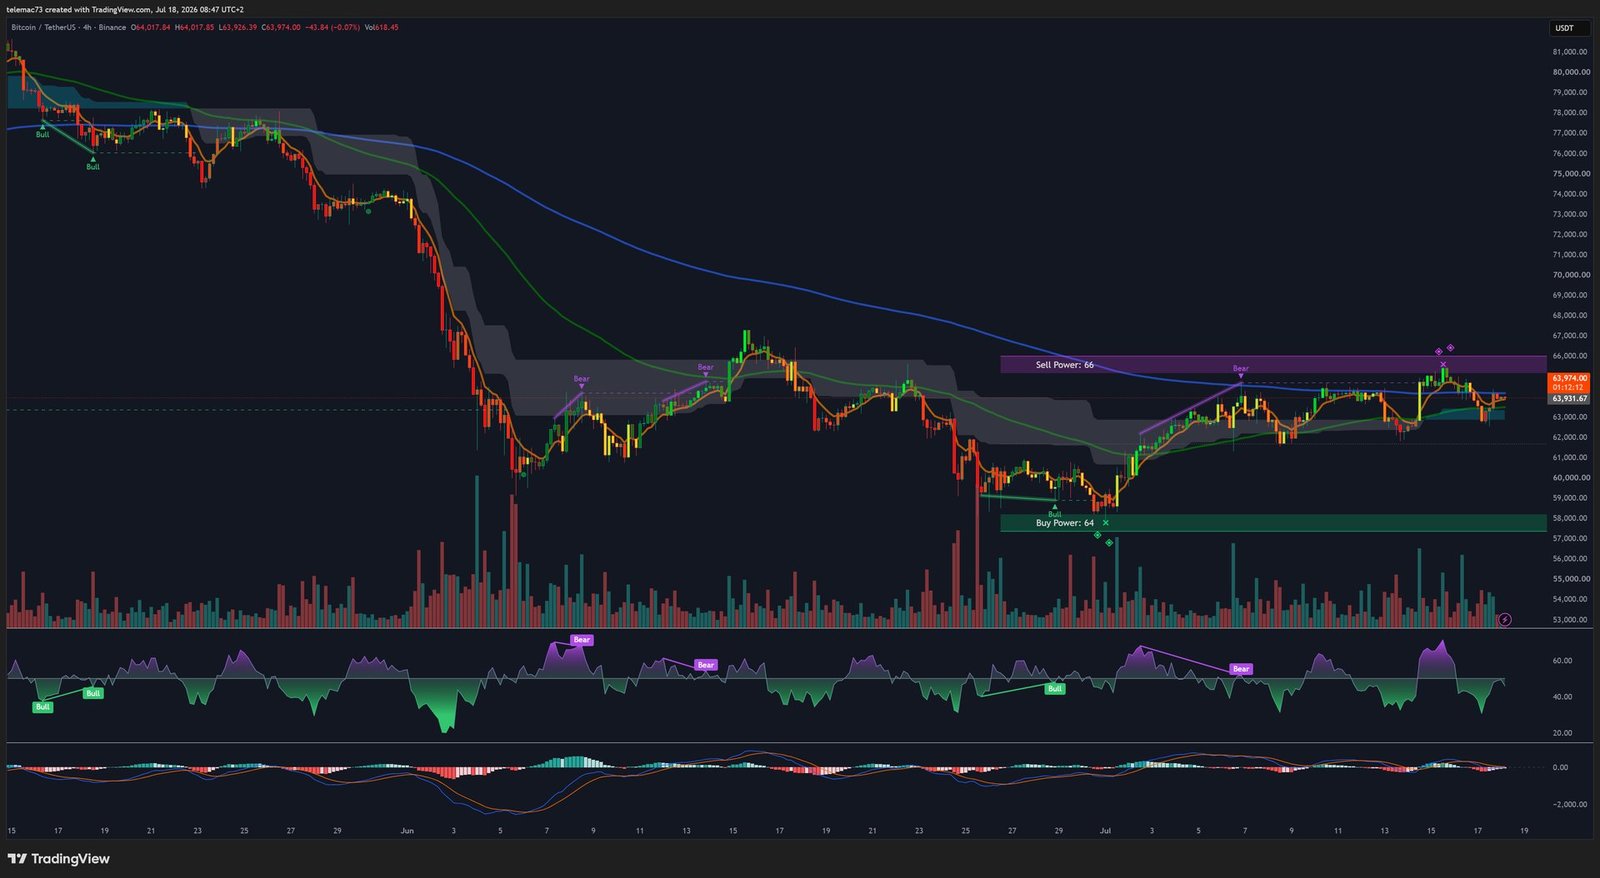
4-hour chart: compression triangle at the top
On the 4-hour chart, the rebound from $58,000 hit a wall around $65,000-$65,500, a rejection confirmed by the upper edge of the dynamic trend band. Since then, price has compressed into a symmetrical triangle — arguably a bear flag — printing lower highs. The RSI drifts around 50 without conviction, with minor bearish divergences, while the MACD has just posted a bearish crossover, histogram back in the red.
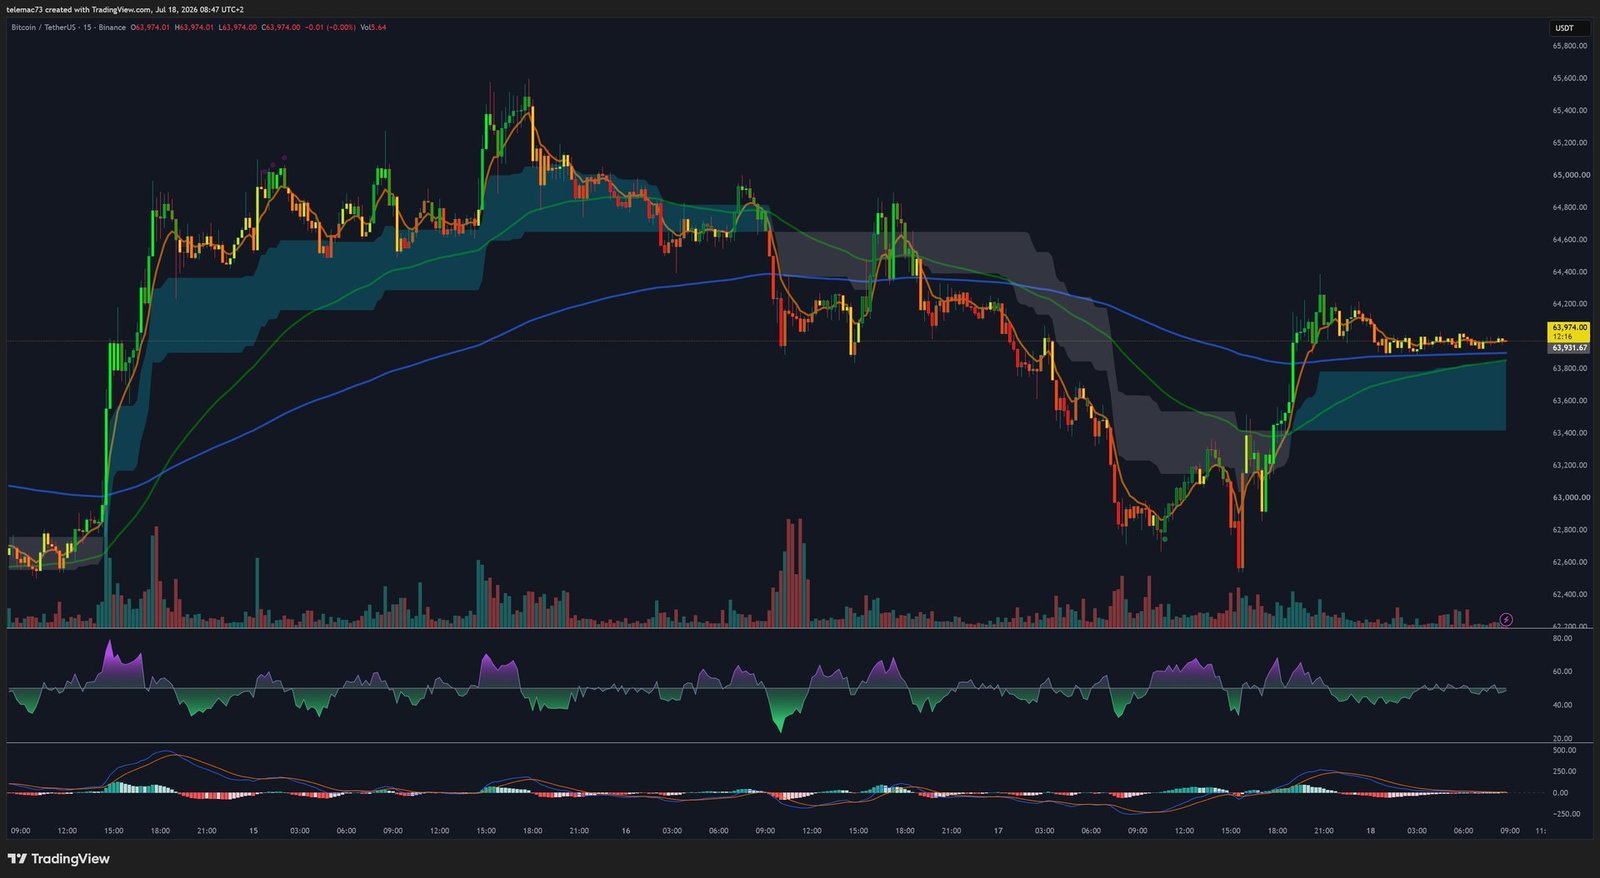
15-minute chart: market makers in control
At the micro-structure level, the market is dominated by noise and liquidity hunts from high-frequency algorithms. A flash crash followed by a V-shaped rebound marked the session, with the RSI plunging sharply below 30 before snapping back above 60. The $1.2 billion options expiry on July 17 likely helped keep price pinned in a tight corridor, to the benefit of market makers.
Key levels to watch
| Level (USD) | Type | Significance |
|---|---|---|
| $68,000 – $70,000 | Macro-psychological resistance | Low (short term) |
| $65,000 – $66,500 | Major pivot resistance (supply wall) | Very high |
| $62,800 – $63,600 | Current compression support | Extreme |
| $61,500 | Invalidation support (liquidation trigger) | High |
| $60,000 – $62,000 | Historical demand zone | Very high |
| $57,800 – $58,076 | Macro support (21-month low) | Moderate |
| $53,700 | On-chain magnet (short-term cost basis) | Low (medium term) |
The market currently shows a concerning asymmetry: leverage is growing faster than organic spot demand. Until ETF inflows confirm over several consecutive weeks, any push toward $65,000 risks being sold into by profit-taking algorithms.
Three scenarios for Q3 2026
- Macro capitulation (45%) — PCE inflation stays durably above 4% and Kevin Warsh hardens his tone, reviving rate-hike fears. The $61,500 support breaks, triggering cascading liquidations down to the $57,800 floor, potentially even the $53,700 on-chain cost basis.
- Bullish breakout (35%) — Geopolitical de-escalation, cooling inflation, and confirmed multi-week ETF inflows. Bitcoin breaks the $65,623 resistance on volume, confirms a bullish daily MACD crossover, and targets $68,000–$70,000.
- Summer range-bound (20%) — Mutual neutralization of forces. Price oscillates between $60,000 and $65,000 until an exogenous catalyst or the return of September volumes.
The convergence of these three forces — monetary policy, geopolitics, and institutional dynamics — will keep dictating the market’s tempo in the weeks ahead. The $62,800–$65,000 zone remains the decisive battlefield between buyers and sellers.
Disclaimer: This article is provided for informational and educational purposes only. It does not constitute financial or investment advice, nor a recommendation to buy or sell any asset. Cryptocurrency markets are highly volatile and involve risk of capital loss. Please do your own research and consult a licensed financial advisor before making any investment decision.

