
In June 2026, the Bitcoin (BTC) market is navigating a perfect storm of structural turbulence. The complex interplay between persistent macroeconomic shocks, a prolonged technical capitulation, and deep institutional restructuring has created a particularly hostile environment for risk capital. BTC has plummeted from its annual highs to test a critical support area around $58,000 – $60,000, wiping out hundreds of billions in global market capitalization.
🌐 Macroeconomic Environment: The Perfect Storm
The Fed Under Kevin Warsh: A New Hawkish Paradigm
The primary macroeconomic headwind for Bitcoin remains the Federal Reserve’s uncompromising monetary policy stance. At its mid-June 2026 meeting, the FOMC unanimously voted to hold the federal funds rate at 3.50%–3.75%, marking the fourth consecutive meeting without any easing — and the first major policy statement under newly confirmed Fed Chair Kevin Warsh.
Confirmed in May 2026 by a razor-thin Senate vote (54–45), Warsh immediately imposed a paradigm shift in central bank communication. The FOMC statement was drastically shortened from ~300 words to roughly 130 words, with all forward guidance stripped out in favor of an exclusive focus on price stability. This deliberate opacity sent 2-year Treasury yields surging to 4.14%, mechanically raising the opportunity cost of holding non-yielding volatile assets like Bitcoin.
The June Dot Plot delivered a further shock: nine Fed officials now anticipate at least one rate hike before year-end 2026, pushing terminal rate projections to 3.6%–4.1%. In the hours following the press conference, Bitcoin dropped from $66,000 to $64,000 before accelerating through $60,000 in the following days.
The PCE Shock: Inflation Refuses to Yield
The publication of May’s Personal Consumption Expenditures (PCE) data delivered the fatal blow to bullish hopes. The headline PCE index surged to 4.1% year-over-year — its highest level since April 2023 — while the core PCE (ex-food and energy, the Fed’s preferred inflation gauge) hit 3.4%, a peak not seen since October 2023.
Following the release on June 25, Bitcoin violently broke the $59,000 support level to touch a low of $58,121, triggering a massive wave of liquidations across derivative platforms. New York Fed President John C. Williams further cemented the hawkish outlook by pushing back his inflation target projection to 2028 — a full year later than his prior estimates.
| Macro Indicator | Value (June 2026) | BTC Impact |
|---|---|---|
| Federal Funds Rate | 3.50%–3.75% | 🔴 Negative |
| PCE Inflation (Headline) | 4.1% YoY | 🔴🔴 Very Negative |
| Core PCE | 3.4% YoY | 🔴 Negative |
| Dot Plot 2026 | Hike to 3.6%–4.1% | 🔴🔴 Very Negative |
| 2% Inflation Target (Williams) | Pushed to 2028 | 🔴 Negative |
🏦 Institutional Dynamics: The ETF Exodus and the MicroStrategy Risk
The most destructive endogenous factor has been the massive and sustained capital hemorrhage from spot Bitcoin ETFs. On June 25 alone, ETFs recorded a staggering $696 million in single-day outflows — the largest daily redemption since May 27 — bringing the cumulative monthly outflow total to a record $3.61 billion.
This dynamic has created an « ETF-era feedback loop »: price declines trigger ETF redemptions → issuers must sell physical BTC on spot markets → selling pressure amplifies the price drop → more redemptions follow. This vicious cycle explains the verticality of a correction that has erased 52% of BTC’s value from its theoretical ATH of $126,000 in October 2025.
Adding further institutional risk is the precarious position of MicroStrategy. After repurchasing $1.5 billion of its own convertible notes at an 8% discount, the company may be forced to liquidate a portion of its BTC holdings to meet approximately $1.5 billion in annual preferred dividend obligations. Michael Saylor himself acknowledged it is « not improbable » that the company sells Bitcoin. Prediction markets now price a 53% probability of a major BTC liquidation event before end of June.
📊 Multi-Timeframe Chart Analysis
Daily Chart: Death Cross and Structural Capitulation
On the daily timeframe, the technical configuration is unequivocally bearish. Price is hovering around $60,314, caught between the algorithmic « Buy Power 61 » support zone ($58,000–$60,000) and the « Sell Power 69 » resistance band ($66,000–$68,000).
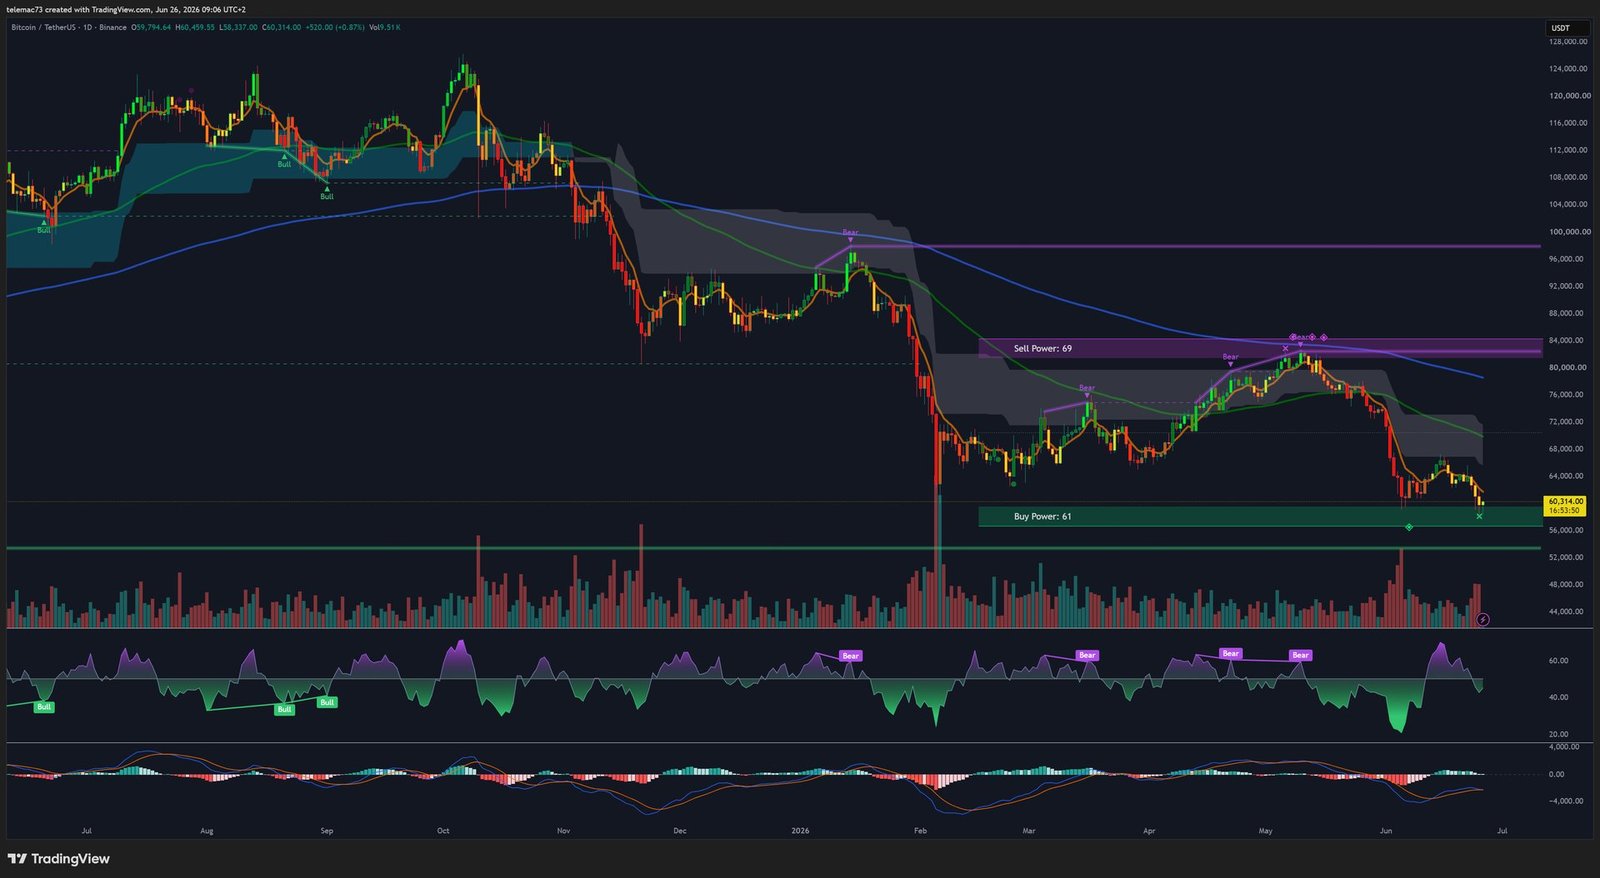
The defining technical event of this cycle is the confirmed formation of a Death Cross: the 50-day SMA has crossed below the 200-day SMA. In prior Bitcoin market cycles, this signal preceded additional drops of 52%, 50%, and 45% in 2014, 2018, and 2022 respectively. Price is trading far below all key EMAs: 20-day (~$70,200), 50-day (~$67,821), and 200-day (~$77,044), with the 200 EMA now curving downward since May 2026.
Daily Oscillators: The RSI has fallen to 28 (oversold territory), after having touched 16 at the peak capitulation moment. The MACD histogram remains deeply anchored in negative territory with no bullish crossover in sight. Critically, in a structurally-driven downtrend, oversold can remain oversold for extended periods.
| Technical Level | Price | Role |
|---|---|---|
| 200-Day EMA | $77,044 | Major resistance / bull-bear demarcation |
| 50-Day EMA | $67,821 | Intermediate resistance (Sell Power zone) |
| Key Pivot | $62,795 | First hurdle for any stabilization attempt |
| Psychological Support | $60,000 | Last line of defense — currently under severe pressure |
| Primary Support | $57,885 | Short-term pivot (fractal analysis) |
| Bearish Target | $53,485 | July 2024 low — magnetic attraction on breakdown |
| Extreme Extension | $49,577 | August 2024 swing low — potential final capitulation zone |
4-Hour Chart (H4): Cascading Bear Flags
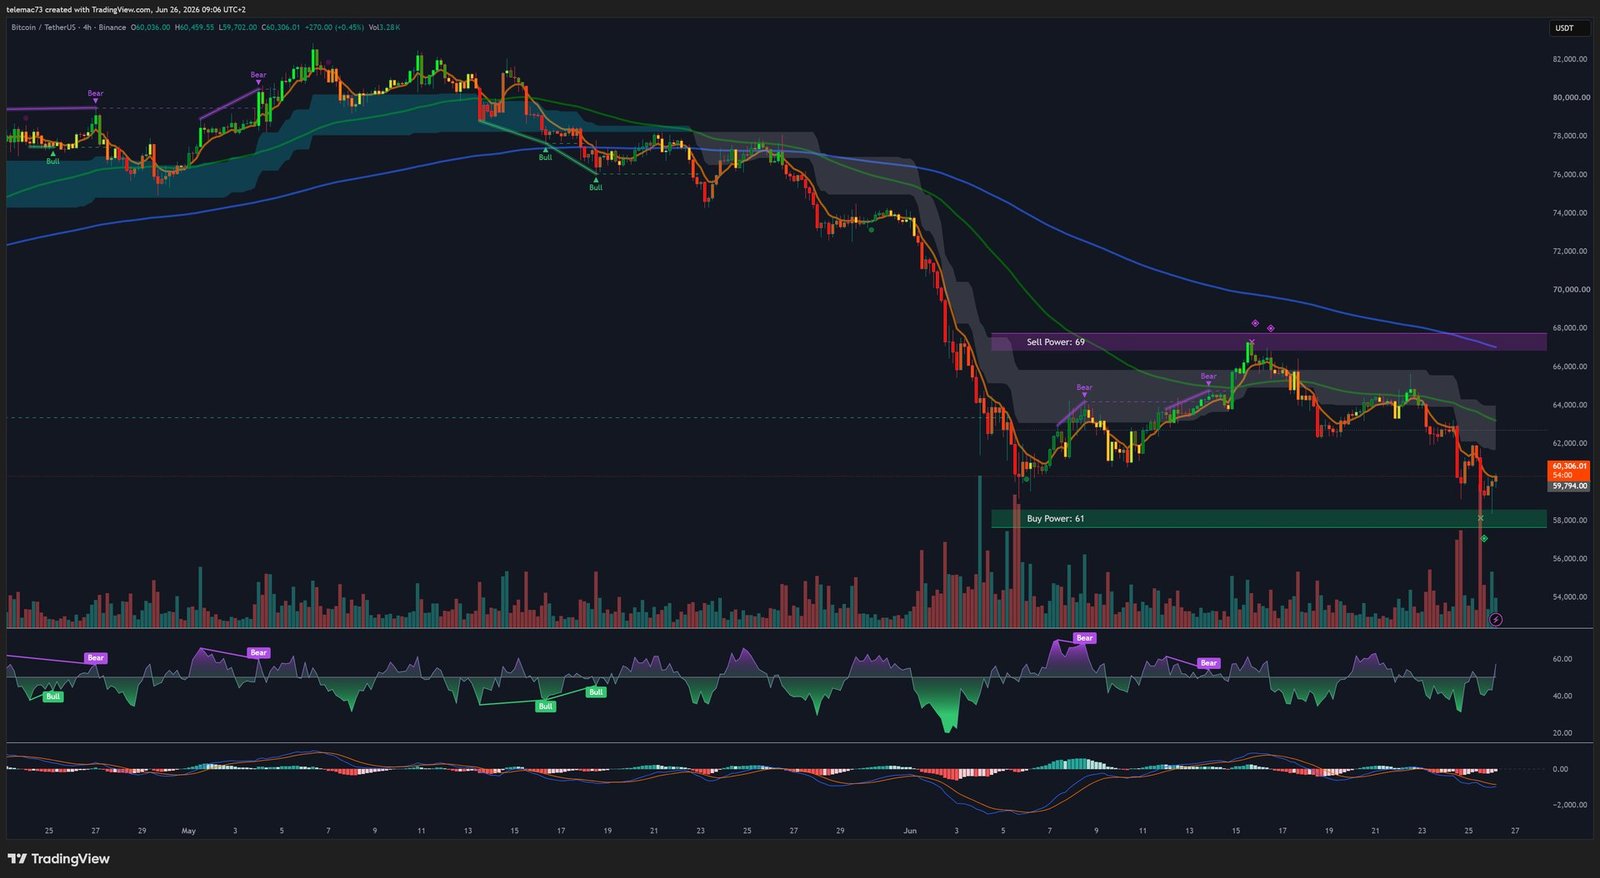
The 4-hour timeframe reveals the precise mechanics of the decline since mid-June. Prior to the PCE data release, price had carved a tight descending triangle — successive lower highs pressing against a horizontal support floor stubbornly defended by retail buyers. The inflationary data acted as the exogenous catalyst that broke the compression, producing large-body bearish marubozu candles and a volatility expansion.
Subsequent technical bounces have taken the textbook form of bear flags: narrow ascending channels with low buying volume, systematically distributed by institutional sellers seeking to exit at better prices, followed by clean breakdowns confirming trend continuation. Fast EMAs have crossed bearishly on H4 and are « fanning out » — a sign of accelerating downward momentum. The H4 RSI has oscillated continuously below 30, with no visible bullish divergence.
15-Minute Chart (M15): Liquidity Hunting and HFT Microstructure
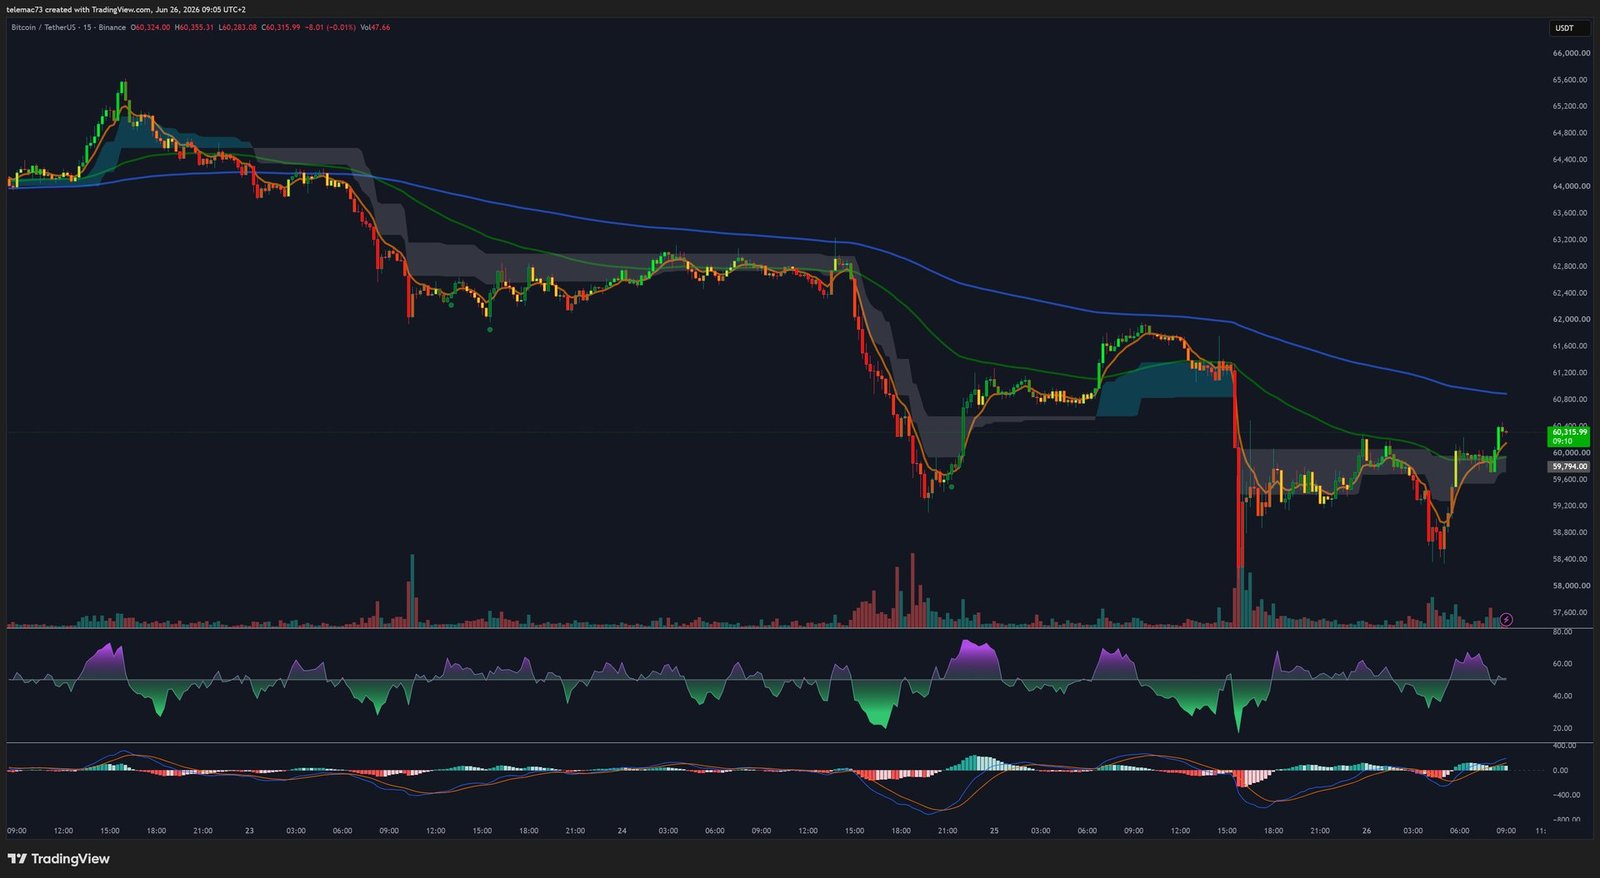
On the 15-minute chart, the fingerprint of high-frequency trading (HFT) algorithms is unmistakable. The massive red candles with extended lower wicks are the visual signature of liquidity hunts: institutional algorithms aggressively breach support levels to trigger retail stop-losses, absorb that liquidity at artificially depressed prices, then rapidly accumulate — leaving behind the characteristic long lower wicks.
At the right edge of the chart, a nascent symmetrical micro-triangle suggests a temporary equilibrium between opportunistic buyers and residual sellers. The M15 MACD is showing a local golden cross and the RSI has recovered toward the neutral zone (50). Important context: a 15-minute MACD golden cross within a relentless daily downtrend is typically nothing more than a brief respiration — a potential dead-cat bounce or CME futures gap fill — before the next bearish impulse.
🔥 Liquidity Heatmap: Mapping the Battlefield
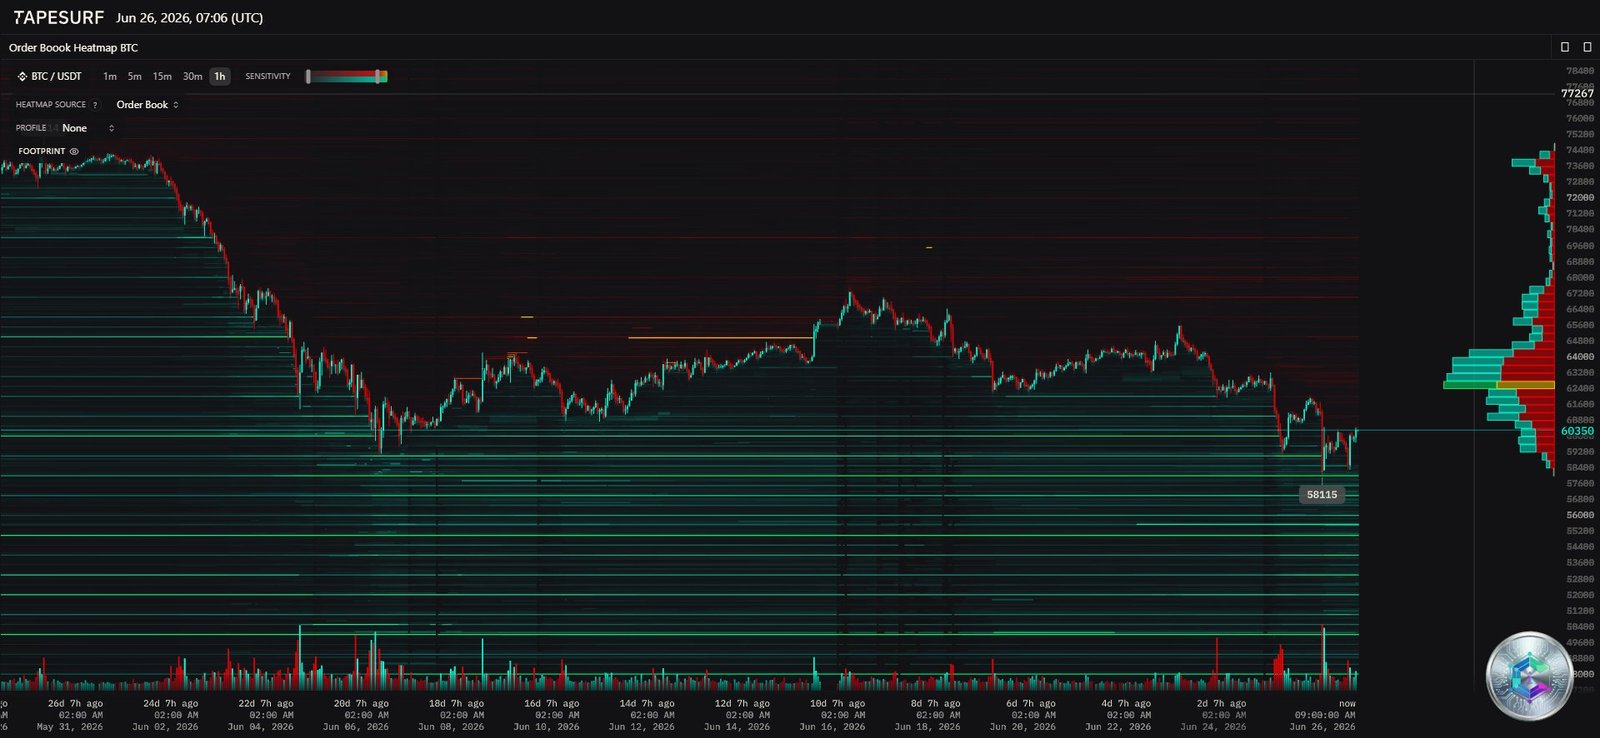
The order book heatmap (Tapesurf, June 26, 2026 at 07:06 UTC) paints a market topography that is decisively unfavorable to buyers:
- Supply Wall (Ask Liquidity): The $63,000–$68,000 zone is saturated with dense horizontal red lines representing massive clusters of resting sell orders. Miners, institutional holders, and underwater longs are ready to distribute into any rally attempt.
- Demand Void (Bid Void): Below the current price, buy-side order density is extremely thin. This explains why BTC, once the $60,000 support broke, collapsed so rapidly to $58,000 — there was simply no passive bid liquidity to cushion the fall.
- Point of Control (POC): The volume profile shows the largest transaction volume concentration between $63,000 and $64,000. This zone now acts as a structural resistance magnet — participants who bought there are waiting to exit at breakeven.
Spot orderbook depth has contracted by 65% from its prior-year peaks. Over 48 hours (June 24–25), the market absorbed more than $1 billion in liquidations, including $806 million in long positions destroyed in a single 24-hour period. Binance dominated with $350 million in liquidations, followed significantly by decentralized exchange Hyperliquid ($147 million) — proof of institutional leverage migrating to DeFi.
📈 On-Chain Data: Whales Are Capitulating
Blockchain data confirms an alarming behavioral dichotomy among market participants. « Whales » (entities holding 10 to 10,000 BTC) have been aggressively offloading their holdings, injecting 45,074 BTC onto exchanges in just 8 days at the end of June. Binance inflows surged by $5.6 billion between April and June.
As a direct consequence, nearly half of Bitcoin’s circulating supply is now sitting at an unrealized loss — a condition historically exclusive to the deepest phases of a crypto winter. Additionally, the mining sector is operating approximately 20% below its break-even production cost, forcing miners to liquidate their treasury reserves simply to keep the lights on — adding a persistent structural supply overhang to an already oversupplied market.
🎯 Strategic Synthesis and Probabilistic Scenarios
Primary Scenario — Bearish Continuation (Dominant Probability)
The convergence of the daily Death Cross, RSI at 28, deeply negative MACD, and the near-total absence of buy-side liquidity below current levels makes a test of the primary target at $53,485 (the July 2024 low) highly probable in the near term. Should institutional selling pressure align with fresh options liquidation cascades, a final capitulation flush could violently drive price toward the $52,204–$49,577 extension zone — historically the area where seller exhaustion reaches its absolute limit and generational floors are formed.
Invalidation Scenario — Technical Recovery (Low Probability)
To invalidate the immediate bearish structure, Bitcoin would need to reclaim the $62,795 pivot zone convincingly, then confirm a weekly close above the broken trend line at $73,736 and ultimately above the 200-day EMA at $77,044. The only identifiable counter-trend signal at this stage is a tentative weekly RSI bullish divergence (higher low on the oscillator vs. lower low on price). Given the structural desertion of order books and the entrenched hawkish stance of Kevin Warsh’s Fed, the probability of such capital inflows materializing in the short term is modeled as extremely low.
⚠️ Disclaimer: This article is written for educational and informational purposes only. It does not constitute investment advice, a recommendation to buy or sell crypto-assets, or any solicitation to engage in financial transactions. Cryptocurrency markets are highly volatile and carry a risk of total capital loss. Please consult a licensed financial advisor before making any investment decision.