
The Bitcoin market is currently experiencing a brutal restructuring phase in early February 2026. After reaching peaks near $126,000 in October 2025, the asset underwent a massive correction of nearly 50%, finding temporary support around $60,000 on February 5th.
A Hostile Macroeconomic Environment
The sharp decline observed in early February is intrinsically linked to a regime change in US monetary policy. The primary catalyst? The nomination of Kevin Warsh as future Federal Reserve chairman, perceived as an advocate for aggressive Fed balance sheet reduction.
Adding to this monetary uncertainty is the administrative paralysis resulting from a partial US government shutdown that began on January 31, 2026. This absence of crucial economic data has created fertile ground for speculative volatility.

Bitcoin ETFs: From Accumulation to Distribution
The role of US spot Bitcoin ETFs has evolved from an accumulation engine to a stress catalyst. During the first week of February, the sector recorded significant net outflows reaching $434 million on February 5th alone.
Total assets under management fell back below the symbolic $100 billion mark, settling around $97 billion. However, closer analysis reveals an interesting divergence: while Fidelity and ARK suffered massive redemptions, BlackRock’s IBIT recorded net inflows of $60 million on February 6th.
Multi-Timeframe Technical Analysis
Daily View: Invalidated Macro Structures
On the daily timeframe, Bitcoin has invalidated several major support structures. The break of the 50-day SMA ($88,790) and 100-day SMA ($92,400) marks the transition from a bullish to bearish regime.
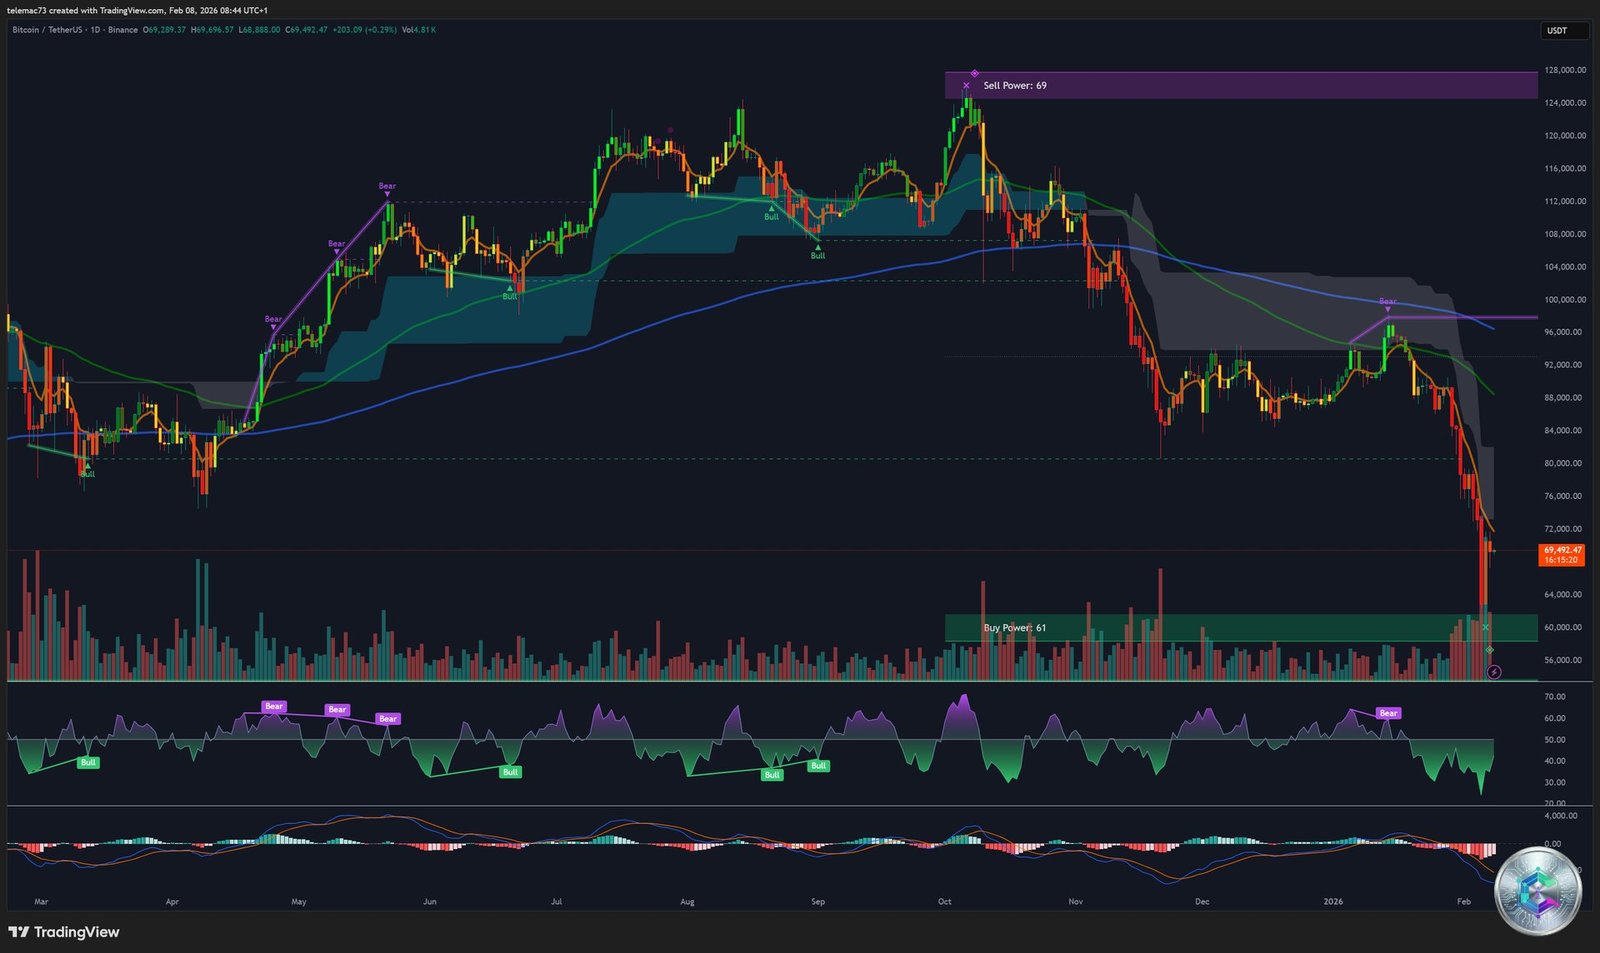
The most critical event remains the break of the 200-week EMA ($58,000-68,000). Historically, Bitcoin only trades below this average during deep bear markets, such as during the FTX collapse in 2022.
4-Hour Chart: Relief Bounce
The 4H chart shows an attempt to form a « relief bounce » within a broader bearish trend. Analysts observe a bullish crossover on oversold indicators, with a primary target between $70,000 and $70,500.
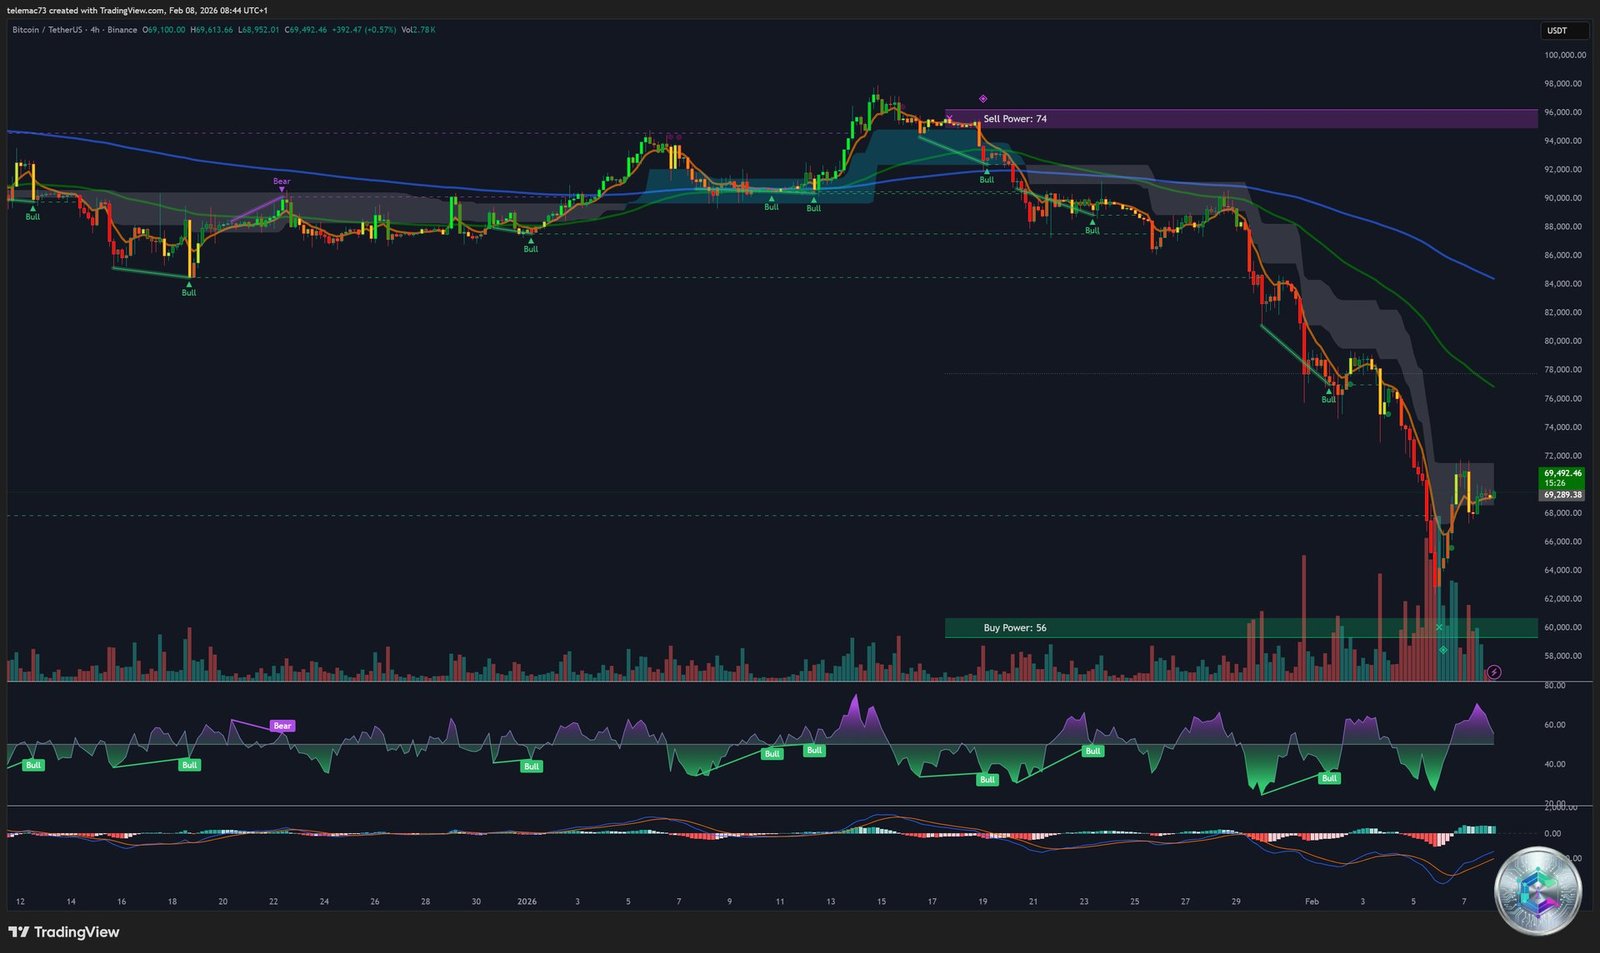
This zone represents a massive liquidity magnet for short positions opened aggressively during the drop below $80,000.
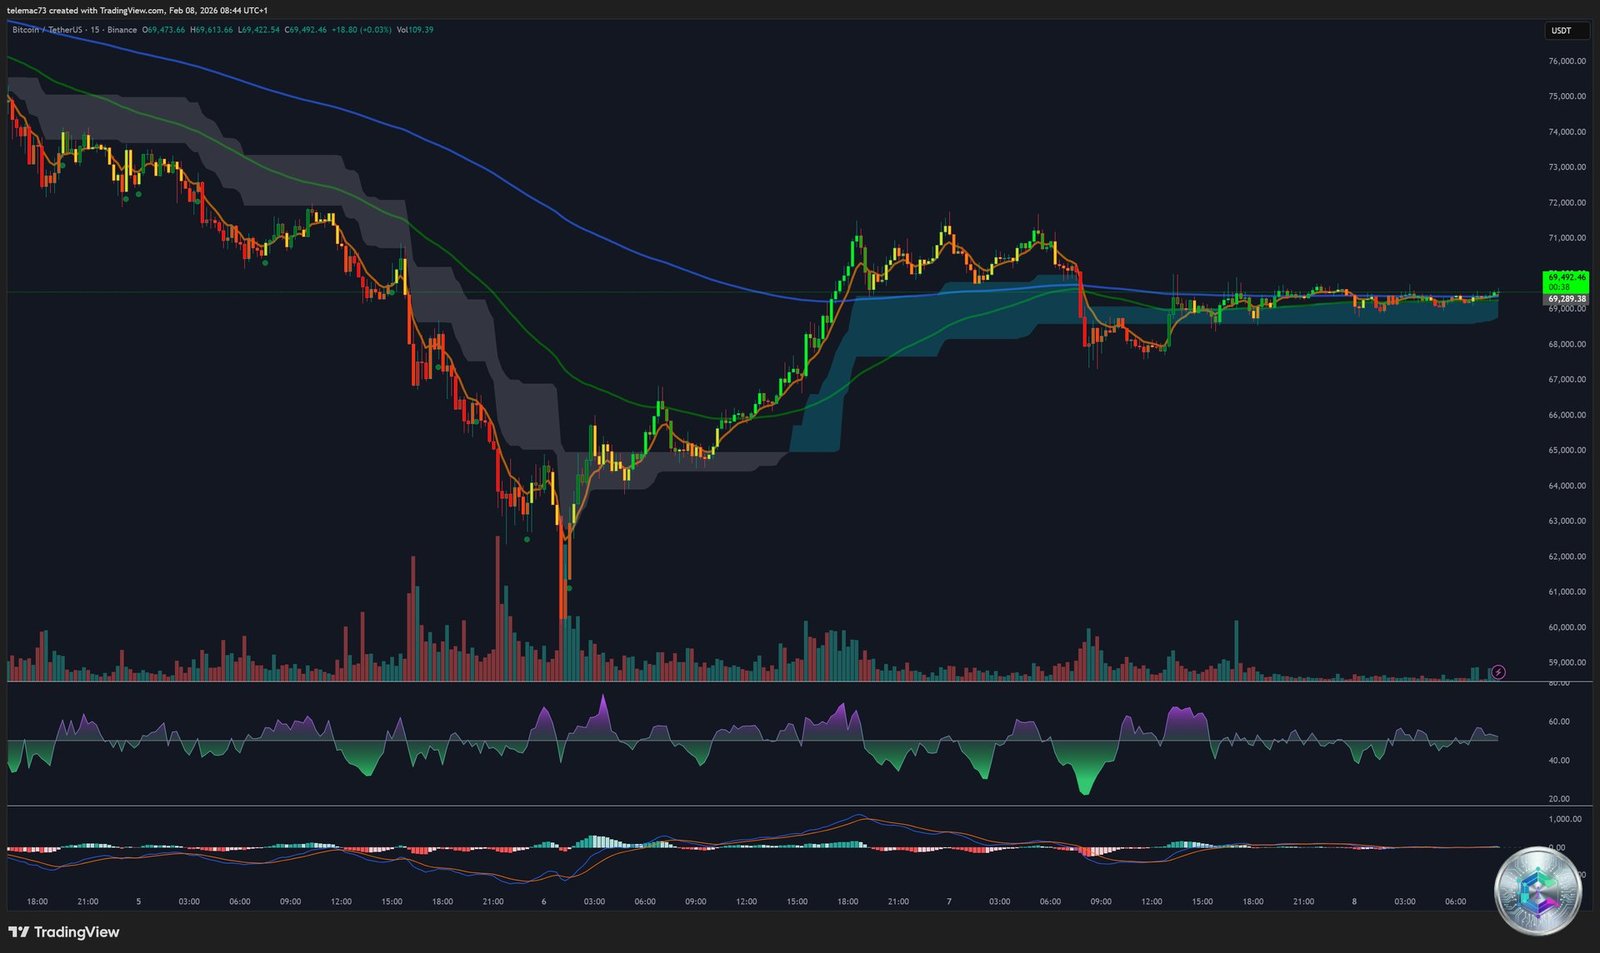
15-Minute Timeframe: Micro-Structure
In the very short term, the 15-minute chart shows a series of higher lows, indicating temporary absorption of residual supply. Intraday volatility is fueled by options-related hedging flows.
Critical Technical Levels
For the current session, here are the levels identified as critical:
- Major Resistance: $84,000 (ETF Cost Basis / SMA 50)
- Breakout Pivot: $73,000 (Key breakout level)
- Immediate Barrier: $70,500 (Short liquidation cluster)
- Psychological Pivot: $70,000 (Institutional round number)
- Immediate Support: $68,367 (4H support)
- Structural Support: $60,000 (February 5th low)
- Macro Support: $58,000 (200-week EMA)
- Ultimate Floor: $56,000 (Network Realized Price)
Liquidation Heatmap: Hot Zones
The liquidation heatmap reveals a « scorched earth » scenario for long positions. The drop to $60,000 swept away all buying liquidity accumulated during the Q4 2025 rally. Over $5.4 billion in leveraged long positions were liquidated over 72 hours.
Liquidity clusters now concentrate on the seller side, particularly in the $70,000-70,500 zone, where a breakthrough could trigger a violent « short squeeze. »
On-Chain Indicators: Historical Capitulation
On-chain data provides the most compelling evidence of this correction’s severity. Circulating supply in loss climbed to nearly 10 million BTC – the fourth highest level in history, comparable to the bottoms of 2015, 2019, and 2022.
The « Coinbase Premium » turned sharply negative (-167.8 at the crash peak), indicating that US institutions were the primary selling forces.
Forward-Looking Scenarios
Bullish Scenario (30% probability)
A daily close above $73,000 with significant volumes would invalidate the immediate bearish thesis. The primary target would be the institutional cost basis at $84,000.
Consolidation Scenario (50% probability)
Bitcoin oscillates between $60,000 and $73,000 for the remainder of Q1 2026. This phase would allow absorption of supply in loss and reset extreme fear sentiment.
Bearish Scenario (20% probability)
A break of $60,000 on a weekly basis would trigger a drop toward the 200-week EMA at $58,000 and the network realized price at $56,000, representing a generational accumulation zone.
Conclusion
Bitcoin currently finds itself in a precarious balance. The market has successfully defended the $60,000 threshold, but the lack of institutional follow-through suggests an extended consolidation phase. The purge of $5.4 billion in leverage has cleaned up the derivatives structure, potentially creating a healthier base for price discovery.
Investors should monitor Coinbase Premium and stablecoin flows as leading indicators. However, the resilience of flows into IBIT and Morgan Stanley’s filing suggest the long-term institutional thesis is not being challenged, merely tested by a hostile macro environment.
⚠️ Disclaimer: This article is provided for strictly educational and informational purposes. It does not constitute investment advice, a recommendation to buy or sell digital assets. Cryptocurrency markets are extremely volatile and carry significant financial risks. Always consult a qualified financial advisor before making investment decisions. Past performance does not predict future results.