
Bitcoin is currently experiencing a major turbulent phase, dangerously oscillating around $89,420 as of January 21, 2026. This critical period unfolds within a particularly tense geopolitical and regulatory context, marked by unprecedented transatlantic tensions and legislative uncertainty in the United States. Our in-depth technical analysis reveals a confluence of bearish signals that demand heightened vigilance from investors.
Macroeconomic Context: A Perfect Storm
The crypto-asset market is currently facing multiple simultaneous headwinds. The diplomatic crisis surrounding Greenland, with threats of US tariffs potentially reaching 25% on eight European nations, has triggered a classic « flight to quality » movement. Contrary to expectations, it’s not Bitcoin that benefits from this risk aversion, but gold reaching new all-time highs.
This Bitcoin/Gold divergence is particularly revealing: it demonstrates that institutional investors still don’t consider BTC as a reliable hedge against systemic geopolitical risk, but rather as a high-beta tech asset correlated with Nasdaq stocks.
On the regulatory front, the postponement of the « Digital Asset Market Clarity Act » review by the US Senate adds another layer of uncertainty. This blockage, caused by controversial amendments regarding the prohibition of interest payments on stablecoins, potentially pushes back any major legislative progress until after the November 2026 midterm elections.
Liquidity Analysis: Mapping Critical Zones

Analysis of liquidation heatmaps reveals extreme market polarization. A massive concentration of long position liquidations is identified in the $87,000 – $89,000 zone. If price penetrates this zone with volume, it could trigger a cascade of forced liquidations, violently propelling the price downward.
Conversely, short positions are massively accumulating around $95,000, creating potential for a « short squeeze. » For Bitcoin to resume an upward trajectory, it will need to break through this liquidity wall, which would force short sellers to buy back their positions.
Examination of the Binance order book corroborates this analysis and reveals a structural imbalance: massive sell orders above $105,000 act as a glass ceiling. More worryingly, below $89,000, there’s a « liquidity void » down to the $84,000 zone, meaning once this threshold breaks, price could drop rapidly due to lack of intermediate buyers.
Long-Term Technical Analysis: Death Cross Confirms Deterioration

The most concerning technical element is the formation of a « Death Cross, » where the short moving average (50-day SMA) crosses below the long moving average (200-day SMA). While this is a lagging indicator, it has a strong self-fulfilling psychological impact and often marks the beginning of a prolonged consolidation phase.
From a chartist perspective, Bitcoin has broken the floor of its long-term bullish channel. This rupture fundamentally changes market psychology: shifting from a « Buy the Dip » strategy to a « Sell the Rally » strategy. Price now evolves within a well-defined rectangular formation:
- Rectangle Resistance: $96,704. This is the current ceiling. As long as price remains below this level, the trend is sideways or bearish.
- Rectangle Support: $88,259. This is the critical defense threshold. A daily close below this level would validate a downside breakout, opening the path to a theoretical projection toward $80,442.
Daily technical indicators confirm the weakness. The RSI (14) around 40 is not yet in oversold territory (below 30), indicating the bearish movement still has kinetic potential. The MACD shows a negative histogram with signal lines diverging downward.
Medium-Term Analysis (4 Hours): Confirmed Bearish Structure

The 4-hour chart reveals an undeniably bearish market structure, with a succession of descending peaks (Lower Highs) and descending troughs (Lower Lows). The recent local high at $92,807 now constitutes a key « Lower High. » To reverse this H4 trend, Bitcoin must imperatively close above this level.
Price has lost support of the 200 moving averages (SMA and EMA) on H4, transforming the $93,000 – $94,000 zone into a major dynamic resistance area. Any return toward these moving averages will likely be aggressively sold by trend algorithms.
However, important nuances suggest an imminent technical bounce potential. Some sources indicate H4 RSI plunging toward 22.5, an extreme oversold zone, suggesting a reflexive buying reaction is likely in the very short term, even if it doesn’t change the underlying trend.
Short-Term Analysis (15 Minutes): Intraday Operational Levels
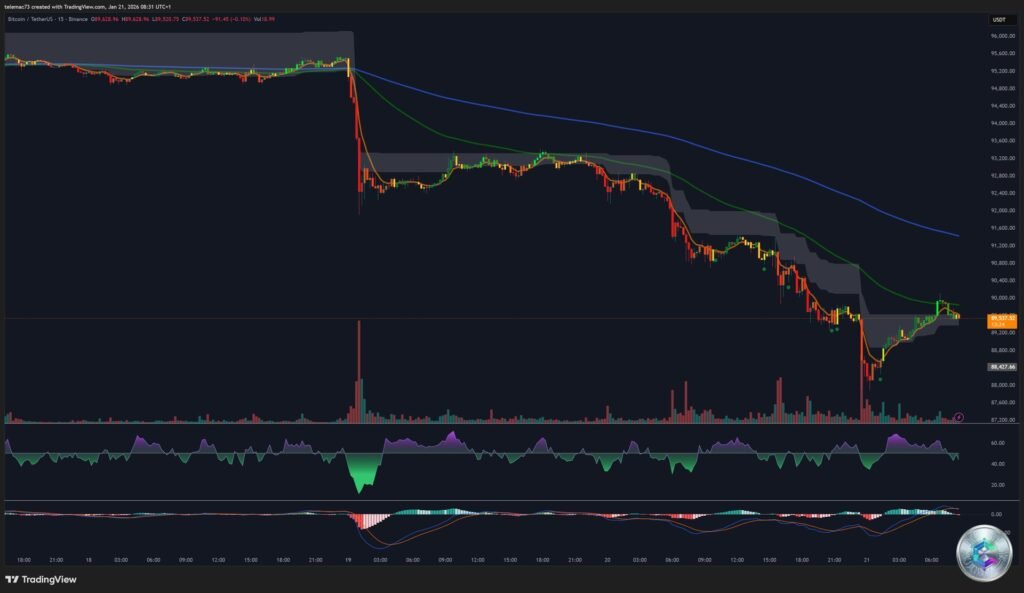
The current session is marked by extreme nervousness. Price oscillates around $89,400, repeatedly testing buyer strength. The absence of long lower wicks on M15 candles is concerning: this suggests buyers aren’t yet intervening massively.
Critical Intraday Pivot Points:
- R2 ($89,974): Psychological $90k threshold. « Reload Short » zone
- R1 ($89,769): First obstacle. If price fails here, weakness is confirmed
- Pivot ($89,514): Price currently trading BELOW this pivot. Intraday bias: BEARISH
- S1 ($89,309): Currently being tested. If broken, acceleration toward S2
- S2 ($89,054): Last line of defense before round $89k. Possible technical bounce zone
- S3 ($88,849): Intraday capitulation zone. Corresponds to top of liquidity cluster
Forecast Scenarios and Key Levels
Scenario A: Liquidity Purge (Probability: 55%)
Bitcoin breaks S2 support ($89,054) and accelerates toward $88,259. Once this support yields, a rapid wick descends to $85,000 – $86,000 to fill the liquidity void. Strategy: Wait for confirmed break of $88,259 to initiate a short with $84,000 target.
Scenario B: Rectangle Defense (Probability: 35%)
Oversold H4 indicators trigger a technical bounce. Buyers defend the « Yearly Open 2026 » ($87,000) vigorously. Bitcoin reclaims above the daily Pivot and consolidates sideways between $89,000 and $92,000. Strategy: Buy the bounce at $88,300 with tight Stop Loss below $87,800.
Scenario C: Surprise Reversal (Probability: 10%)
Easing of US-EU tensions or positive Clarity Act announcement changes market psychology. Bitcoin reclaims $93,500 with strong volume, invalidating the bearish thesis. Strategy: Only turn aggressively bullish above $93,500.
Summary Technical Levels
| Level | Price (USD) | Description |
| Major Resistance | $107,000 | Cycle top |
| Intermediate Resistance | $96,700 – $98,000 | Daily rectangle high |
| Pivot Resistance | $93,500 | Yearly Open 2025 + H4 SMA 200 |
| Current Price | ~$89,420 | Critical floating zone |
| Immediate Support | $88,259 – $89,000 | Rectangle bottom + Liquidity cluster |
| Critical Support | $87,000 | Yearly Open 2026 |
| Structural Support | $84,000 | November consolidation support |
| « Bear Case » Support | $74,000 | Rectangle breakout target |
Conclusion and Recommendation
Bitcoin stands at a perilous crossroads. The $88,259 zone is the « Rubicon. » As long as this level holds, hope for sideways consolidation remains. If it yields, a deeper correction toward $80,000 – $84,000 becomes the base scenario.
Final Recommendation: NEUTRAL-BEARISH. Favor selling on rallies toward $91,500 rather than immediate dip buying, as long as the $93,500 zone isn’t reclaimed. Caution and strict risk management are imperative in this volatile context.
⚠️ Disclaimer: This article is provided for educational and informational purposes only. It does not constitute financial investment advice. Crypto-asset markets are extremely volatile and carry risks of capital loss. Always conduct your own research and consult a qualified financial advisor before making investment decisions.