


Bitcoin is going through a particularly delicate structural transition in this mid-August 2026 window. Trapped in a tight price corridor around $63,800, the leading crypto asset is caught between diverging macroeconomic forces, an institutional accumulation of unprecedented scale, and conflicting technical signals depending on the timeframe observed. This analysis cross-references macro data, order book microstructure and multi-timeframe chart patterns to map out the full picture of the forces currently at play.
1. Macro backdrop: disinflation versus geopolitical risk
The July 2026 US CPI print anchors the current valuation of risk assets. Headline inflation came in at 3.4% year-on-year, a modest deceleration from June’s 3.5% and in line with consensus. Core inflation, which strips out food and energy, printed at 2.5% YoY versus 2.6% the prior month. This residual stickiness is largely explained by the shelter component, historically the most inertial, which alone accounted for nearly two-thirds of the monthly headline increase.
| US Indicator | July 2026 | June 2026 | Consensus |
|---|---|---|---|
| Headline CPI (YoY) | 3.4% | 3.5% | 3.4% |
| Headline CPI (MoM) | 0.1% | -0.4% | 0.1% |
| Core CPI (YoY) | 2.5% | 2.6% | 2.5% |
| Core CPI (MoM) | 0.2% | 0.0% | 0.2% |
| Energy (MoM) | -1.5% | N/A | N/A |
| Shelter (MoM) | 0.1% | N/A | N/A |
These numbers paint a picture of an economy normalizing, but not yet a decisive win against inflation. For Bitcoin, this ambivalence is creating a genuine decision paralysis: the downward trend in headline inflation feeds hopes of Fed easing at the September 15–16 FOMC meeting, while sticky services inflation pushes the central bank toward keeping a restrictive stance, draining the speculative liquidity crypto markets thrive on.
Adding to the uncertainty, geopolitical tensions around the Strait of Hormuz — a critical chokepoint for global oil trade — pushed crude oil prices up nearly 5%, to around $81.80 a barrel. A prolonged energy shock would mechanically feed into upcoming CPI prints, potentially forcing the Fed into a more hawkish posture — an asymmetric risk that partly explains Bitcoin’s inability to fully capitalize on otherwise solid institutional inflows.
On the cross-asset front, an interesting decoupling dynamic has emerged versus the Nasdaq-100: after Bitcoin dropped 13.4% in Q2 2026 while tech surged 27.7%, July saw the pattern reverse, with the Nasdaq-100 correcting 6.6% and Bitcoin gaining 7.5% — a sign the asset is increasingly viewed as an alternative store of value when tech valuations reach stretched territory. One caveat: August seasonality remains historically unfavorable for crypto, with an average pullback of 4.3% over the month.
2. Institutional adoption: a quiet but massive accumulation
Behind the apparent price stagnation lies a far more significant structural reality: massive accumulation by institutional entities and long-term holders. Spot Bitcoin ETFs continue to act as a genuine liquidity vacuum. Between August 3 and 7, these vehicles recorded net inflows totaling $865.3 million across five consecutive positive sessions. Another recent stretch saw $745 million injected over four trading days, averaging close to $186 million per day. Even during rejections below the $65,000 mark, ETFs kept capturing over $381 million in short two-day windows.
Unlike retail traders who react emotionally to volatility, fund managers accumulate in a staggered fashion via time-weighted average price (TWAP) execution algorithms, building an invisible but robust support floor. On-chain data corroborates this re-accumulation thesis: more than 155,000 BTC — nearly $10 billion in nominal value — have been absorbed within the $62,000 range, a concentration that durably solidifies the price structure. Corporate adoption is also advancing, with Trump Media reporting holdings of over $1.2 billion in Bitcoin and related assets, further reducing the velocity of circulating supply.
3. Market microstructure: what the order book heatmap reveals
To understand why Bitcoin keeps failing to establish a clear directional trend despite solid institutional fundamentals, analyzing market microstructure through the order book heatmap is essential. This topographic representation of liquidity colors price levels based on the concentration of resting limit orders, revealing the true intentions of market makers and large operators.
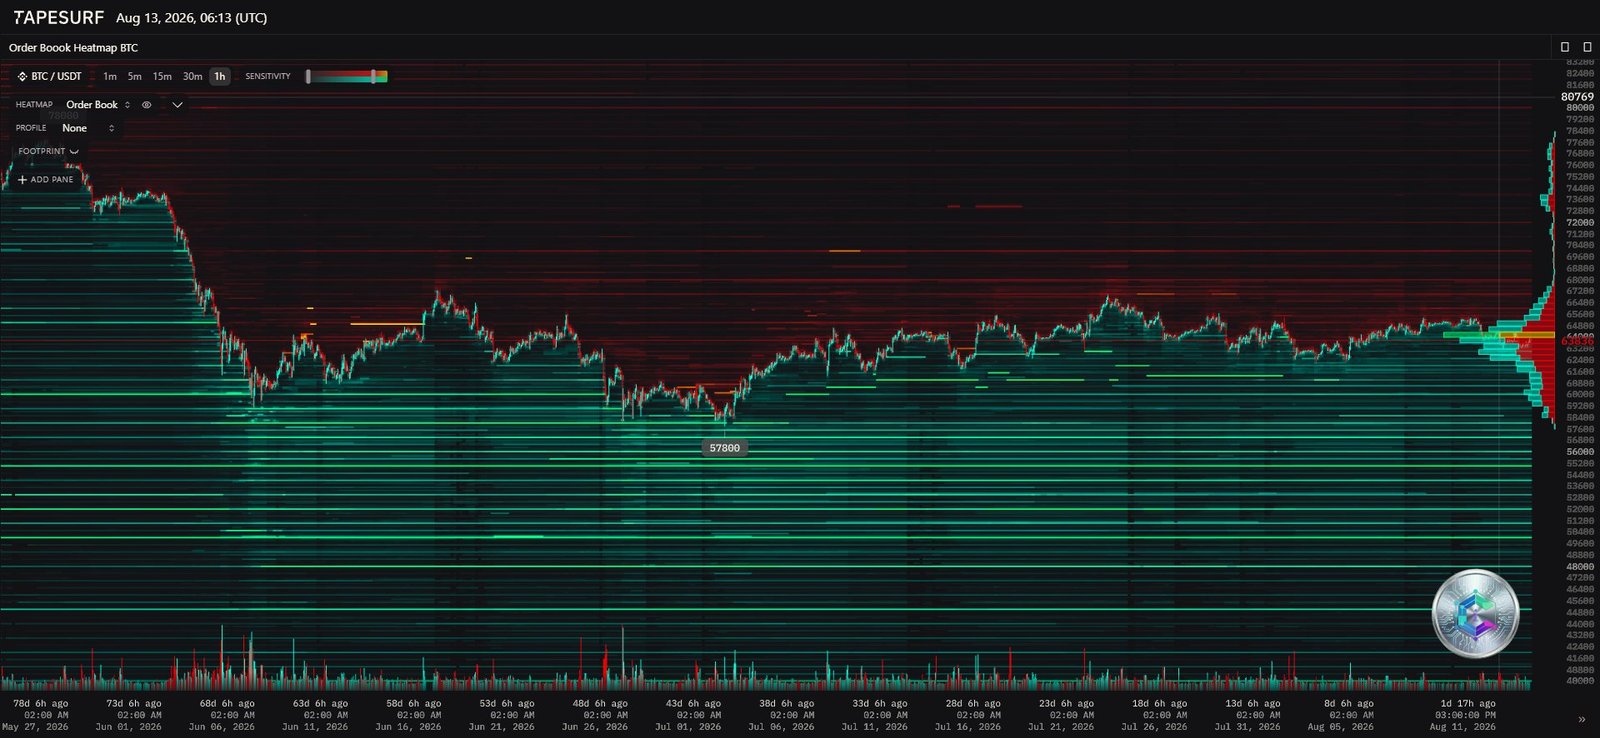
The upper section of the heatmap exposes an exceptionally thick wall of sell-side liquidity, starting aggressively around $65,000 and thickening up to $67,000. These orders don’t necessarily represent bearish bets: they mostly materialize profit-taking from entities that accumulated at lower levels. For a valid bullish breakout, the market needs a burst of market buy orders violent enough to absorb this latent supply — otherwise price gets mechanically pushed back down at every interaction with this layer.
Conversely, the lower part of the heatmap details the support architecture. Buy-side liquidity bands around $62,000 appear relatively fragmented, reflecting short-term structural fragility. The most striking feature, however, is a monolithic block of buy liquidity positioned with surgical precision at $57,800 — a genuine institutional « bid wall » that, in the event of a macro-driven capitulation, would act as a liquidity black hole and form a structural market bottom.
| Liquidity Zone | Estimated Level | Density | Function |
|---|---|---|---|
| Major sell wall | ~$67,000 | Extreme | Macro resistance, profit-taking |
| Immediate rejection zone | ~$65,000 | Strong | Ceiling of current range |
| Short-term support | ~$62,000 | Moderate | Reloading zone |
| Structural buy wall | $57,800 | Massive | Cycle pivot, deep institutional accumulation |
4. Multi-timeframe technical analysis
4.1 Daily timeframe: the battle for macro momentum
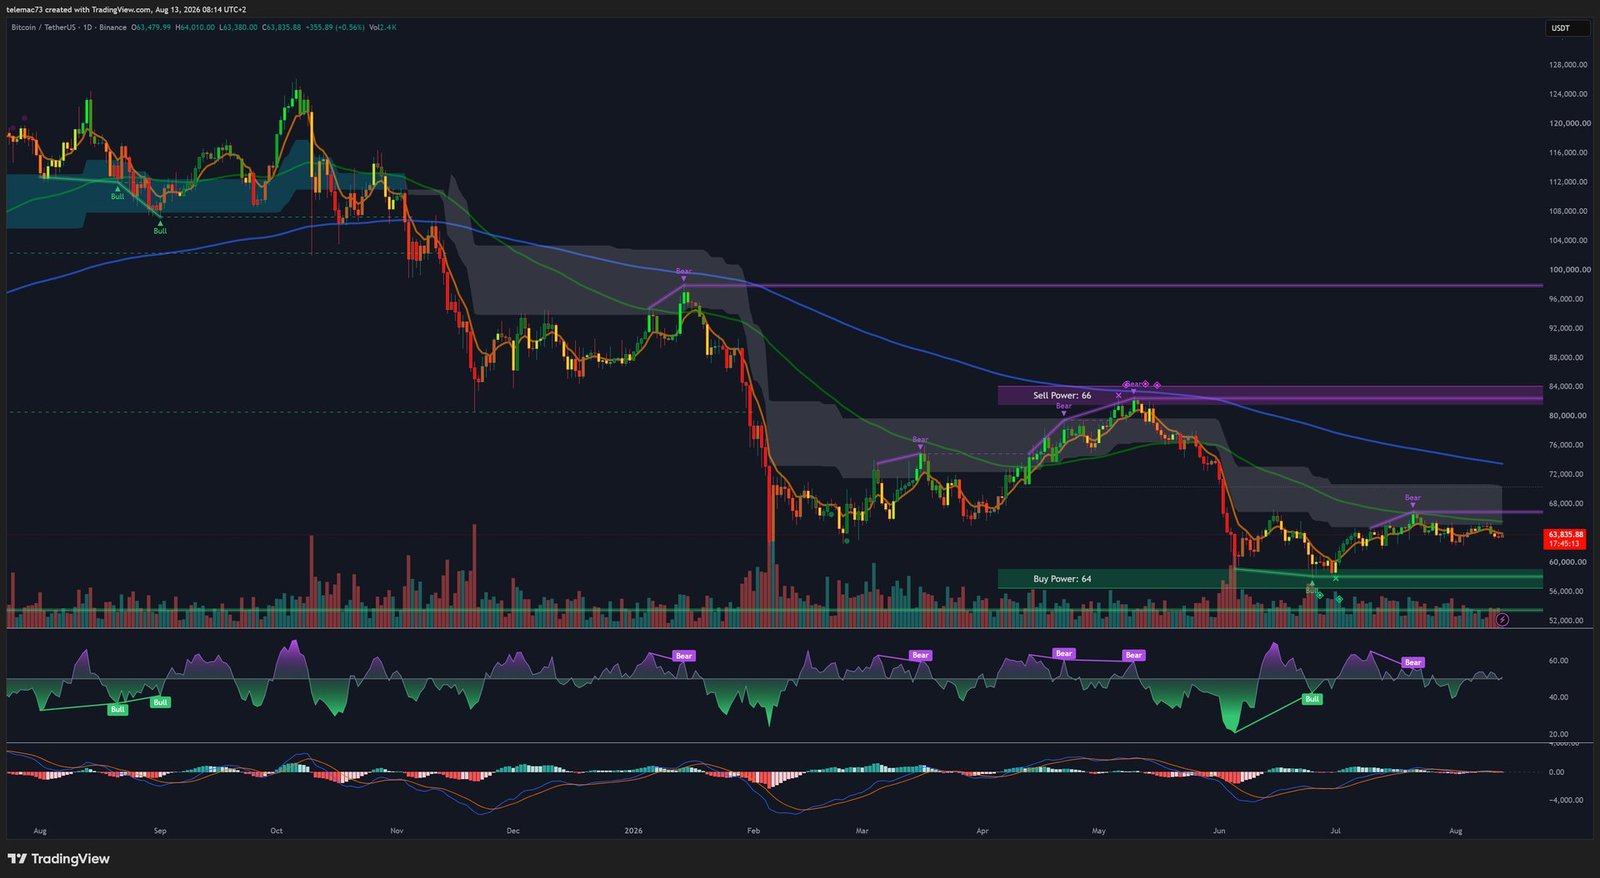
At $63,835, Bitcoin is locked in a broad sideways consolidation. The « Sell Power » zone historically sits between $72,000 and recent cycle highs, while the « Buy Power » zone is firmly anchored in the $54,000–$58,000 range, encompassing the $57,800 liquidity wall identified on the heatmap — a major technical confluence. With price trading below the reference moving average, the signal remains structurally bearish, reinforced by an earlier « Death Cross. » The RSI oscillates lethargically around 50 with no extreme reading, while the MACD stays in negative territory without a bullish confirmation. The overall geometry traces a broad symmetrical compression triangle, reflecting a battle of attrition ahead of a volatility expansion.
4.2 4-hour timeframe: the range trap and the « Bear Flag »
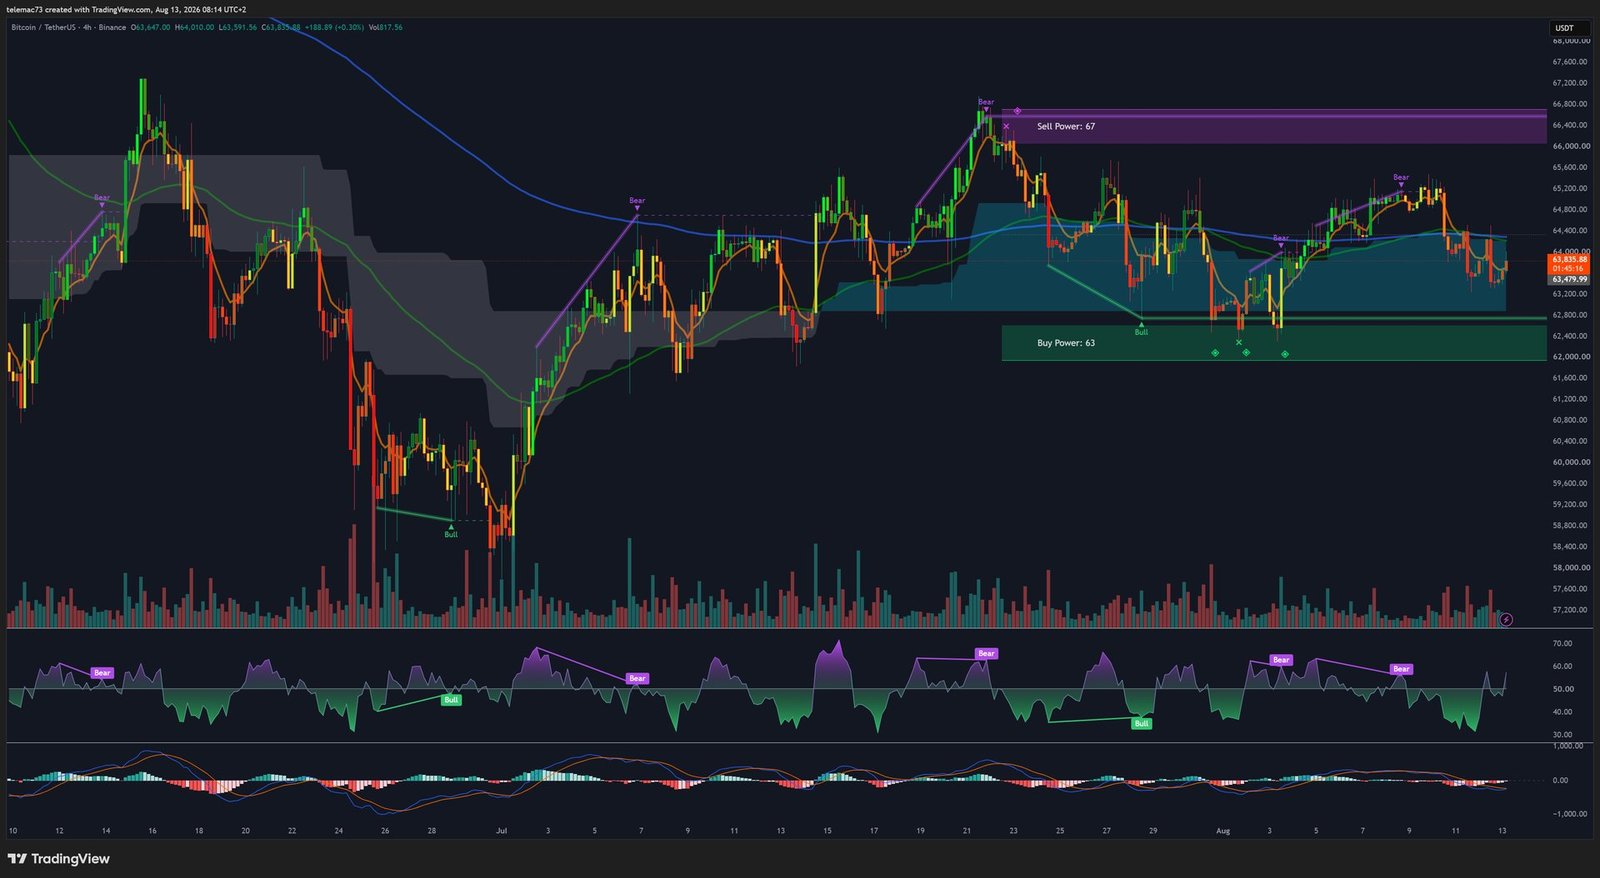
On this timeframe, price is locked in a corridor defined by high-frequency trading algorithms, between a sell zone around $65,500–$67,000 and a buy zone between $62,000–$63,000. The recent formation resembles a « Bear Flag, » a continuation pattern suggesting the observed bounce may simply be a technical relief rally lacking underlying strength. A break of the flagpole support around $63,600 could push price toward the lower end of the Buy Power zone. The MACD, stuck in « whipsaw » mode, illustrates the absence of a clear trend at this scale.
4.3 15-minute timeframe: extreme contraction
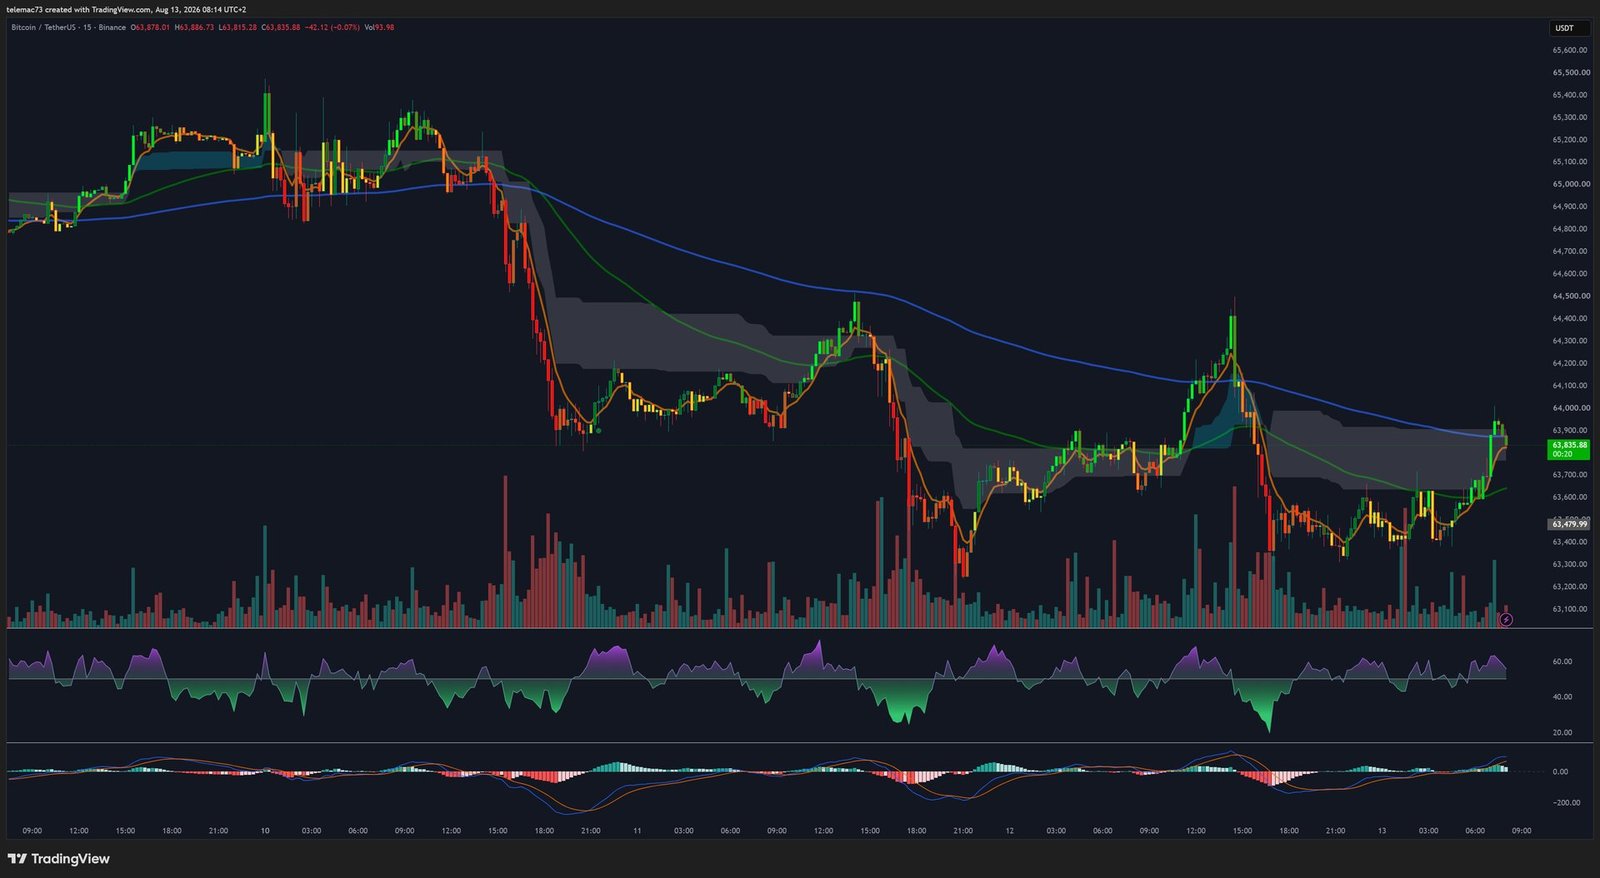
On the 15-minute unit, a very tight compression triangle has formed since $63,400, with rising higher lows and volatility compressing critically — the classic precursor to a sudden breakout. Moving averages have completely flattened around the intraday pivot at $63,800, a squeeze that typically precedes trend-following algorithm activation as soon as an expansion emerges outside this band.
5. Strategic outlook: three resolution scenarios
The aggregation of macro factors, liquidity flows and price geometry paints a market under maximum tension, yet lacking an immediate directional catalyst.
- Scenario 1 — Bearish flush-out by exhaustion: a confirmed close below $63,400 would trigger cascading liquidations toward the $62,000 support, and potentially toward the $57,800 structural buy wall, purging accumulated leverage.
- Scenario 2 — Absorption and bullish breakout (short squeeze): a confluence of positive signals (soft PPI, monetary easing) combined with accelerating ETF inflows could enable absorption of the sell wall. A daily close above $66,000 would force short covering and propel price beyond $70,000.
- Scenario 3 — Continued summer torpor: the most likely short-term scenario, driven by negative August seasonality, would see the market chop erratically between $63,000 and $65,000, generating false signals while institutional accumulation continues quietly in the background.
Bitcoin’s market structure in mid-August 2026 calls for strict risk management. Short-term technical fragility below the daily moving average argues for a defensive approach and warrants avoiding the temptation to chase intraday impulsive moves. The most asymmetric strategy is to patiently monitor market reactions at the major boundaries — the structural $57,800 support or the $65,500 resistance — to identify the starting point of the next macro trend.
Disclaimer: This article is provided for educational and informational purposes only. It does not constitute investment, financial, or trading advice of any kind. Cryptocurrency markets are highly volatile and involve significant risk of capital loss. Always do your own research (DYOR) and consult a qualified financial advisor before making any investment decision.

