
Bitcoin is currently experiencing a marked turbulent phase, oscillating below the $92,500 barrier after reaching a local peak above $96,000 on January 14, 2026. This 3.6% correction comes against a tense geopolitical backdrop, following the announcement of new U.S. tariffs targeting eight European countries. Let’s dive into a multi-timeframe technical analysis to decipher this complex situation.
Macroeconomic Context: Tariff Shock and Market Reaction
President Donald Trump’s announcement of 10% tariffs on major economies such as France, Germany, the United Kingdom, and the Netherlands triggered a shockwave across financial markets. Unlike gold and silver, which reached all-time highs, Bitcoin reacted as a risk asset, experiencing immediate selling pressure.
This divergence can be explained by Bitcoin’s superior liquidity, trading 24/7. When negative news breaks over a weekend, BTC often becomes the preferred vehicle for raising liquidity, acting as a « lender of last resort » for traders seeking to hedge positions in other illiquid assets.
Institutional Fundamentals: A Structural Cushion
Despite cyclical volatility, institutional fundamentals remain solid. MicroStrategy continues its aggressive accumulation strategy with signals suggesting a new acquisition potentially exceeding $1.25 billion. This capital structure arbitrage approach sends a clear message: high-conviction players are taking advantage of corrections to accumulate.
Furthermore, adoption extends beyond high finance. The integration of $10 million in Bitcoin into the treasury of restaurant chain Steak ‘n Shake marks a progressive normalization of the asset in the real economy, potentially reducing long-term volatility.
Sentiment Analysis: Fear & Greed in Neutral Zone
The Crypto Fear & Greed Index dropped to around 44-50, reflecting a fracture in retail investor confidence. However, for professional investors, this level often represents a contrarian buying signal. The market is purging irrational exuberance without entering total capitulation (typically marked by an index below 20).
The massive liquidation event, with over $600 million in long positions wiped out in 24 hours, paradoxically constitutes a bullish signal. This purge of overleveraged positions lightens the market structure and reduces selling pressure linked to forced sales.
Daily Technical Analysis: Consolidation in an Uptrend
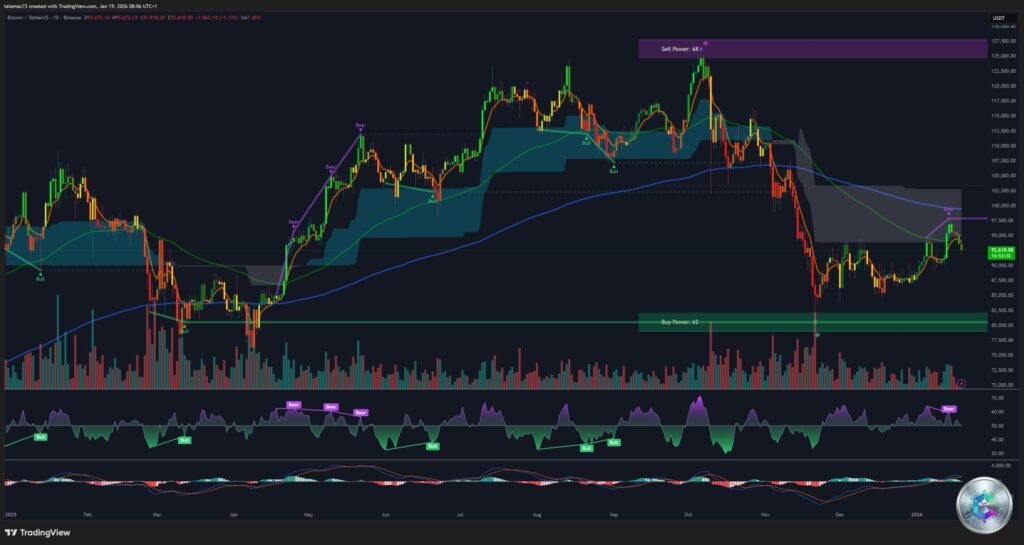
On the daily timeframe, Bitcoin is trading above its 50-day Simple Moving Average (SMA 50), located precisely at $90,355. This maintenance above this critical level suggests the underlying trend is not compromised despite the 3.6% correction.
BTC is evolving within a vast Rectangle formation, bounded by major support around $86,000 and resistance around $98,000 – $107,000. This configuration is typical of reaccumulation phases where weak hands transfer their positions to strong hands.
Key Daily Levels
- $107,000: Major resistance, rectangle breakout target
- $98,000: Intermediate resistance, consolidation top
- $96,011: Recent high on January 14, rejection point
- $92,000 – $92,500: Current battle zone, critical support
- $90,355: Confluence with SMA 50, institutional defense level
- $86,000: Structural support, rectangle bottom
4-Hour Analysis: Bullish Channel Breakdown
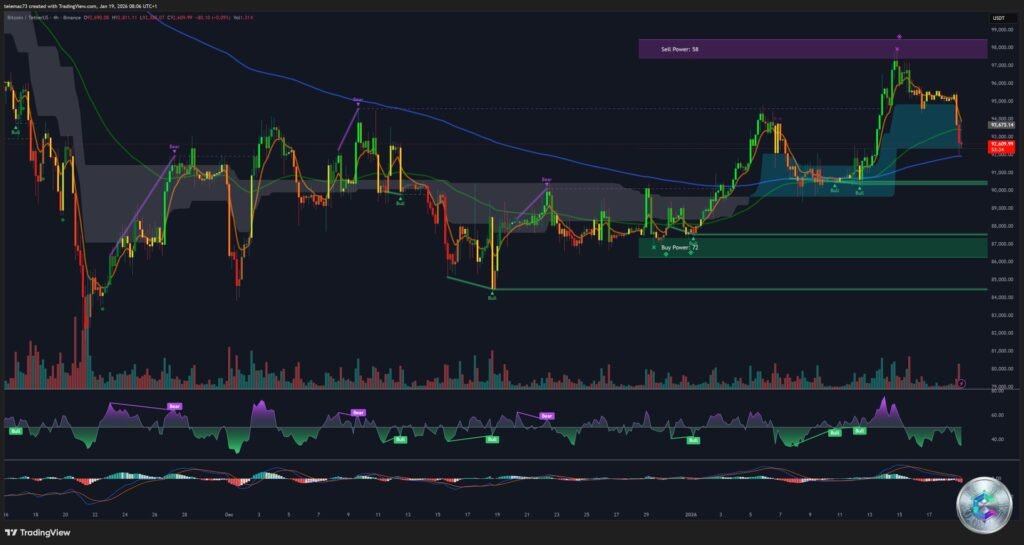
The H4 chart reveals the breakdown of the bullish channel that framed the price before the weekend. This break around $94,500 triggered a technical sell signal, accelerated by negative macroeconomic news.
The polarity principle now transforms the former $94,500 – $95,000 support into a new robust resistance. Any attempt to climb back toward this level will likely be sold by traders seeking to exit at break-even.
A significant demand zone (« Order Block ») sits between $91,500 and $92,200, the area that served as a springboard for the rally toward 96k. It’s natural for price to return and test the solidity of this base before any potential recovery.
15-Minute Microstructure: Volatility and Scalping Opportunities

Price action on M15 is characterized by erratic movements with frequent « fakeouts » (false breakouts) on both sides. The $92,572 level acts as an intraday magnetic pivot, around which price oscillates without clear direction.
The absence of significant new lows below $91,800 could indicate the formation of a potential « Double Bottom, » a bullish reversal pattern in the very short term. Active traders can exploit these oscillations for scalping strategies with strict risk management.
Liquidation Heatmap: The Magnetic Zones

Liquidation heatmaps reveal crucial information about zones where the market might gravitate. A massive concentration of liquidity sits just below $90,500 – $90,000, where long position stop-losses and liquidation thresholds are located.
A rapid « liquidation wick » toward $89,800 to trigger these stops before rebounding constitutes a classic institutional manipulation scenario. Conversely, short position liquidations concentrate around $94,800 and $96,500, creating potential for a « Short Squeeze » if Bitcoin manages to reclaim $93,500.
Probabilistic Scenarios for the Coming Days
Main Scenario: The Purge and Bounce (50%)
The market continues testing buyer conviction by descending to touch the daily SMA 50 around $90,350. At this level, institutional buy walls and dip hunters intervene massively, forming a long lower wick (Pin Bar) accompanied by a volume spike. Technical bounce target: $94,600.
Bullish Alternative Scenario: The V-Shaped Recovery (30%)
The market quickly digests the negative news. Bitcoin reclaims $93,500, invalidating the immediate bearish structure and trapping late short sellers in a squeeze. An H4 candle closing firmly above $94,000 would signal a rapid return toward $96,000 – $98,000.
Bearish Scenario: The Structural Break (20%)
An escalation of trade tensions or a fall in global equity markets could trigger a clean break below $90,000. In this case, price would slide toward the rectangle consolidation bottom at $86,000, delaying the bullish recovery for several weeks.
Conclusion: Opportunity in Turbulence
Bitcoin finds itself at a critical crossroads on January 19, 2026. The current correction, while violent, fits within the normal framework of a volatile uptrend. The liquidation of $600 million in long positions has cleaned up the market structure, creating conditions for a potential recovery.
The $90,000 – $90,500 zone represents a strategic intervention point for institutional investors. As long as this level holds, the underlying trend remains bullish. Current volatility should be treated as tactical noise to exploit, not as a fundamental paradigm shift.
Professional traders will favor strategic patience, avoiding aggressive trades in the current zone ($92,000 – $93,000) where the risk/reward ratio is poor. Monitoring the 90k pivot and waiting for confirmation signals of strength remain the most prudent approaches in this uncertain context.
Important Disclaimer: This article is provided for educational and informational purposes only. It does not constitute financial investment advice under any circumstances. Cryptocurrency markets are extremely volatile and carry significant risks of capital loss. Always conduct your own research (DYOR) and consult a qualified financial advisor before any investment decision. Never invest more than you can afford to lose.