
As of January 29, 2026, Bitcoin is navigating through a major turbulence zone that worries both institutional and retail investors. After reaching an all-time high of $126,186 in October 2025, the leading cryptocurrency has lost nearly 28% of its value and is now oscillating dangerously around $88,000.
A Hostile Macroeconomic Context
The Federal Reserve maintains its restrictive stance with interest rates between 3.50% and 3.75%, refusing any rate cuts anticipated by the markets. Persistent inflation at 2.7% and a solid labor market (unemployment rate at 4.4%) justify this monetary prudence that weighs heavily on risk assets.
Even more concerning, Bitcoin fails to capture the risk premium linked to concerns about US debt ($38.5 trillion). While gold establishes new records above $5,500 per ounce, Bitcoin stagnates, revealing a disconnect between the « digital gold » narrative and market reality.
Technical Analysis: The Daily View
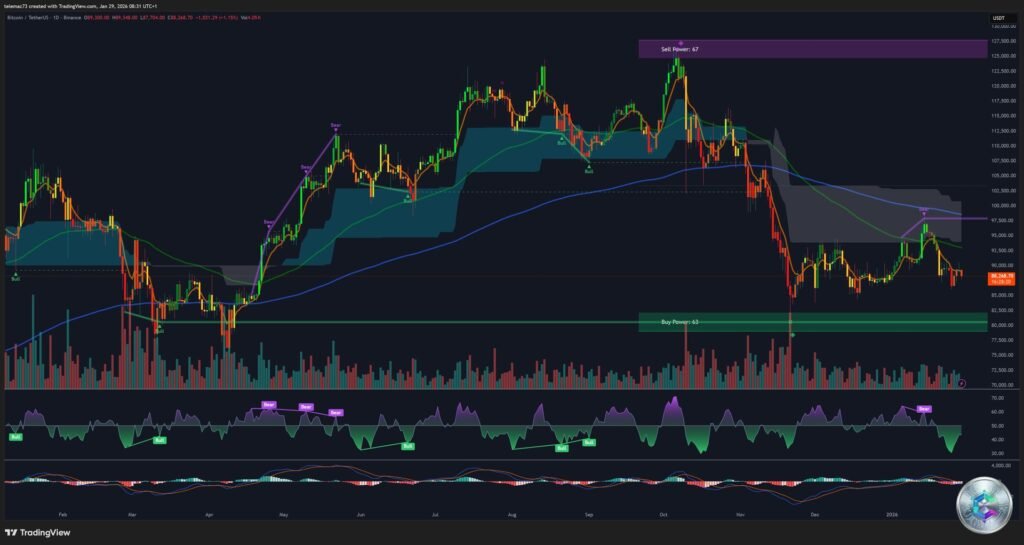
The daily chart reveals an alarming technical structure. Bitcoin is locked in a descending channel since October 2025, and the price is currently testing the 200-day moving average (MA200) at $88,998 – a crucial demarcation line between bull and bear markets.
Key technical indicators:
- RSI at 33.3: close to oversold zone but not yet in extreme capitulation
- MACD at -212.4: momentum firmly in sellers’ hands
- All moving averages (MA5 to MA200) display a « Sell » signal
This unanimous bearish consensus of moving averages constitutes a major alert signal requiring a powerful fundamental catalyst to be reversed.
4-Hour View: Battle Zones

The 4-hour timeframe illustrates a fierce battle between buyers and sellers. A major resistance zone extends between $97,000 and $98,000, identified as a high « Sell Power » zone. Conversely, a critical support zone lies between $85,000 and $86,000, marked as a « Buy Power » zone.
Each rebound attempt is stopped by a descending moving average acting as a dynamic ceiling, suggesting an accumulation of selling pressure on each rally.
Short-Term Trading: 15-Minute Volatility
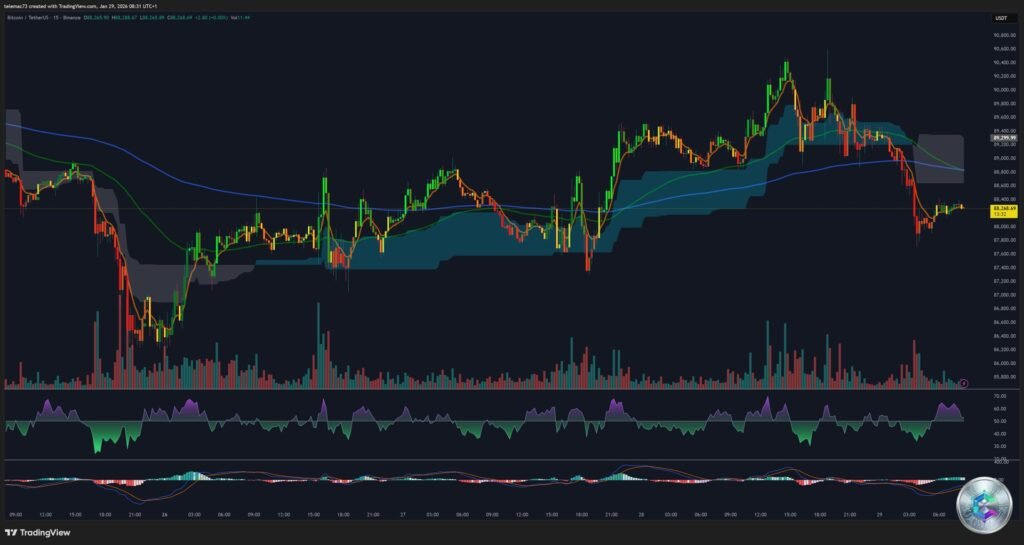
In the very short term, Bitcoin oscillates around the central pivot of $89,004 with an Average True Range (ATR) of 611.4. This means movements of $600 to $800 within a few hours are common, making high-leverage trading extremely risky.
The inability to maintain a close above $88,500 in 15 minutes underscores the fragility of immediate buyers and confirms seller dominance.
Heatmap: Where Is Liquidity Hiding?
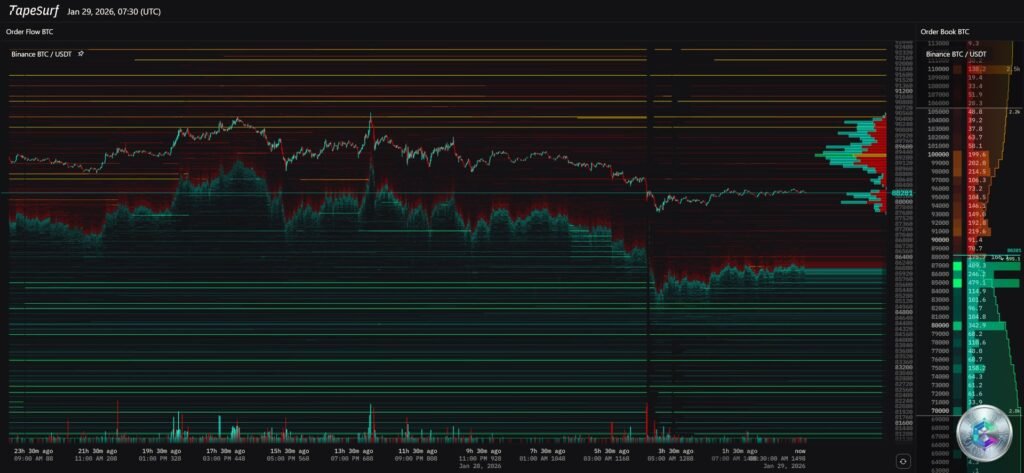
Order book analysis on Binance reveals critical liquidity concentrations. A massive « sell wall » is visible between $90,000 and $92,000, acting as a magnet pushing the price downward. Significant clusters also appear around the psychological level of $100,000.
On the buy side, supports are concentrated between $86,000 and $84,000, with substantial interest at $85,000. Below, extremely dense liquidity zones are visible at $80,000 and $70,000 – the ultimate supports in case of breakdown.
Pivot Points and Critical Levels
| Level | Price | Meaning |
|---|---|---|
| R3 | $89,673 | Maximum intraday bounce target |
| R2 | $89,445 | Probable rejection zone |
| R1 | $89,232 | First obstacle to recovery |
| Pivot | $89,004 | Bullish/bearish boundary |
| S1 | $88,791 | Immediate support tested |
| S2 | $88,563 | Buyer defense zone |
| S3 | $88,351 | Intraday capitulation level |
The current price position (approximately $88,281) below the daily S3 support places Bitcoin in an extreme oversold condition in the very short term.
ETF Shock: Institutions Withdrawing
The week of January 23, 2026 marks a worrying turning point: crypto ETFs recorded their largest weekly outflow since mid-November 2025, totaling $1.73 billion in net outflows. BlackRock’s IBIT fund, market leader with 53% share ($71.26 billion under management), suffered withdrawals of $420.77 million.
A crucial indicator: the average cost basis of institutions via US ETFs is estimated at $79,800. With a current price around $88,000, institutions maintain a latent profit of approximately 10%. If the price approaches $80,000, we could witness an acceleration of sales to protect capital.
Market Sentiment: Fear Dominates
The Fear and Greed Index currently sits at 29, corresponding to a state of « Fear. » Although improved from the level of 20 (« Extreme Fear ») reached earlier in January, it remains well below its 2025 historical average.
Retail investors hesitate to « buy the dip, » preferring to wait for clearer reversal signals. Prediction platforms like Polymarket show a 49% probability that Bitcoin will fall below $85,000 by the end of January 2026.
Scenarios for the Coming Weeks
Bearish Scenario (60% Probability)
The most likely scenario is a continuation of the sideways-bearish drift. The lack of bullish catalyst, combined with Fed firmness and ETF capital outflows, suggests Bitcoin could test major support at $85,000, or even $84,315. A break of this level would open the way toward $80,000, where the institutional cost basis lies.
Recovery Scenario (40% Probability)
To invalidate the bearish trend, Bitcoin must imperatively reclaim the central pivot at $89,004 and close above the 20-day moving average at $90,502. Such a move would require a positive surprise on the inflation front or a massive return of buyer flows into BlackRock’s IBIT. If Bitcoin manages to stabilize above $92,600, the « bottom » narrative would be validated, then targeting a return toward $98,000.
Conclusion: Caution and Risk Management
The « Strong Sell » market structure on daily charts and record institutional outflows suggest the correction process is not over. The supports at $86,000 and $85,000 are essential ramparts before a possible capitulation toward $80,000.
Key points to monitor:
- The $89,004 pivot as a decisive psychological level
- Correlation with gold and flight to quality
- Weekly ETF flows (critical threshold at -$1B)
- Order absorption at $85,000 on the heatmap
Rigorous risk management and leverage reduction are imperative in this environment of persistent « Fear. »
Disclaimer: This article is provided for educational and informational purposes only. It does not constitute investment advice or a recommendation to buy or sell Bitcoin or any other financial asset. Cryptocurrency markets are extremely volatile and carry significant risks of capital loss. Always consult a qualified financial advisor before making any investment decision. The technical analyses and predictions presented in this article do not guarantee future results.