
As of April 3, 2026, Bitcoin is navigating a zone of extreme compression, caught between growing institutional adoption and unfavorable macroeconomic headwinds. This comprehensive analytical report decodes the charting dynamics, on-chain flows, and geopolitical catalysts that will dictate BTC’s trajectory throughout Q2 2026.
1. Macroeconomic Context: The Risk Matrix
1.1 Middle East Tensions and Energy Shock
The global risk environment is heavily weighed down by the rapid deterioration of diplomatic relations between the United States and Iran. The American administration has pushed back the threat of direct confrontation to April 6, 2026, offering a temporary reprieve to risk asset markets and allowing Bitcoin to stage a slight rebound toward the $68,000 zone after flirting with $65,700.
Meanwhile, WTI crude oil has crossed the symbolic threshold of $111 per barrel, reviving the specter of persistent inflation and fueling concerns about the stability of the Strait of Hormuz. Against this backdrop, a fascinating inter-market divergence has materialized: gold closed March 2026 down more than 11%, while Bitcoin gained 2%, breaking a negative spiral of five consecutive months.
This decorrelation suggests that sophisticated capital is beginning to evaluate Bitcoin not only as a standard risk asset, but potentially as a sovereign hedge against geopolitical instability.
1.2 The April 3 NFP Report: An Exceptional Catalyst
The release of the March 2026 Non-Farm Payrolls (NFP) report carries exceptional weight this Friday. In February, the US economy suffered an unexpected destruction of 92,000 jobs (vs. a consensus of +59,000), reigniting 12-month recession probabilities now assessed at 30%. The March consensus anticipates a modest rebound between 57,000 and 62,000 private job creations.
The absolute singularity of this release: April 3 coincides with Good Friday, resulting in the complete closure of the NYSE and Nasdaq. The crypto market thus becomes the only liquid global market capable of reacting instantly to macroeconomic data, potentially amplifying Bitcoin volatility.
| Indicator | February 2026 | March 2026 Consensus | BTC Impact |
|---|---|---|---|
| NFP (job creations) | -92,000 | +57,000 to +62,000 | Inversely correlated |
| Unemployment Rate | 4.3% | 4.3% | Positive if moderate rise |
| WTI Oil | ~$90 | > $111 | Bearish pressure (inflation) |
| 12m Recession Probability | 20% | 30% | Complex (flight to liquidity) |
2. Institutional Dynamics and On-Chain Flows
2.1 The Bitcoin Spot ETF Recalibration
After absorbing more than $2 billion in net inflows between late February and mid-March, US Bitcoin Spot ETFs are going through a recalibration phase. On March 31st, they still attracted $117.5 million, but April 1st marked a temporary capitulation with net outflows of $174 million. Faced with macroeconomic uncertainty, fund managers are mechanically reducing the beta of their portfolios.
Notable inflection point: March 26 was the first day of 2026 where Bitcoin, Ethereum and Solana ETFs simultaneously recorded net outflows, coinciding with the massive expiration of $14.16 billion in quarterly options on Deribit.
2.2 Whales, Long-Term Holders and New Demographic Profiles
On-chain analysis reveals a deep behavioral schism. « Whales » are displaying a directional conviction deficit, with an increase in BTC deposits on exchanges — a traditional distribution signal. Monthly apparent demand is negative by 63,000 BTC relative to mining issuance.
In contrast, Long-Term Holders (LTH) are displaying remarkable resilience with a 48.5% increase in their demand, characteristic of a Wyckoffian re-accumulation phase. Demographically, 61% of crypto futures traders now belong to Generation Z, with a 20% year-over-year increase in female participation.
3. Order Book Heatmap Analysis: The Liquidity Battle
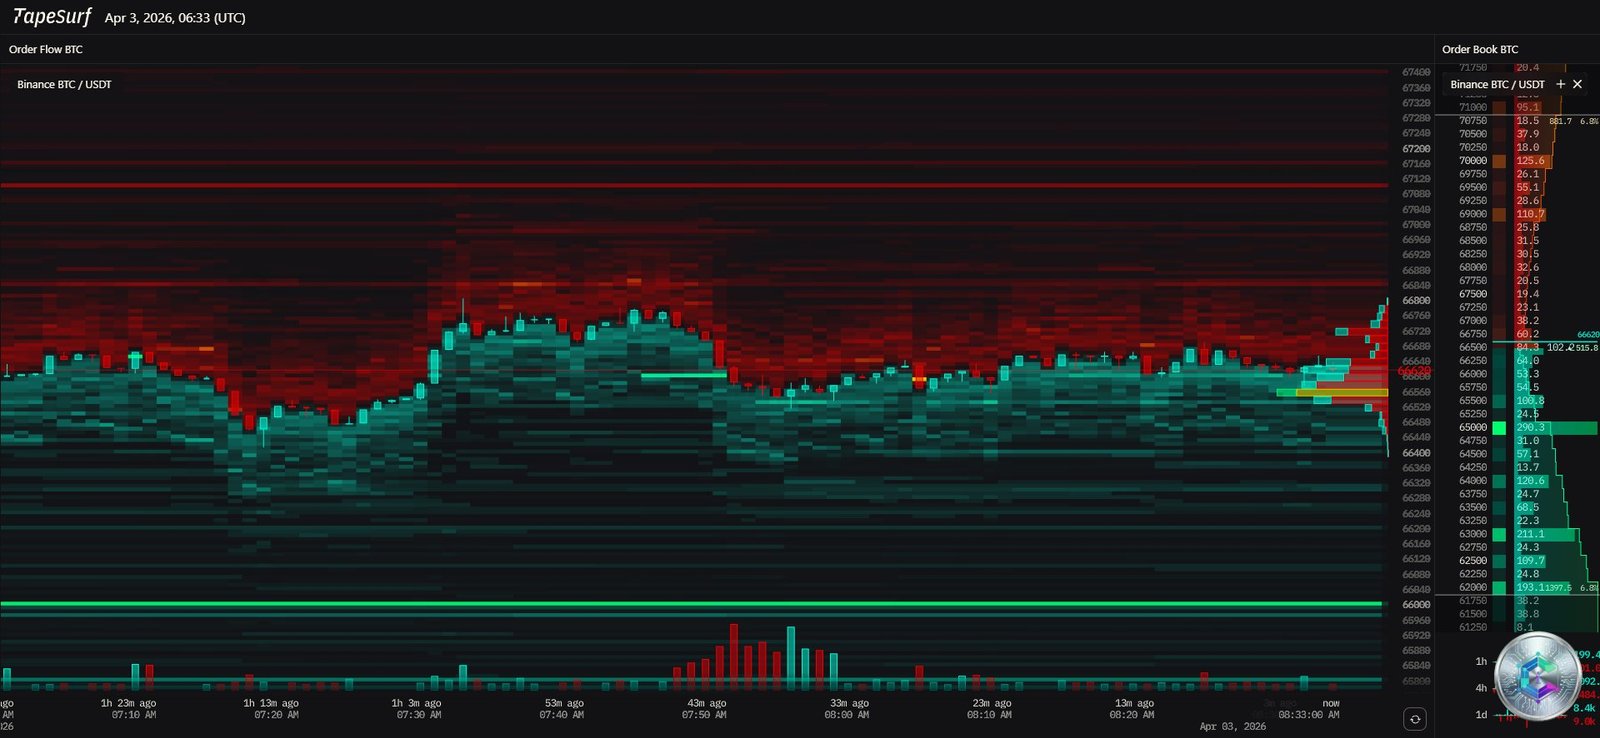
The TapeSurf heatmap reveals a highly asymmetric liquidity environment. The price, oscillating around $66,600, navigates between two opposing forces:
- Massive red resistance between $67,200 and $71,000: colossal accumulation of limit sell orders (ask walls) and short position stop-losses. A breakthrough of this zone would trigger a potentially explosive Short Squeeze toward $70,000+.
- Deep green support between $62,000 and $62,500: massive institutional buying wall. The relative absence of thick buying liquidity immediately below $66,600 creates a structural vulnerability to cascading Long Squeezes.
Notably: the history of $299 million in liquidations at the end of March, 85% of which were long positions destroyed, demonstrates the formidable effectiveness of these liquidity sweeps.
4. Multi-Timeframe Chart Analysis
4.1 Daily Chart: Consolidation and Structural Indecision
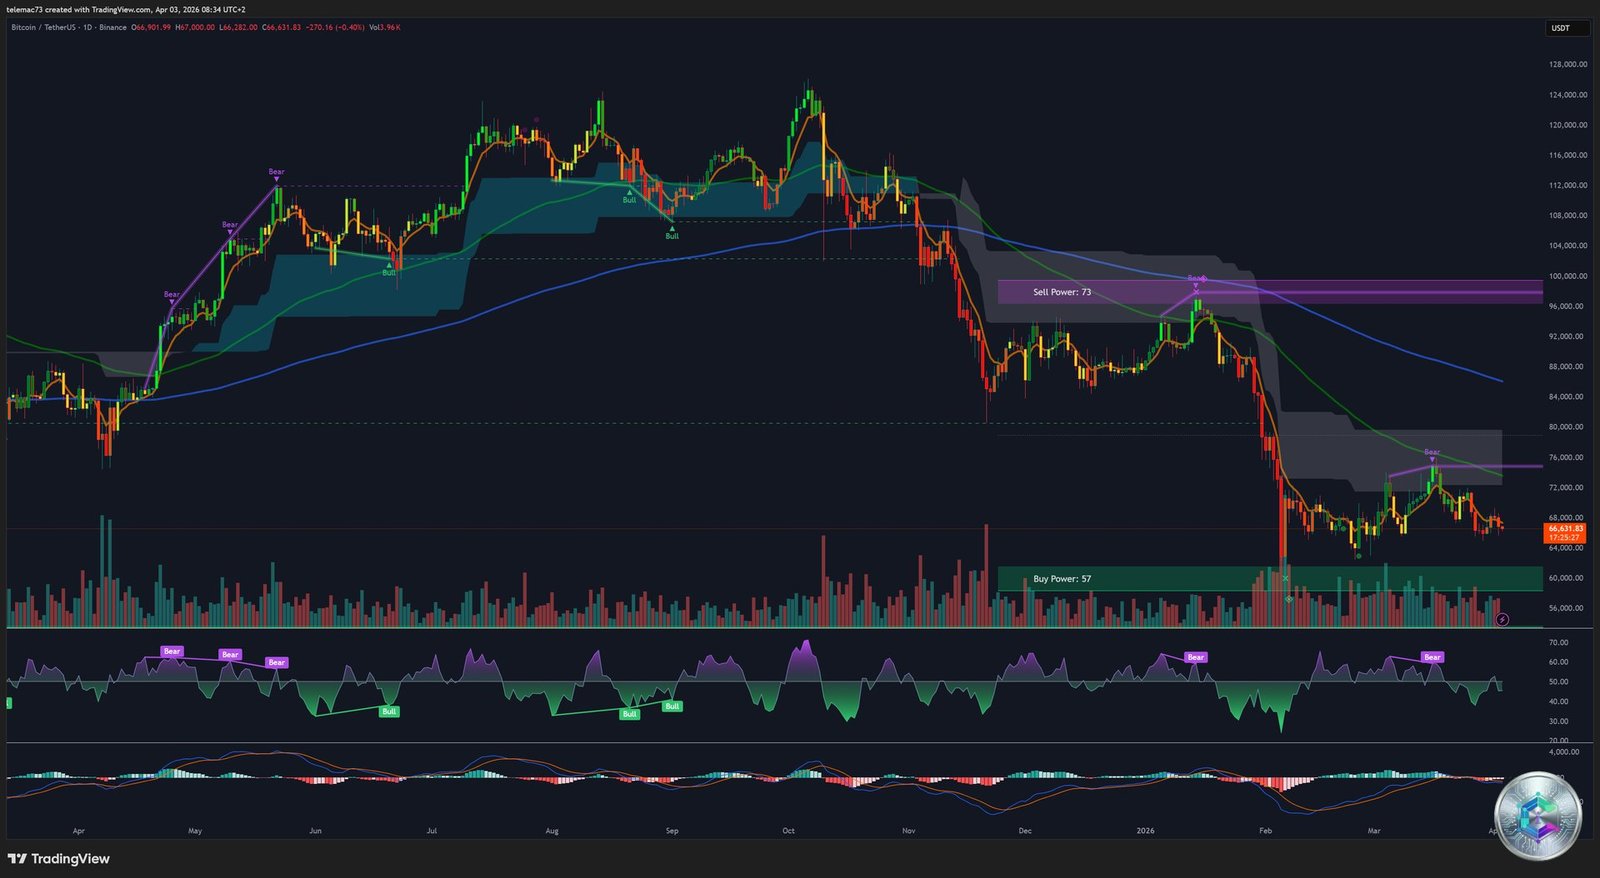
Bitcoin has been moving within a lateral consolidation corridor for more than 50 days, bounded by an institutional floor at $60,000 and a distribution ceiling at $73,000. Technical indicators send indecision signals:
- 50-day EMA (~$68,973): the price ($66,631) struggles to stay above it, printing a sequence of lower highs.
- Daily RSI (~46): total indecision territory, slightly bearish-biased, but offering equal room to maneuver in both directions.
- MACD: histogram at the zero line, technically negative but losing bearish momentum — possible bullish crossover if a positive catalyst emerges.
- Bollinger Bands: visible contraction indicating a squeeze in gestation, heralding an impulsive move toward $74,482 or downward.
4.2 4-Hour Chart: Distress Signals and Compression
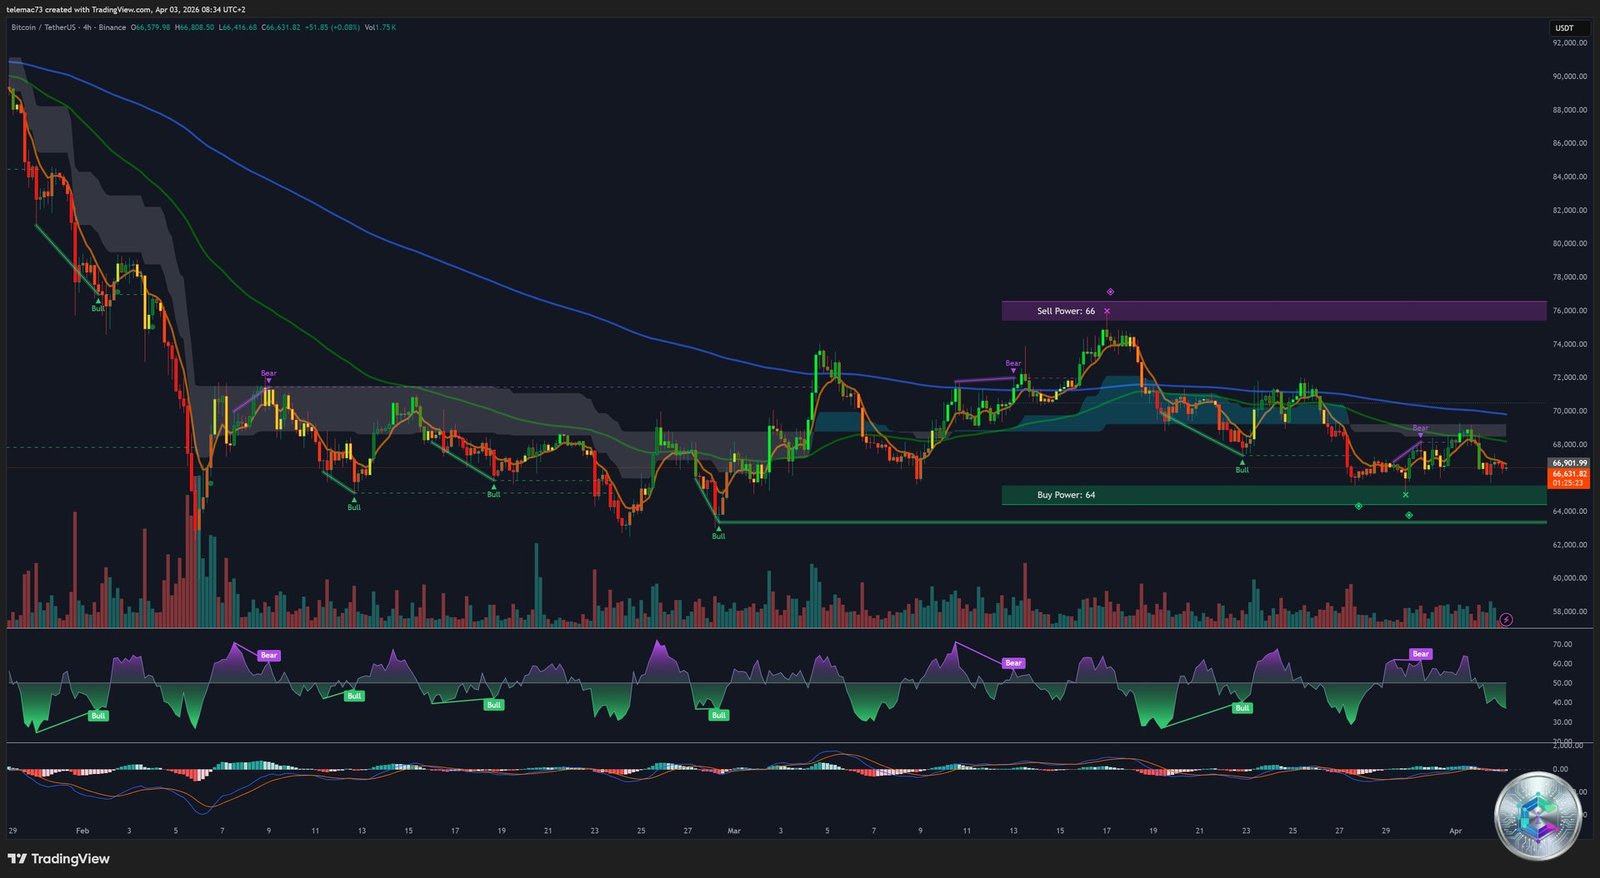
The 4H horizon is dominated by a symmetrical compression triangle, with successive lower highs as resistance and a horizontal support defended between $64,000 and $66,000. The recent correction has structured itself as a Bear Flag — a break below $66,000 would validate bearish continuation. A local Death Cross confirms the sellers’ temporary control of price action.
4.3 15-Minute Chart: Algorithmic Market Noise
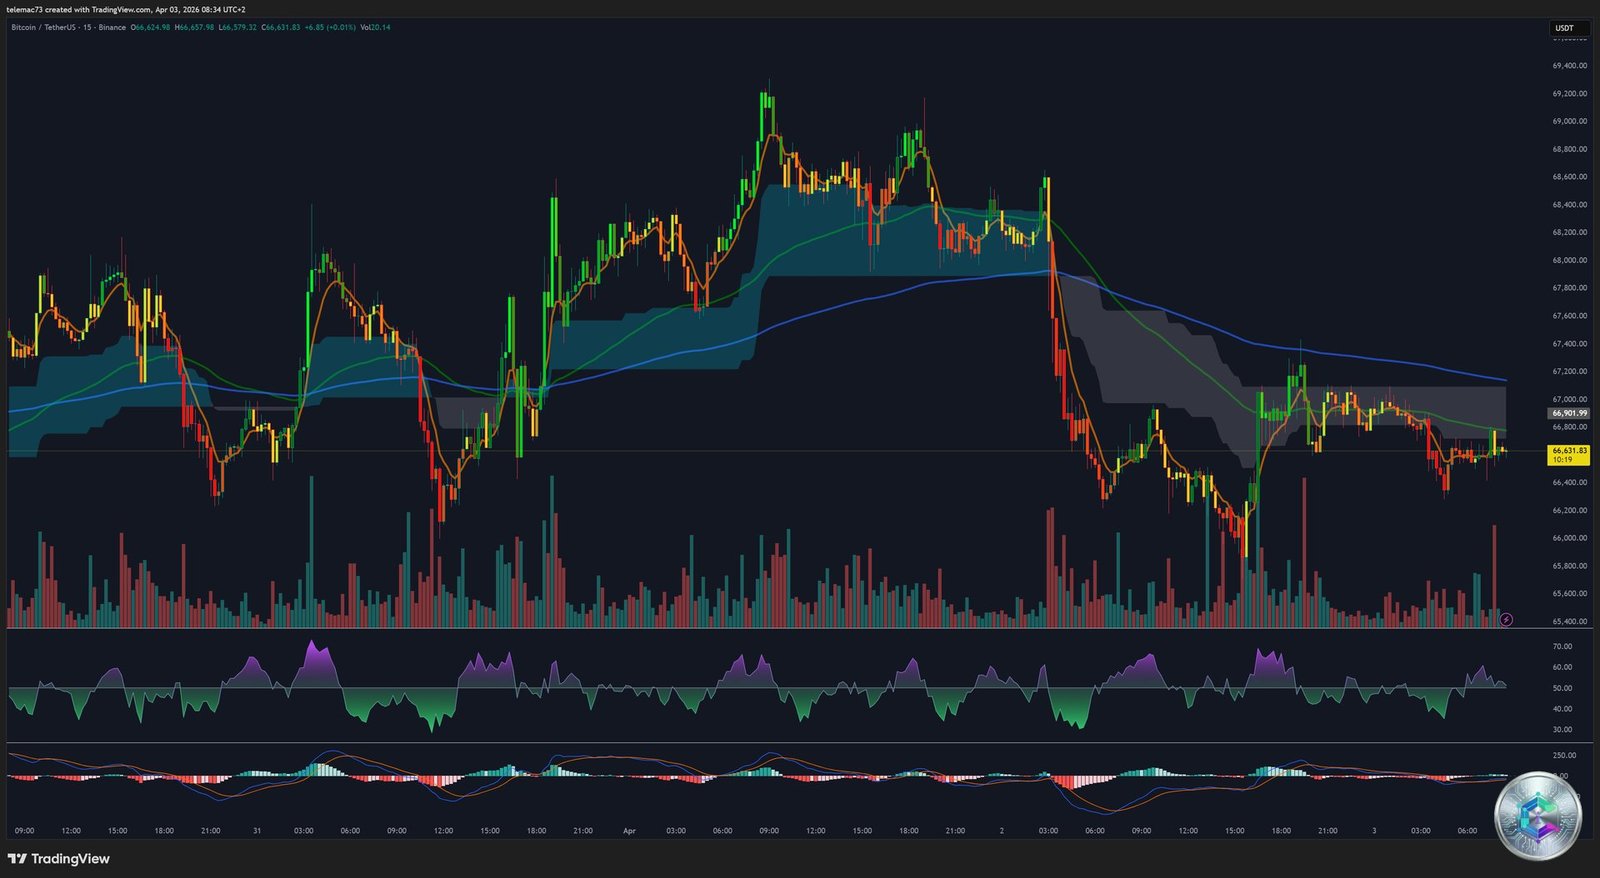
The 15M scale reveals jerky and erratic price action, characteristic of institutional accumulation/distribution phases via Iceberg orders. RSI plunges into extreme oversold zones trigger algorithmic mean-reversion buying, explaining the sudden V-bottom rebounds. Geopolitical headlines on Iran generate visible red waves of selling panic on the momentum indicator.
5. The Altcoin Ecosystem: Amplified Beta and Correlation
Bitcoin remains the undisputed market conductor: in the absence of a strong idiosyncratic narrative, altcoins follow BTC with amplified beta. Ethereum (ETH) is trading around $2,000–$2,124, posting a weekly decline of up to 7.19%. Solana (SOL) maintains a crucial support level around $83.
The scenario is binary for altcoins: a BTC drop below $66,000 would trigger purges of 6% to 13% (XRP, BNB, Cardano, Dogecoin were already hit last week). A BTC targeting $80,000 could propel Solana beyond the $100 psychological resistance.
6. Price Scenarios for Q2 2026
🔴 Scenario 1 — Bearish Capitulation (High Probability Short-Term)
A strong NFP (validating the Fed’s high rate maintenance), combined with oil >$111 and the expiration of the Iran deadline on April 6, would trigger severe risk aversion. Bear Flag breakdown below $66,000, cascading Long Squeeze, targets: $62,500 then $60,000. The $60,000 threshold is the absolute demarcation line of the 2026 bull market.
🟢 Scenario 2 — Short Squeeze and Bullish Expansion (Moderate Probability)
A disastrous NFP (forcing the Fed to pivot), a Middle East de-escalation, or a return of institutional capital could propel BTC beyond the 50-day EMA ($68,973). An attack on the $69,500–$70,000 zone would trigger an algorithmic Short Squeeze, targets: $73,175, $74,482 (upper Bollinger), then $80,000.
🟡 Scenario 3 — Prolonged Consolidation (Non-Negligible Probability)
Faced with uncertainty (neutral RSI at 46, flat MACD), market participants could opt for a wait-and-see approach. Bitcoin would continue oscillating in the $66,000–$70,000 range, grinding the capital of high-leverage traders through micro liquidity hunts. Directional resolution deferred to April CPI data.
| Scenario | Macro Triggers | Chart Mechanics | Price Targets |
|---|---|---|---|
| 🔴 Bearish | Strong NFP, rates maintained, Iran crisis, ETF outflows | 4H Bear Flag breakdown, Long Squeeze below $66K | $65K → $62,500 → $60,000 |
| 🟢 Bullish | Weak NFP, Middle East peace, institutional return | 50 EMA breakout, Short Squeeze red cluster | $69,500 → $73,175 → $80,000 |
| 🟡 Neutral | Status quo, prolonged uncertainty | $66K–$70K oscillation, continued compression | Trading range maintained |
Conclusion
Bitcoin finds itself at a critical crossroads in early April 2026. The asset is trapped in a Gordian knot of contradictory pressures: the optimism of long-term investors clashes head-on with the cyclical pessimism dictated by stagflation, monetary tightening and global geopolitical turbulence. Holding the pivot support of $65,000–$66,000 is the fundamental prerequisite to avoiding a systemic degradation of the 2026 bull market architecture. The crypto market’s reaction to this Good Friday NFP data will serve as the ultimate stress test to determine the investment paradigm for the entire upcoming cycle.
⚠️ Disclaimer: This article is published for exclusively educational and informational purposes. It does not constitute investment advice or a recommendation to buy or sell digital assets. Cryptocurrency markets are highly volatile and speculative. Investing involves risk of capital loss. Please consult a licensed financial advisor before making any investment decisions.